. 2019 Apr;25(4):641-655.
doi: 10.1038/s41591-019-0379-5. Epub 2019 Apr 1.

Platelet GPIbα is a mediator and potential interventional target for NASH and subsequent liver cancer

Mohsen Malehmir #  1 Dominik Pfister #  2 Suchira Gallage #  2 Marta Szydlowska #  2 Donato Inverso #  3   4 Elena Kotsiliti  2   5 Valentina Leone  2   6 Moritz Peiseler  7   8 Bas G J Surewaard  8   9   10 Dominik Rath  11 Adnan Ali  2 Monika Julia Wolf  1 Hannah Drescher  12 Marc E Healy  1 Daniel Dauch  13   14 Daniela Kroy  12 Oliver Krenkel  12 Marlene Kohlhepp  12 Thomas Engleitner  15   16   17 Alexander Olkus  2   18 Tjeerd Sijmonsma  2 Julia Volz  19 Carsten Deppermann  19 David Stegner  19 Patrick Helbling  20 César Nombela-Arrieta  20 Anahita Rafiei  20 Martina Hinterleitner  13   14 Marcel Rall  11 Florian Baku  11 Oliver Borst  11 Caroline L Wilson  21 Jack Leslie  21 Tracy O'Connor  5   22 Christopher J Weston  23 Abhishek Chauhan  23 David H Adams  23   24 Lozan Sheriff  25 Ana Teijeiro  26 Marco Prinz  27   28   29 Ruzhica Bogeska  30   31 Natasha Anstee  30   31 Malte N Bongers  32 Mike Notohamiprodjo  32 Tobias Geisler  33 Dominic J Withers  34   35 Jerry Ware  36 Derek A Mann  21 Hellmut G Augustin  3   4 Alexandros Vegiopoulos  37 Michael D Milsom  30   31 Adam J Rose  38 Patricia F Lalor  23 Josep M Llovet  39   40   41 Roser Pinyol  40 Frank Tacke  12 Roland Rad  15   16   17 Matthias Matter  42 Nabil Djouder  26 Paul Kubes  7   8   9 Percy A Knolle  22 Kristian Unger  6 Lars Zender  13   14   43 Bernhard Nieswandt  19 Meinrad Gawaz  11 Achim Weber  44 Mathias Heikenwalder  45   46
Affiliations

Platelet GPIbα is a mediator and potential interventional target for NASH and subsequent liver cancer

Mohsen Malehmir et al. Nat Med. 2019 Apr.

Erratum in

  • Author Correction: Platelet GPIbα is a mediator and potential interventional target for NASH and subsequent liver cancer.
    Malehmir M, Pfister D, Gallage S, Szydlowska M, Inverso D, Kotsiliti E, Leone V, Peiseler M, Surewaard BGJ, Rath D, Ali A, Wolf MJ, Drescher H, Healy ME, Dauch D, Kroy D, Krenkel O, Kohlhepp M, Engleitner T, Olkus A, Sijmonsma T, Volz J, Deppermann C, Stegner D, Helbling P, Nombela-Arrieta C, Rafiei A, Hinterleitner M, Rall M, Baku F, Borst O, Wilson CL, Leslie J, O'Connor T, Weston CJ, Chauhan A, Adams DH, Sheriff L, Teijeiro A, Prinz M, Bogeska R, Anstee N, Bongers MN, Notohamiprodjo M, Geisler T, Withers DJ, Ware J, Mann DA, Augustin HG, Vegiopoulos A, Milsom MD, Rose AJ, Lalor PF, Llovet JM, Pinyol R, Tacke F, Rad R, Matter M, Djouder N, Kubes P, Knolle PA, Unger K, Zender L, Nieswandt B, Gawaz M, Weber A, Heikenwalder M. Malehmir M, et al. Nat Med. 2022 Mar;28(3):600. doi: 10.1038/s41591-022-01693-7. Nat Med. 2022. PMID: 35181768 No abstract available.

Abstract

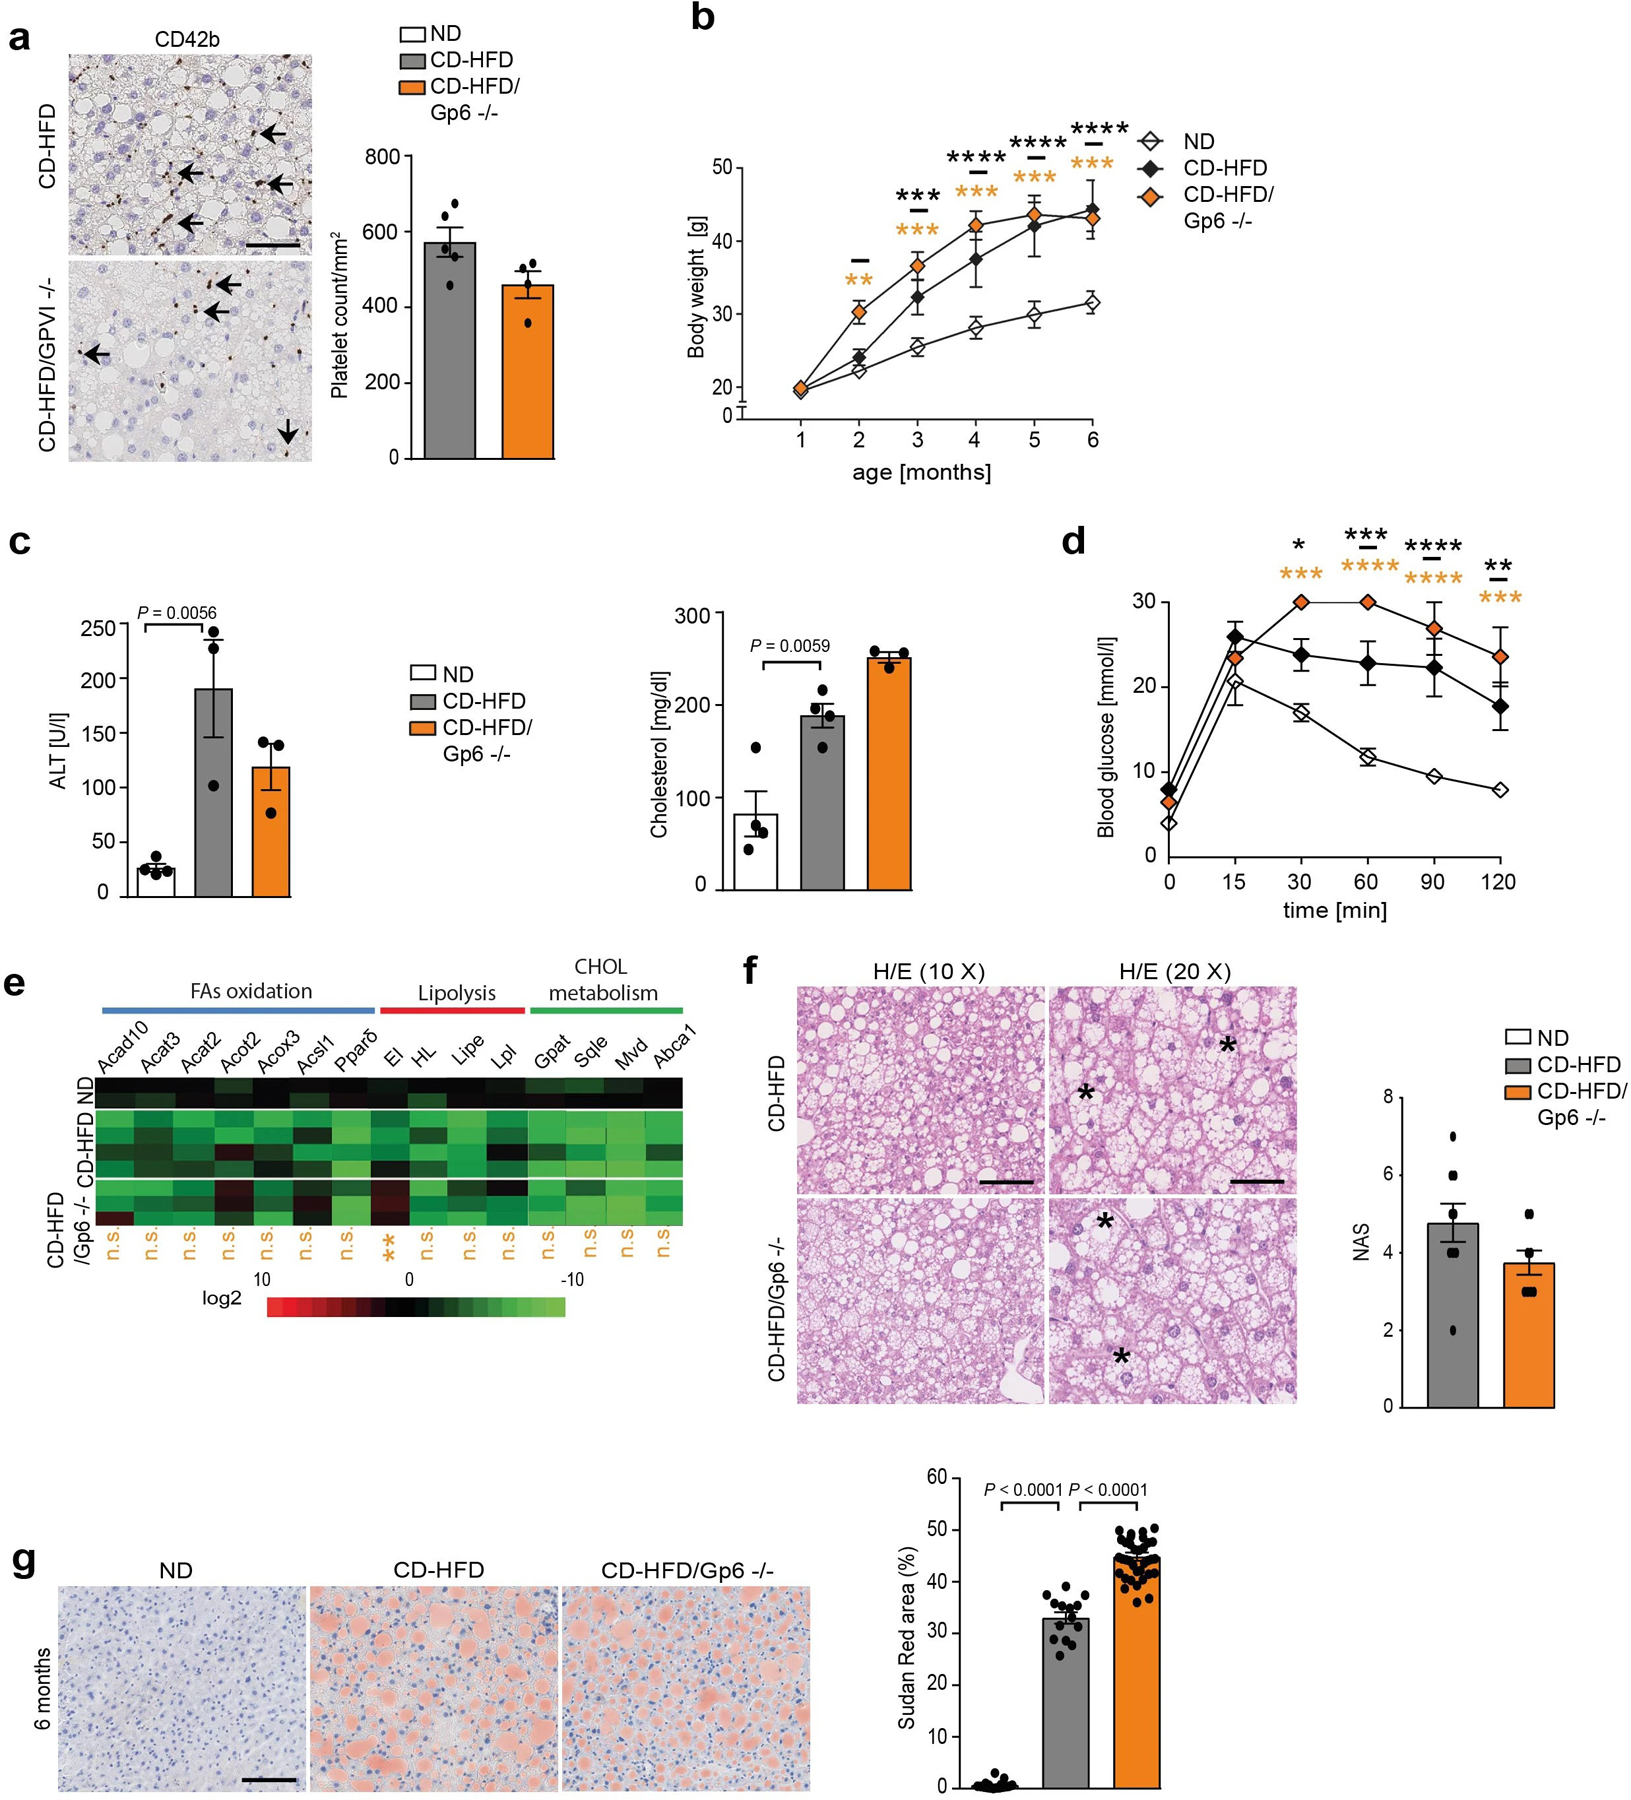
Non-alcoholic fatty liver disease ranges from steatosis to non-alcoholic steatohepatitis (NASH), potentially progressing to cirrhosis and hepatocellular carcinoma (HCC). Here, we show that platelet number, platelet activation and platelet aggregation are increased in NASH but not in steatosis or insulin resistance. Antiplatelet therapy (APT; aspirin/clopidogrel, ticagrelor) but not nonsteroidal anti-inflammatory drug (NSAID) treatment with sulindac prevented NASH and subsequent HCC development. Intravital microscopy showed that liver colonization by platelets depended primarily on Kupffer cells at early and late stages of NASH, involving hyaluronan-CD44 binding. APT reduced intrahepatic platelet accumulation and the frequency of platelet-immune cell interaction, thereby limiting hepatic immune cell trafficking. Consequently, intrahepatic cytokine and chemokine release, macrovesicular steatosis and liver damage were attenuated. Platelet cargo, platelet adhesion and platelet activation but not platelet aggregation were identified as pivotal for NASH and subsequent hepatocarcinogenesis. In particular, platelet-derived GPIbα proved critical for development of NASH and subsequent HCC, independent of its reported cognate ligands vWF, P-selectin or Mac-1, offering a potential target against NASH.


Conflict of interest statement

Competing interests

J.M.L. receives consulting fees from Bayer HealthCare Pharmaceuticals, Eli Lilly, Bristol-Myers Squibb, Merck, Eisai Inc, Celsion Corporation, Exelixis, Merck, Ipsen, Glycotest, Navigant, Leerink Swann LLC, Midatech Ltd, Fortress Biotech, Sprink Pharmaceuticals and Nucleix and research support from Bayer HealthCare Pharmaceuticals, Eisai Inc, Bristol-Myers Squibb and Ipsen. This article presents independent research supported in part by the National Institute for Health Research (NIHR) Birmingham Biomedical Research Centre. The views expressed are those of the author(s) and not necessarily those of the National Health Service, the NIHR, or the Department of Health.

Figures

Extended Data Fig. 1 |
Extended Data Fig. 1 |. Transcriptional alterations in the course of NASH and physical interaction of immune cells, liver endothelium and platelets.
a. GSEA and expression analysis of genes related clusters of platelet activation, aggregation, degranulation and genes associated to TNFα family regulation, cytokine interaction and lymphocyte migration from 6 months ND-fed versus CD-HFD-fed mice. bg, Gene expression alterations found in annotated genes of indicated clusters and mice shown in a. h, Gene expression alterations found in annotated genes of indicated cluster of cell chemotaxis (left) and GSEA and expression analysis of genes associated to the cell chemotaxis cluster from mice shown in a (right). i, Transcriptional alterations for genes associated with platelet activation/aggregation of the 7.5 month ND versus WD-HTF fed mice.
Extended Data Fig. 2 |
Extended Data Fig. 2 |. Sulindac treatment does not prevent NASH pathology.
a, Left, mouse weight development in 12 months ND-, CD-HFD- or CD-HFD/sulindac-fed mice (n = 5 mice/group). Statistics: ND vs CD-HFD (black asterisks), ND vs CD-HFD/sulindac (red asterisks). Middle, liver/body weight (6 months: n = 5 mice/group; 12 months: ND n = 3 mice; CD-HFD n = 8 mice; CD-HFD/sulindac n = 7 mice) and (right) ALT levels of 6 and 12 months ND-, CD-HFD- or CD-HFD/sulindac-fed mice (6 months: ND n = 3 mice; CD-HFD n = 4 mice; CD-HFD/sulindac n = 5 mice; 12 months: ND n = 7 mice; CD-HFD n = 12 mice; CD-HFD/sulindac = 5 mice). b, (left) Liver triglycerides and (middle) serum cholesterol levels in 6 and 12 months ND-, CD-HFD- or CD-HFD/sulindac-fed mice (liver TGs 6 months: ND = 7 mice; CD-HFD n = 11 mice; CD-HFD/sulindac n = 4 mice; Liver TGs 12 months: ND n= 4 mice; CD-HFD n = 9 mice; CD-HFD/sulindac n = 10 mice; cholesterol 6 months: ND n = 4 mice; CD-HFD n = 4 mice; CD-HFD/sulindac n = 5 mice; cholesterol 12 months: ND n = 6 mice; CD-HFD n = 10 mice; CD-HFD/sulindac n = 10 mice). (right) IPGTT performed with 6 months ND-, CD-HFD- or CD-HFD/sulindac-fed mice (n = 5 mice/group). Statistics: ND vs CD-HFD (black asterisks). (c) MRI analyses of livers of 6 months ND-, CD-HFD- or CD-HFD/sulindac-fed mice (n = 3 mice/group). d, (left) Analysis by H&E indicate damaged hepatocytes (asterisk) and (right) evaluation by NAS in livers of 6 months CD-HFD- or CD-HFD/sulindac-fed mice (ND n = 9 mice; CD-HFD n = 9 mice; CD-HFD/sulindac n = 10 mice), scale bars: 100 µm in 10×, 50 µm in 20×. e, Real-time qPCR analysis for mRNA of genes involved in lipid metabolism in liver of 6 months ND-, CD-HFD- or CD-HFD/sulindac-fed mice (ND n = 4 mice; CD-HFD n = 5 mice; CD-HFD/sulindac n = 3 mice). Comparison between CD-HFD vs CD-HFD/sulindac. f, Sudan red staining and quantification for fat accumulation of 6 months ND-, CD-HFD- or CD-HFD/sulindac-fed mice (ND n = 5; CD-HFD n = 4; CD-HFD/sulindac n = 5). Scale bar: 100 µm. All data are shown as mean ± s.e.m. Data in a (left) and b (right) were analyzed by two-way analysis of variance with post hoc Tukey’s multiple comparison test. Data in a (middle and right), b (left and middle), d and f were analyzed by one-way analysis of variance with post hoc Tukey’s multiple comparison test. Data in e were analyzed by two-tailed Mann-Whitney t test. *P < 0.05, **P < 0.01, ***P < 0.001, ****P < 0.0001.
Extended Data Fig. 3 |
Extended Data Fig. 3 |. Ticagrelor treatment attenuates CD-HFD-induced NASH and NASH-associated conditions, and prevents HCC.
a, CD42b staining and quantification in 6 months CD-HFD or CD-HFD/Ticagrelor fed mice (CD-HFD n = 4 mice; CD-HFD/Ticagrelor n = 8 mice), scale bar: 50 µm. b, 3D confocal images of platelet (green)/liver endothelium (grey) interaction in livers of 6 months ND, CD-HFD and CD-HFD/Ticagrelor fed mice (n = 4 mice/group), scale bar: 20 μm. Quantification of platelet (PLT) aggregate size, overall PLT surface and quantification of platelet/liver endothelium coverage in focus of view (n = 4 mice/group). For visualization of intravascular events, the transparency of the sinusoidal rendering was set to 50%. c, Body weight development in 12 months ND, CD-HFD or CD-HFD/Ticagrelor fed mice (ND n = 4 mice; CD-HFD n = 6 mice; CD-HFD/Ticagrelor n = 4 mice). Statistics: ND vs CD-HFD (black asterisks), ND vs CD-HFD/Ticagrelor (green asterisks). dh ALT (d), Liver triglyceride (e), serum cholesterol levels (f), VLDL secretion in serum (g) and IPGTT (h) of 6 months ND, CD-HFD or CD-HFD/Ticagrelor fed mice (ALT: ND n = 8 mice; CD-HFD n = 5 mice; CD-HFD/Ticagrelor n = 10 mice; liver triglycerides: ND n = 7 mice; CD-HFD n = 11 mice; CD-HFD/Ticagrelor n = 6 mice; serum cholesterol: n = 8 mice/group; liver triglycerides: ND n = 8 mice; CD-HFD n = 11 mice; CD-HFD/Ticagrelor n = 8 mice; IPGTT: ND n = 5 mice; CD-HFD n = 3 mice; CD-HFD/Ticagrelor n = 3 mice). i,j, Real-time qPCR analysis of hepatic genes associated to catabolic (i) and anabolic processes (j) of lipid metabolism of 6 months ND, CD-HFD or CD-HFD/Ticagrelor fed mice (RT-qPCR for catabolic genes: ND n = 2 mice; CD-HFD n = 6 mice; CD-HFD/Ticagrelor n = 6 mice; RT-qPCR for anabolic genes: ND n = 2 mice; CD-HFD n = 3 mice; CD-HFD/Ticagrelor n = 3 mice). All data are shown as mean ± s.e.m. Data in a were analyzed by two-tailed Student’s t test. Data in b, d, e, f, g and j were analyzed by one way ANOVA with the post hoc Tukey’s multiple comparison test. Data in c and h were analyzed by two way ANOVA with the post hoc Tukey’s multiple comparison test. Data in i were analyzed by two-tailed Mann–Whitney test, N.s.: not significant *P < 0.05. **P < 0.01. ***P < 0.001. ****P < 0.0001.
Extended Data Fig. 4 |
Extended Data Fig. 4 |. Mice with non-functional platelet aggregation are not protected from NASH development.
a, CD42b staining and quantification of 6 months CD-HFD- or CD-HFD/Itg2b−/−-fed mice (CD-HFD n = 5 mice, CD-HFD/Itg2b−/−n = 4 mice). b, Body weight development of 6 months CD-HFD or CD-HFD/Itg2b/-fed mice (n = 5/group). Statistics: ND vs CD-HFD (black asterisks), ND vs CD-HFD/Itg2b−/− (blue asterisks). c, ALT (ND n = 4 mice, CD-HFD n = 3 mice, CD-HFD/Itg2b−/−n = 3 mice), AST (ND n = 5 mice, CD-HFD n = 3 mice, CD-HFD/Itg2b−/−n = 3 mice), (d) liver triglycerides (ND n = 7 mice, CD-HFD n = 8 mice, CD-HFD/Itg2b−/−n = 3 mice), and serum cholesterol levels (ND n = 7 mice, CD-HFD n= 3 mice, CD-HFD/Itg2b−/−n = 3 mice), (e) IPGTT from mice shown in a (n = 3–4 field/mouse, ND n = 4 mice, CD-HFD n= 4 mice, CD-HFD/Itg2b−/−n = 10 mice) Statistics: ND vs CD-HFD (black asterisks), ND vs CD-HFD/Itg2b−/− (blue asterisks). (f) Real-time qPCR analysis for genes involved in lipid metabolism/β-oxidation (ND n = 2 mice, CD-HFD n = 4 mice, CD-HFD/Itg2b−/−n = 3 mice). Statistics: CD-HFD vs CD-HFD/tg2b−/− (blue asterisks). (g) NAS evaluation (CD-HFD n = 9 mice, CD-HFD/tg2b−/−n = 7 mice) and (h) quantification of fat by Sudan red staining of mice shown in a (n = 5 mice/group), scale bar: 100 µm in 10×, 50 µm in 20×. All data are shown as mean ± s.e.m. Data shown in a and g were analyzed by two-tailed Student’s t test. Data in b,e were analyzed by two-way analysis of variance with the post hoc Bonferroni multiple comparison test. Data in c,d,h were analyzed by one-way analysis of variance with the post hoc Tukey’s multiple comparison test. Data in f were analyzed by two-tailed Mann-Whitney test; n.s., not significant, *P < 0.05, **P < 0.01, ***P < 0.001, ****P < 0.0001.
Extended Data Fig. 5 |
Extended Data Fig. 5 |. Gp6 mice display severe steatosis, NASH and NASH-associated conditions.
a, CD42b staining and quantification of 6 months CD-HFD or CD-HFD/Gp6/-fed mice (CD-HFD n = 5 mice, CD-HFD/Gp6-−/−n = 4 mice), scale bar: 50 µm. b, Body weight (n = 6 mice/group), (c) ALT, liver triglycerides and cholesterol levels of 6 months mice (ND n = 4 mice, CD-HFD n = 4 mice, CD-HFD/Gp6−/−n = 3 mice). Statistics: ND vs CD-HFD (black asterisks), ND vs CD-HFD/Gp6 (orange asterisks). d, IPGTT (ND n = 5 mice, CD-HFD n = 5 mice, CD-HFD/Gp6−/−n = 3 mice). Statistics: ND vs CD-HFD (black asterisks), ND vs CD-HFD/Gp6−/− (orange asterisks). e, Real-time qPCR analysis for genes involved in lipid metabolism/β-oxidation (ND n = 2 mice, CD-HFD n = 4 mice, CD-HFD/Gp6−/−n = 3 mice). f, NAS evaluation of mice shown in a, damaged hepatocytes are indicated by asterisks (CD-HFD n = 9 mice, CD-HFD/Gp6−/− n = 8 mice), scale bar: 100 µm in 10× and 50 µm in 20×. g, Quantification of fat by Sudan red staining in mice shown in b (n = 3–4 fields/mouse, ND n = 4 mice, CD-HFD n = 4 mice, CD-HFD/Gp6−/−n = 9 mice). All data are shown as mean ± s.e.m. Data in b,d were analyzed by two-way analysis of variance with the post hoc Bonferroni multiple comparison test. Data in c,g were analyzed by one-way analysis of variance with the post hoc Tukey’s multiple comparison test. Data in e were analyzed by two-tailed Mann Whitney’s test, data in f were analyzed by two-tailed Student’s t test. n.s., not significant, *P < 0.05, **P < 0.01, ***P < 0.001, ****P < 0.0001.
Extended Data Fig. 6 |
Extended Data Fig. 6 |. Genetic inactivation of Clec-2 or podoplanin does not protect from CD-HFD-induced NASH.
a,b, Body weight (a) and ALT levels (b) (ND n = 5 mice, CD-HFD n = 10, CD-HFD/Clec-2 n = 9 or CD-HFD/Pdpn−/−n= 3). (c) H&E staining and (d) NAS evaluation (ND n = 5 mice, CD-HFD n = 4, CD-HFD/Clec-2−/n= 4 or CD-HFD/Pdpn−/−n= 3), scale bar: 100 µm. All data are shown as mean ± s.e.m. and analyzed by one-way analysis of variance with the post hoc Tukey’s multiple comparison test.
Extended Data Fig. 7 |
Extended Data Fig. 7 |. MAdCAM-1 has an important role in the platelets recruitment to the liver during NASH development.
a, H&E, CD42b (ND n = 12 mice, WD-HTF n = 17 mice, WD-HTF/MAdCAM-1−/− n = 6 mice, WD-HTF/L-sel/– n = 11 mice, WD-HTF/Beta7−/− n = 8 mice, WD-HTF/L-sel−/−/Beta7−/− n = 11 mice), CD3 (ND n = 5 mice, WD-HTF n = 8 mice, WD-HTF/MAdCAM-1−/− n = 6 mice, WD-HTF/L-sel−/− n = 5 mice, WD-HTF/Beta7−/− n = 4 mice, WD-HTF/L-sel−/−Beta7−/− n = 4 mice) and F4/80 (ND n = 4 mice, WD-HTF n = 5 mice, WD-HTF/MAdCAM-1−/− n = 5 mice, WD-HTF/-sel−/− n = 4 mice, WD-HTF/Beta7−/− n = 6 mice, WD-HTF/L-sel−/−/Beta7−/− n = 4MAdCAM-1−/− mice) stains and (b) quantification of IHC of livers of mice mentioned in a, scale bar: 50 µm. All data are shown as mean ± s.e.m. Data in b were analyzed by one-way analysis of variance with the post hoc Tukey’s multiple comparison test.
Extended Data Fig. 8 |
Extended Data Fig. 8 |. Genetic inactivation of P-selectin does not prevent NASH development.
a,b, Body weight development (ND n = 4 mice, CD-HFD n = 3 mice, CD-HFD/P-sel/n = 7 mice) (a) and ALT and AST levels of 6 months ND, CD-HFD or CD-HFD/P-sel/ mice (ND n = 4 mice, CD-HFD n = 5 mice, CD-HFD/P-sel /n = 9 mice). Statistics: ND vs CD-HFD (black asterisks), ND vs CD-HFD/P-sel/ (violet asterisks). c, IPGTT (ND n = 4 mice, CD-HFD n = 5 mice, CD-HFD/n = 5 mice). Statistics: ND vs CD-HFD (black asterisks), CD-HFD vs CD-HFD/P-sel/ (violet asterisks). d, NAS evaluation (CD-HFD n = 8 mice, CD-HFD/P-sel/n = 4 mice). scale bar: 100 µm in 10×, 50 µm in 20×. e, Representative CD3, F4/80, MHCII and Ly6G stainings (CD-HFD n = 8 mice, CD-HFD/P-sel/n = 4 mice), scale bar: 50 µm. All data are shown as mean ± s.e.m. Data in a and c were analyzed by two-way analysis of variance with the post hoc Bonferroni multiple comparison test. Data in b were analyzed by one-way analysis of variance with the post hoc Tukey’s multiple comparison test. Data in d were analyzed by two-tailed Student’s t test. n.s., not significant *P < 0.05, **P < 0.01, ***P < 0.001, ****P < 0.0001.
Extended Data Fig. 9 |
Extended Data Fig. 9 |. vWF−/− mice show steatosis, liver damage and conditions associated with NASH.
a, Body weight development of 6 months ND-, CD-HFD- or CD-HFD/vWF-fed mice. Statistics: (n = 6 mice/group). Statistics: ND vs CD-HFD (black asterisks), ND vs CD-HFD/vWF−/− (red asterisks). b, ALT (ND n = 4 mice, CD-HFD n = 3 mice, CD-HFD/vWF/n = 3 mice), liver triglycerides (ND n = 5 mice, CD-HFD n = 4 mice, CD-HFD/vWF−/−n = 5 mice) and serum cholesterol levels (ND n = 4 mice, CD-HFD n = 4 mice, CD-HFD/vWF−/−n= 3 mice). c, IPGTT (ND n = 5 mice, CD-HFD n = 5 mice, CD-HFD/vWF−/− = 3 mice). Statistics: ND vs CD-HFD (black asterisks), ND vs CD-HFD/vWF−/− (red asterisks). d, Real-time qPCR analysis for genes involved in lipid metabolism/β-oxidation (ND n = 2 mice, CD-HFD n = 4 mice, CD-HFD/vWF−/−n= 4 mice). e, H&E with enlarged hepatocytes (asterisks) and (f) evaluation of NAS (CD-HFD n = 9 mice, CD-HFD/vWF−/−n= 4 mice) scale bar: 100 µm in 10X and 50 µm in 20×. g, Sudan red staining and quantification of mice shown in a (n = 2–3 fields/mouse: n = 3 mice/group), scale bar: 100 µm. All data are shown as mean ± s.e.m. Data in a,c were analyzed by two-way analysis of variance with the post hoc Bonferroni multiple comparison test. Data in b,g were analyzed by one-way analysis of variance with the post hoc Tukey’s multiple comparison test. Data in d were analyzed by two-tailed Mann-Whitney test. Data in f were analyzed by two-tailed Student’s t test. n.s., not significant, *P < 0.05, **P < 0.01, ***P < 0.001, ****P < 0.0001.
Extended Data Fig. 10 |
Extended Data Fig. 10 |. Mice lacking Mac-1 show signs of liver injury and develop NASH upon feeding CD-HFD.
a, CD42b staining and quantification of 6 months CD-HFD or CD-HFD/Mac-1−/−-fed mice (CD-HFD n = 5 mice, Mac-1/CD-HFD n = 4 mice), scale bar: 50 µm (b) Body weight (ND n = 5 mice, CD-HFD n = 8 mice, CD-HFD/Mac-1−/−n = 11 mice), (c) ALT, and AST of 6 months ND, CD-HFD or CD-HFD/Mac-1/-fed mice (CD-HFD n = 5 mice, CD-HFD/Mac-1−/−n = 12 mice) (d) NAS evaluation of mice shown in a (CD-HFD n = 9 mice, CD-HFD/-Mac-1−/−n = 11 mice) scale bar: 100 µm in 10× and 50 µm in 20×. e, Representative CD3+, F4/80+, MHCII+ and Ly6G+ staining (ND n = 5 mice, CD-HFD n = 8 mice, CD-HFD/Mac-1−/−n = 11 mice) and arrows indicate cell/cell aggregates, scale bar: 50 µm. All data are shown as mean ± s.e.m. Data in a,d were analyzed by two-tailed Student’s t test. Data in b,c were analyzed by one-way analysis of variance with the post hoc Tukey’s multiple comparison test.
Fig. 1 |
Fig. 1 |. Increased platelet numbers and aggregates in liver sinusoids of murine and human NASH.
a, CD42b staining and quantification of intrahepatic platelets (CD42b+) in 6-month ND-fed or CD-HFD-fed mice; arrows indicate platelets (n = 7 mice/group). Scale bar, 50 µm. b, 3D confocal images of platelet (green)/liver endothelium (gray) interaction of 6-month ND-fed or CD-HFD-fed mice (n = 4 mice/group). Scale bar, 20 μm. c,d, CD42b staining and quantification in 6-month (c) ND-fed and WD-HTF-fed (n = 6 mice/group) or (d) WD-NTF-fed mice; arrows indicate platelets, (ND n = 12 mice; WD-HTF n = 4 mice). Scale bars, 50 µm. e, CD42b staining and quantification of intrahepatic platelets (CD42b+) in 2-month ND-fed or MCD-fed mice; arrows indicate platelets (n = 5 mice/group). Scale bar, 50 µm. f, CD61 staining and quantification of platelets (CD61+) in human livers; arrows indicate platelets (non-diseased patients n = 4; patients with NASH n = 21). g, H&E staining, CD42b staining and quantification in 6-month ND-fed or HFD-45%-fed mice (ND n = 6 mice; HFD-45% n = 7 mice). Scale bar, 50 µm. h, H&E, CD42b staining and quantification in 6-month ND-fed or HFD-60%-fed (60% kcal and low sucrose (LS)) mice (ND n = 8 mice; HFD n = 6 mice). Scale bar, 50 µm. All data are shown as mean ± s.e.m. All data were analyzed using two-tailed Student’s t test.
Fig. 2 |
Fig. 2 |. Asp-Clo treatment results in attenuation of steatosis, liver damage, NASH and NASH-associated conditions.
a, Body weight development of 12-month ND-, CD-HFD- or CD-HFD/Asp-Clo-fed mice (ND n = 5 mice; CD-HFD n = 5 mice; CD-HFD/Asp-Clo n = 9). Statistic: ND vs CD-HFD (black asterisks), ND vs CD-HFD/Asp-Clo (green asterisks). b, ALT of 6- and 12-month ND-, CD-HFD or CD-HFD/Asp-Clo-fed mice (6 months: ND n = 14 mice; CD-HFD n = 11 mice; CD-HFD/Asp-Clo n = 4 mice; 12 months: ND n = 7 mice; CD-HFD n = 12 mice; CD-HFD/Asp-Clo n = 18 mice). c, Intraperitoneal glucose tolerance test (IPGTT) of 6-month ND-, CD-HFD- or CD-HFD/Asp-Clo-fed mice (n = 5 mice/group). Statistic: ND vs CD-HFD (black asterisks), ND vs CD-HFD/Asp-Clo (green asterisks). d,e, Liver triglyceride (6 months: ND n = 11 mice; CD-HFD n = 15 mice; CD-HFD/Asp-Clo n = 7 mice; 12 months: ND n = 4 mice; CD-HFD n = 9 mice; CD-HFD/Asp-Clo n = 15 mice) (d) and serum cholesterol (e) of 6- and 12-month ND-, CD-HFD- or CD-HFD/Asp-Clo-fed mice (6 months: ND n = 4 mice; CD-HFD n = 7 mice; CD-HFD/Asp-Clo n = 9 mice; 12 months: ND n = 6 mice; CD-HFD n = 17 mice; CD-HFD/Asp-Clo n = 11 mice). f, Real-time qPCR analysis for genes involved in lipid metabolism/β-oxidation of 6-month ND-, CD-HFD- or CD-HFD/Asp-Clo-fed mice (ND n = 4 mice; CD-HFD n = 5 mice; CD-HFD/Asp-Clo n = 7 mice). Statistic: CD-HFD vs CD-HFD/Asp-Clo (green asterisks). g, Analysis of VO2 and respiratory exchange ratio (RER) over time in 2-month ND-, CD-HFD- or CD-HFD/Asp-Clo-fed mice (ND n = 4 mice; CD-HFD n = 8 mice; CD-HFD/Asp-Clo n = 8 mice). h, Analysis of food (g/mouse/day) and water intake (ml/mouse/day) (ND n = 4 mice; CD-HFD n = 8 mice; CD-HFD/Asp-Clo n = 6 mice). i, MRI analyses in 6-month ND-, CD-HFD- or CD-HFD/Asp-Clo-fed mice (n = 3 mice/group). T1 (fast low-angle shot (FLASH)) OUT phase: dark color indicative of steatosis. T2 TurboRare: an increase in subcutaneous and abdominal fat and hepatic lipid accumulation (bright regions). j,k, H&E staining (j) and NAS evaluation (k) of 6-month ND-, CD-HFD- or CD-HFD/Asp-Clo-fed mice (ND n = 9 mice; CD-HFD n = 9 mice; CD-HFD/Asp-Clo n = 6 mice). Asterisks indicate damaged hepatocytes. Scale bars, 100 µm in 10×, 50 µm in 20×. All data are shown as mean ± s.e.m. Data in a and c were analyzed by two-way analysis of variance (ANOVA) with the post hoc Tukey’s multiple comparison test; *P < 0.05.,**P < 0.01, ***P < 0.001, ****P < 0.0001. Data in b, d, e, g, h and k were analyzed by one-way analysis of variance with the post hoc Tukey’s multiple comparison test. Data in f were analyzed by two-tailed Mann–Whitney test; *P < 0.05, **P < 0.01.
Fig. 3 |
Fig. 3 |. Antiplatelet treatment with Asp-Clo abrogates immune cell infiltration into the liver and prevents NASH-induced HCC development.
a, CD3, F4/80, MHCII and Ly6G staining and quantification of 6-month ND-, CD-HFD- or CD-HFD/Asp-Clo-fed mice (CD3: ND n = 5 mice; CD-HFD n = 11 mice; CD-HFD/Asp-Clo n = 5 mice; F4/80: ND n = 6 mice; CD-HFD n = 12 mice; CD-HFD/Asp-Clo n = 5 mice; MHCII: ND n = 9 mice; CD-HFD n = 12 mice; CD-HFD/Asp-Clo n = 5 mice), scale bar, 50 µm. b,c, Representative FACS plots and quantification of hepatic CD4/CD8 ratio and NKT cells (b) and activated CD8+ cells of 6-month ND-, CD-HFD- or CD-HFD/Asp-Clo-fed mice (c) (CD8+: ND n = 6 mice; CD-HFD n = 6 mice; CD-HFD/Asp-Clo n = 4 mice; CD3+NK1.1+: ND n = 4 mice; CD-HFD n = 4 mice; CD-HFD/Asp-Clo n = 3 mice; CD8+CD62L–CD44+CD69+: ND n = 6 mice; CD-HFD n = 6 mice; CD-HFD/Asp-Clo n = 4 mice). d, Western blot images of 6-month ND-, CD-HFD- or CD-HFD/Asp-Clo-fed mice (n = 2 mice/group). e, Representative macroscopical images of livers from 12-month ND-, CD-HFD- or CD-HFD/Asp-Clo-fed mice (ND n = 0 tumors in 27 mice; CD-HFD n = 13 tumors in 51 mice; CD-HFD/Asp-Clo n = 0 tumors in 20 mice). White arrowhead indicates HCC. Scale bar, 7.5 mm. f, HCC incidence of 12-month ND-, CD-HFD- or CD-HFD/Asp-Clo-fed mice. T, tumor; NT, non-tumor) (ND n = 0 tumors in 27 mice; CD-HFD n = 13 tumors in 52 mice; CD-HFD/Asp-Clo n = 0 tumors in 20 mice). g, HCC characterization by H&E and collagen IV (Col IV) staining of 12-month ND-, CD-HFD- or CD-HFD/Asp-Clo-fed mice; dashed line indicates tumor (T) border. Scale bar, 2 mm (top H&E) and 200 μm (middle H&E; bottom Col IV). All data are shown as mean ± s.e.m. Data in ac were analyzed by one-way ANOVA with the post hoc Tukey’s multiple comparison test. Data in f were analyzed using two-sided Fisher’s exact test.
Fig. 4 |
Fig. 4 |. Platelets efficiently populate the liver early during fatty liver pathogenesis.
a, Intravital microscopy of livers of 4, 5, 6 and 8 weeks ND- or CD-HFD-fed mice. Analysis of Kupffer cells (violet), platelets (blue) and granulocytes (red), (4 weeks: ND n = 2 mice; CD-HFD n = 2 mice; 5 weeks: ND n = 2 mice; CD-HFD n = 2 mice; 6 weeks: ND n = 4 mice; CD-HFD n = 4 mice; 8 weeks: ND n = 3 mice; CD-HFD n = 3 mice). Scale bars, 40 µm. b,c, CD3 staining and quantification of (b) 6-week (ND n = 4 mice; CD-HFD n = 8 mice) or (c) 8-week ND- or CD-HFD-fed mice (ND n = 5 mice; CD-HFD n = 4 mice). Scale bar, 50 µm. d, Quantification of platelet area by intravital microscopy of mice shown in a (ND: 4 weeks n = 2 mice and 40 FOV; 5 weeks n = 2 mice and 40 FOV; 6 weeks n = 4 mice and 40 FOV; 8 weeks n = 2 mice and 40 FOV; CD-HFD: 4 weeks n = 2 mice and 20 FOV; 5 weeks n = 2 mice and 20 FOV; 6 weeks n = 4 mice and 30 FOV; 8 weeks n = 2 mice and 19 FOV). e, Analysis of liver sinusoid diameter by intravital microscopy of mice shown in a (ND: 4 weeks n = 2 mice and 101 sinusoids; 5 weeks n = 2 mice and 150 sinusoids; 6 weeks n = 4 mice and 100 sinusoids; 8 weeks n = 2 mice and 150 sinusoids; CD-HFD: 4 weeks n = 2 mice and 100 sinusoids; 5 weeks n = 2 mice and 150 sinusoids; 6 weeks n = 4 mice and 100 sinusoids; 8 weeks n = 2 mice and 100 sinusoids). f, Hepatocyte swelling measurement by H&E of mice shown in b and c (6 weeks: ND n = 4 mice; CD-HFD n = 3 mice; 8 weeks: ND n = 3 mice; CD-HFD n = 4 mice). g, NAS evaluation of 6- or 8-week ND- or CD-HFD-fed mice (6 weeks: ND n = 19 mice; CD-HFD n = 18 mice; 8 weeks: ND n = 3 mice; CD-HFD n = 6 mice). h, Liver triglycerides of 6-week ND- or CD-HFD-fed mice (n = 3 mice/group). i, 3D confocal images and quantification of platelet (green)/Kupffer cells (red) interaction of 6-month ND- or CD-HFD-fed mice (n = 4 mice/group). Liver endothelium (gray). Scale bar, 20 μm. j, Left, representative images of intravital microscopy of 6-week ND- or CD-HFD-fed mice. Analysis of Kupffer cells (violet, violet arrowhead), hyaluronan binding protein (HABP) (red, red arrowhead) and LSECs (blue). Scale bar, 43 μm. Right, representative high-magnification images of intravital microscopy of mice shown in i, analysis of Kupffer cells (violet, violet arrowhead), HABP (red, red arrowhead) and LSECs (blue), (ND n = 4 mice; CD-HFD n = 4 mice). Scale bar, 43 μm. All data are shown as mean ± s.e.m. All data were analyzed using two-tailed Student’s t test.
Fig. 5 |
Fig. 5 |. Intrahepatic platelet accumulation depends on Kupffer cells, hyaluronan and cargo function.
a, Representative images of intravital microscopy after treatment (clodronate liposomes (CLL) or hyaluronidase (HYAL)) in 6-week ND-, CD-HFD-, CD-HFD + CLL- or CD-HFD + HYAL-fed mice. Analysis of Kupffer cells (violet), platelets (blue, blue arrowhead), and granulocytes (red), (n = 4 mice/group). Scale bar, 40 μm. b, H&E and F4/80 staining with quantification and NAS evaluation after treatment in 6-week ND-, CD-HFD-, CD-HFD + CLL- or CD-HFD + HYAL-fed mice (H&E: ND n = 10 mice; CD-HFD n = 14 mice; CD-HFD + CLL n = 9 mice; CD-HFD + HYAL n = 8 mice; F4/80: ND n = 7 mice; CD-HFD n = 10 mice; CD-HFD + CLL n = 4 mice; CD-HFD + HYAL n = 5 mice). Scale bar: 50 µm. c, Quantification of platelet area by intravital microscopy of mice shown in a (ND n = 4 mice and 40 FOV; CD-HFD n = 4 mice and 30 FOV; CD-HFD + CLL n = 4 mice and 40 FOV; CD-HFD + HYAL n = 4 mice and 30 FOV). d, ALT levels of mice shown in b (ND n = 17 mice; CD-HFD n = 13; CD-HFD + CLL n = 7 mice; CD-HFD + HYAL n = 8 mice). eg, H&E histology (e), ALT levels (f) and NAS evaluation (g) after anti-CD44 antibody treatment (anti-CD44 antibody blocking (KM81) or non-blocking (IM7) HA-binding site) in 6-week ND-, CD-HFD-, CD-HFD + IM7 (non-HA blocking)-or CD-HFD + KM81 (HA-blocking)-fed mice (ALT: ND n = 16 mice; CD-HFD n = 12 mice; CD-HFD + IM7 n = 4 mice; CD-HFD + KM81 n = 4 mice; H&E and NAS: ND n = 19 mice; CD-HFD n = 15 mice; CD-HFD + IM7 n = 4 mice; CD-HFD + KM81 n = 4 mice). Scale bars, 50 µm. h,i, Representative H&E and CD42b staining (h) and NAS evaluation and platelet quantification (i) after CLL treatment in 6-month CD-HFD -or CD-HFD + CLL-fed mice (H&E and NAS: CD42b: CD-HFD n = 5 mice; CD-HFD + CLL n = 3 mice; CD42b: CD-HFD n = 5 mice; CD-HFD + CLL n = 3). j, Body weight development of 6-month ND-fed, CD-HFD-fed or CD-HFD/Nbeal2−/− mice (ND n = 6 mice; CD-HFD n = 6 mice; CD-HFD/Nbeal2−/−n = 4 mice). Statistic: ND vs CD-HFD (black asterisks), CD-HFD vs CD-HFD/Nbeal2−/− (blue asterisks). km, ALT, AST levels (k) liver triglycerides (l) and serum cholesterol (m) of mice shown in i (ALT: ND n = 7 mice; CD-HFD n = 18 mice; CD-HFD/Nbeal2−/−n = 4 mice; AST: ND n = 4 mice; CD-HFD n = 8 mice; CD-HFD/Nbeal2−/−n = 3 mice; liver triglycerides: ND n = 5 mice; CD-HFD n = 7 mice; CD-HFD/Nbeal2−/−n = 4 mice; serum cholesterol: ND n = 4 mice; CD-HFD n = 11 mice; CD-HFD/Nbeal2−/−n = 3 mice;). n, Representative H&E of mice shown in i (CD-HFD n = 9 mice; CD-HFD/Nbeal2−/−n = 10 mice), damaged hepatocytes (asterisks) are indicated. Scale bar, 50 µm. o, Fat quantification by Sudan red staining of mice shown in i (ND n = 4 mice and 17 fields; CD-HFD n = 4 mice and 14 fields; CD-HFD/Nbeal2−/−n = 4 mice and 35 fields). Scale bar, 100 µm. All data are shown as mean ± s.e.m. Data in bd,f,g,km,o were analyzed by one-way ANOVA with the post hoc Tukey’s multiple comparison test. Data in i were analyzed using two-tailed Student’s t test. Data in j were analyzed using two-way analysis of variance with the post hoc Tukey’s multiple comparison test. *P < 0.05, **P < 0.01, ***P < 0.001, ****P < 0.0001.
Fig. 6 |
Fig. 6 |. Anti-GPIbα antibody treatment as well as genetic dysfunction of GPIbα reduces NASH, fibrosis and HCC development.
a, Representative 3D confocal images of GPIbα (green, green arrowheads) and Kupffer cells (red, red arrowheads) interaction of 6-month ND- or CD-HFD-fed mice (ND n = 4 mice; CD-HFD n = 4 mice). Liver endothelium (gray), scale bar, 30 μm. b, High-magnification 3D confocal images and quantification of GPIbα (green)/Kupffer cells (red) and GPIbα (green)/LSECs (gray) interaction in 6-month ND- or CD-HFD-fed mice (ND n = 4 mice and 2 FOV/mouse; CD-HFD n = 4 mice and 2 FOV/mouse) Scale bar, 3 μm. For visualization of intravascular events, the transparency of the sinusoidal rendering was set to 50%. c, Representative H&E and CD42b staining after 5 weeks of GPIbα blocking or control Fab in 6-month CD-HFD-fed mice; scale bar, 50 µm. Platelets are indicated by arrows. dh, Platelet quantification (d), NAS evaluation (e), ALT levels (f), liver triglycerides (g) and quantification of Sirius red–positive areas (h) of mice shown in c (CD42b staining and platelet quantification: CD-HFD + control Fab n = 8 mice; CD-HFD + GPIbα blocking Fab n = 8 mice; H&E, NAS and ALT: CD-HFD + control Fab n = 5 mice; CD-HFD + GPIbα blocking Fab n = 4 mice; liver triglycerides: CD-HFD + control Fab n = 4 mice; CD-HFD + GPIbα blocking Fab n = 4 mice; Fibrosis: CD-HFD + control Fab n = 5 mice; CD-HFD + GPIbα blocking Fab n = 4 mice). i,j, Serum cholesterol, liver triglycerides (i) and ALT levels (j) of 6-month ND, CD-HFD- or CD-HFD/hIL4rα/GPIbα-Tg mice (serum cholesterol: ND n = 4 mice; CD-HFD n = 5 mice; CD-HFD/hIL4rα/GPIbα-Tg n = 4 mice; liver triglycerides: ND n = 6 mice; CD-HFD n = 5 mice; CD-HFD/hIL4rα/GPIbα-Tg n = 4 mice; ALT: ND n = 4 mice; CD-HFD n = 3 mice; CD-HFD/hIL4rα/GPIbα-Tg n = 4 mice). k, Quantification by flow cytometry of intrahepatic immune cells (CD8 + T cells (left), activated CD8+ T cells (middle), NKT cells (right)) of mice shown in i (CD8+, activated CD8+ and NKT cells: ND n = 3 mice; CD-HFD n = 3 mice; CD-HFD/hIL4rα/GPIbα-Tg n = 4 mice). l, Representative H&E staining of mice shown in i, indications of damaged hepatocytes (asterisks) and satellitosis (arrows); scale bars, 100 µm in 10× and 25 µm in 40×. m–o, Sudan red staining (m) and quantification of Sudan red–positive areas (n), NAS evaluation (o) of 6-month ND, CD-HFD or CD-HFD/hIL4rα/GPIbα-Tg mice (H&E and NAS: ND n = 7 mice; CD-HFD n = 13 mice; CD-HFD/hIL4rα/GPIbα-Tg n = 8 mice; Sudan red staining and quantification: n = 5 mice/group). p,q, Fibrosis quantification (p) and Sirius red staining (q) of 12-month ND, CD-HFD or CD-HFD/hIL4rα/GPIbα-Tg mice (H&E and NAS: ND n = 7 mice; CD-HFD n = 13 mice; CD-HFD/hIL4rα/GPIbα-Tg n = 8 mice; Sudan red: n = 5 mice/group; fibrosis and Sirius red: ND n = 4 mice; CD-HFD n = 9 mice; CD-HFD/hIL4rα/GPIbα-Tg n = 10 mice). r, ALT levels of 12-month ND, CD-HFD or CD-HFD/hIL4rα/GPIbα-Tg mice (ND n = 12 mice; CD-HFD n = 16 mice; CD-HFD/hIL4rα/GPIbα-Tg n = 9 mice). s, Macroscopical images of tumors of mice shown in r; tumor nodules are indicated by arrowhead) (CD-HFD: n = 13 tumors in 52 mice; CD-HFD/hIL4rα/GPIbα-Tg: n = 0 tumors in 24 mice); scale bar, 750 μm. t, HCC characterization by CD44v6, Collagen IV (Coll IV) and Ki67 staining form mice shown in r. Arrowheads indicate positive hepatocytes, dashed line indicates tumor (T) border; scale bar, 200 µm (CD44v6 and Coll IV), 50 µm (Ki67). u, HCC incidence (T = HCC; NT = non-tumor) from 12-month CD-HFD-fed or CD-HFD/hIL4rα/GPIbα-Tg mice, CD-HFD: n = 13 tumors in 52 mice; CD-HFD/hIL4rα/GPIbα-Tg: n = 0 tumors in 24 mice). All data are shown as mean ± s.e.m. Data in b,dh were analyzed by two-tailed Student’s t test. Data in ik,np,r were analyzed by one-way ANOVA with the post hoc Tukey’s multiple comparison test. Data in u were analyzed by two-sided Fisher’s exact test.

Comment in

References

    1. Fleet SE, Lefhowitch JH & Lavine JE Current concepts in pediatric nonalcoholic fatty liver disease. Gastroenterol. Clin. North Am 46, 217–231 (2017). - PubMed
    1. European Association for the Study of the Liver, European Association for the Study of Diabetes & European Association for the Study of Obesity. EASL-EASD-EASO Clinical Practice Guidelines for the management of non-alcoholic fatty liver disease. J. Hepatol 64, 1388–1402 (2016). - PubMed
    1. Younossi Z et al. Global perspectives on non-alcoholic fatty liver disease and non-alcoholic steatohepatitis. Hepatology 10.1002/hep.30251 (2018). - DOI
    1. Brunt EM et al. Nonalcoholic fatty liver disease. Nat. Rev. Dis. Primers 1, 15080 (2015). - PubMed
    1. Friedman SL, Neuschwander-Tetri BA, Rinella M & Sanyal AJ Mechanisms of NAFLD development and therapeutic strategies. Nat. Med 24, 908–922 (2018). - PMC - PubMed

Publication types

MeSH terms