. 2019 May;22(5):787-796.
doi: 10.1038/s41593-019-0364-9. Epub 2019 Apr 1.

Expectation-induced modulation of metastable activity underlies faster coding of sensory stimuli

Affiliations

Expectation-induced modulation of metastable activity underlies faster coding of sensory stimuli

L Mazzucato et al. Nat Neurosci. 2019 May.

Abstract

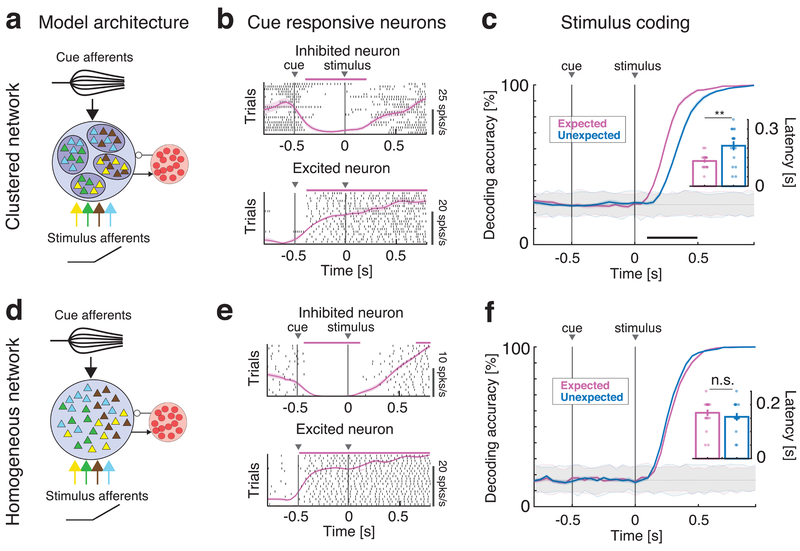
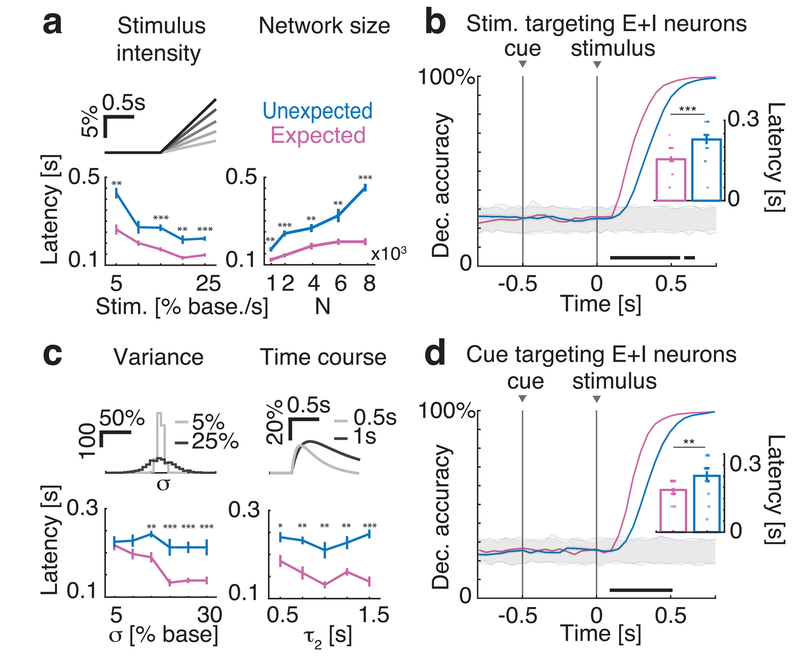
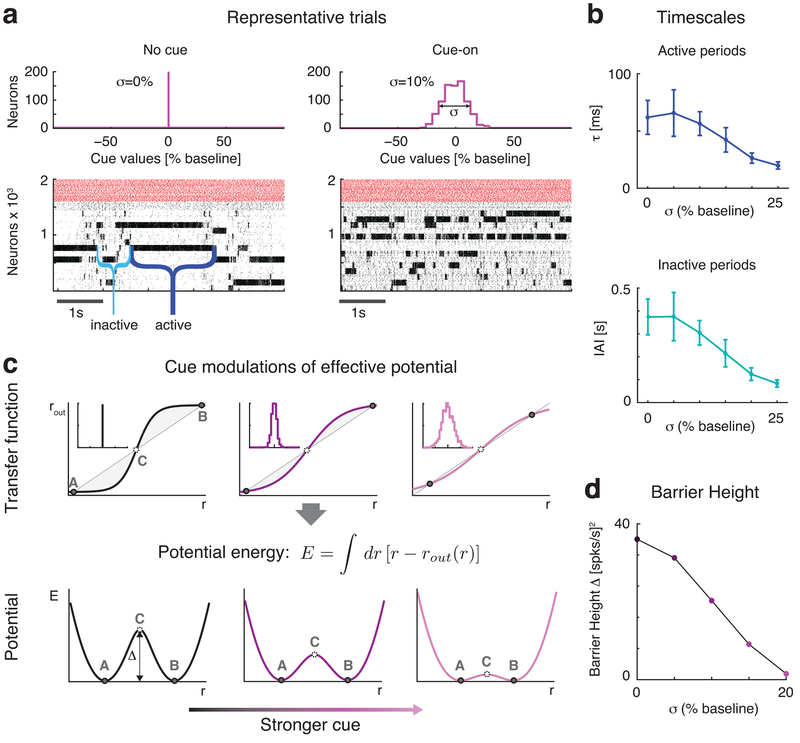
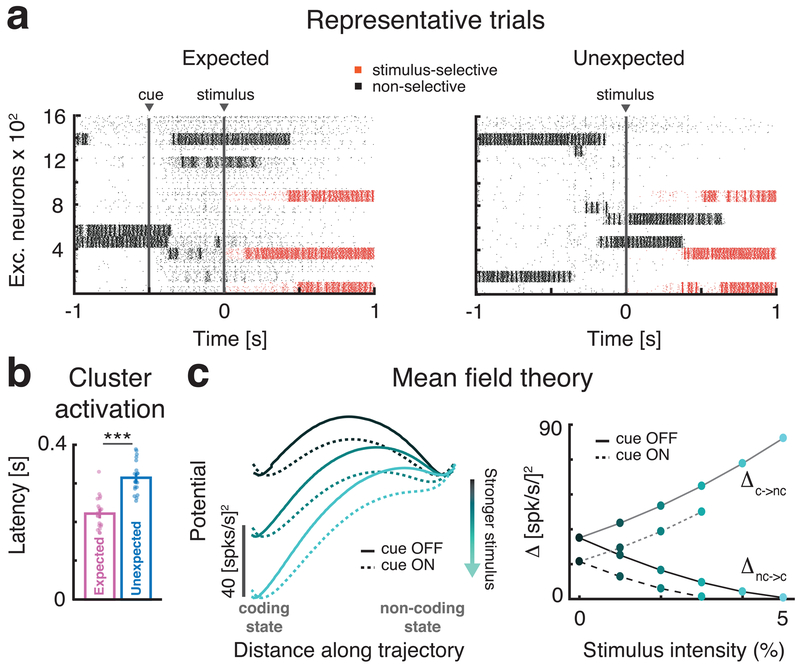
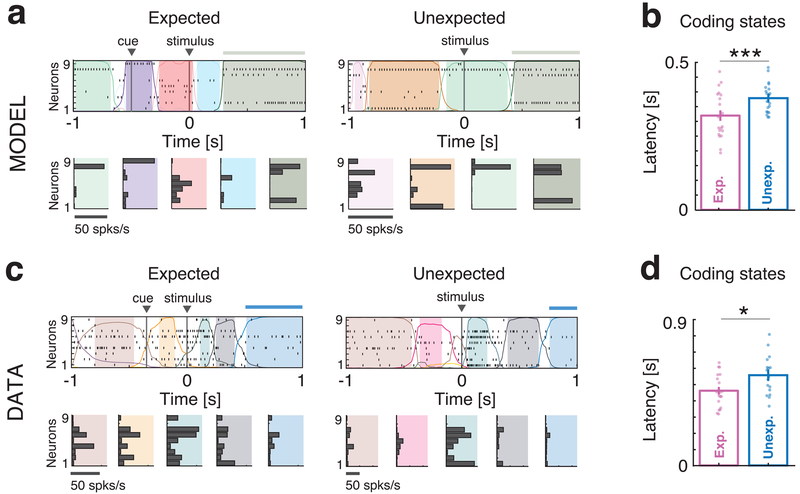
Sensory stimuli can be recognized more rapidly when they are expected. This phenomenon depends on expectation affecting the cortical processing of sensory information. However, the mechanisms responsible for the effects of expectation on sensory circuits remain elusive. In the present study, we report a novel computational mechanism underlying the expectation-dependent acceleration of coding observed in the gustatory cortex of alert rats. We use a recurrent spiking network model with a clustered architecture capturing essential features of cortical activity, such as its intrinsically generated metastable dynamics. Relying on network theory and computer simulations, we propose that expectation exerts its function by modulating the intrinsically generated dynamics preceding taste delivery. Our model's predictions were confirmed in the experimental data, demonstrating how the modulation of ongoing activity can shape sensory coding. Altogether, these results provide a biologically plausible theory of expectation and ascribe an alternative functional role to intrinsically generated, metastable activity.


Conflict of interest statement

Competing Financial Interests

The authors declare no competing financial interests.

Figures

Fig. 1:
Fig. 1:. Anticipatory activity requires a clustered network architecture.
Effects of anticipatory cue on stimulus coding in the clustered (a-c) and homogeneous (d-f) network. a: Schematics of the clustered network architecture and stimulation paradigm. A recurrent network of inhibitory (red circles) and excitatory neurons (triangles) arranged in clusters (ellipsoids) with stronger intra-cluster recurrent connectivity. The network receives bottom-up sensory stimuli targeting random, overlapping subsets of clusters (selectivity to 4 stimuli is color-coded), and one top-down anticipatory cue inducing a spatial variance in the cue afferent currents to excitatory neurons. b: Representative single neuron responses to cue and one stimulus in expected trials in the clustered network of a). Black tick marks represent spike times (rasters), with PSTH (mean±s.e.m.) overlaid in pink. Activity marked by horizontal bars was significantly different from baseline (pre-cue activity) and could either be excited (top panel) or inhibited (bottom) by the cue. c: Time course of cross-validated stimulus-decoding accuracy in the clustered network. Decoding accuracy increases faster during expected (pink) than unexpected (blue) trials in clustered networks (curves and color-shaded areas represent mean±s.e.m. across four tastes in n=20 simulated networks; color-dotted lines around gray shaded areas represent 95% C.I. from shuffled datasets). A separate classifier was used for each time bin, and decoding accuracy was assessed via a cross-validation procedure, yielding a confusion matrix whose diagonal represents the accuracy of classification for each of four tastes in that time bin (see text and Fig. S3 for details). Inset: aggregate analysis across n=20 simulated networks of the onset times of significant decoding (mean±s.e.m.) in expected (pink) vs. unexpected trials (blue) shows significantly faster onsets in the expected condition (two-sided t-test, p=0.0017). d: Schematics of the homogenous network architecture. Sensory stimuli modeled as in a). e: Representative single neuron responses to cue and one stimulus in expected trials in the homogeneous network of d), same conventions as in b). f: Cross-validated decoding accuracy in the homogeneous network (same analysis as in c). The latency of significant decoding in expected vs. unexpected trials is not significantly different. Inset: aggregate analysis of onset times of significant decoding (same as inset of c; two-sided t-test, p=0.31). Panels b, c, e, f: pink and black horizontal bars, p < 0.05, two-sided t-test with multiple-bin Bonferroni correction. Panel c: ** = p < 0.01, two-sided t-test. Panel f: n.s.: non-significant.
Fig. 2:
Fig. 2:. Robustness of anticipatory activity to variations in stimulus (top row) and cue (bottom row) models.
a: Latency of significant decoding increased with stimulus intensity (left panel: top, stimulus peak expressed as percent of baseline, darker shades represent stronger stimuli; bottom, decoding latency, mean±s.e.m. across n=20 simulated networks for each value on the x-axis, see main text for panels a-c statistical tests) in both conditions, and it is faster in expected (pink) than unexpected trials (blue). Anticipatory activity was present for a large range of network sizes (right panel: J+ =5, 10, 20, 30, 40 for N=1, 2, 4, 6, 8 x10³ neurons, respectively). Network synaptic weights scaled as reported in Table 1 and 2 of Methods. b: Anticipatory activity was present when stimuli targeted both excitatory (E) and inhibitory (I) neurons (notations as in Fig. 1c; 50% of both E and I neurons were targeted by the cue; inset: mean±s.e.m. across n=20 simulated networks, two-sided t-test, p=0.0011). c: Increasing the cue-induced spatial variance in the afferent currents σ2 (top left: histogram of afferents’ peak values across neurons; x-axis, expressed as percent of baseline; y-axis, calibration bar: 100 neurons) leads to more pronounced anticipatory activity (bottom left, latency in unexpected (blue) and expected (pink) trials). Anticipatory activity was present for a large range of cue time courses (top right, double exponential cue profile with rise and decay times [τ1, τ2] = g × [0.1, 0.5]s, for g in the range from 1 to 3; bottom right, decoding latency during unexpected, blue, and unexpected, pink, trials). d: Anticipatory activity was also present when the cue targeted 50% of both E and I neurons (σ = 20% in baseline units; inset: mean±s.e.m. across n=20 simulated networks, two-sided t-test, p=0.0034). Panels a-d: *=p<0.05, **=p<0.01, ***=p<0.001, post-hoc multiple-comparison two-sided t-test with Bonferroni correction. Horizontal black bar, p<0.05, two-sided t-test with multiple-bin Bonferroni correction; Insets: **=p<0.01, ***=p<0.001, two-sided t-test. Panel c-d: notations as in Fig. 1c of the main text.
Fig. 3:
Fig. 3:. Anticipatory cue speeds up network dynamics.
a: Raster plots of the clustered network activity in the absence (left) and in the presence of the anticipatory cue (right), with no stimulus presentation in either case. The dynamics of cluster activation and deactivation accelerated proportionally to the increase in afferent currents’ variance σ2 induced by the cue. Top panels: distribution of cue peak values across excitatory neurons: left, no cue; right, distribution with S.D. σ = 10% in units of baseline current. Bottom panels: raster plots of representative trials in each condition (black: excitatory neurons, arranged according to cluster membership; red: inhibitory neurons). b: The average cluster activation lifetime (top) and inter-activation interval (bottom) significantly decrease when increasing σ (mean±s.e.m. across n=20 simulated networks). c: Schematics of the effect of the anticipatory cue on network dynamics. Top row: the increase in the spatial variance of cue afferent currents (insets: left: no cue; stronger cues towards the right) flattens the “effective f-I curve” (sigmoidal curve) around the diagonal representing the identity line (straight line). The case for a simplified two-cluster network is depicted (see text). States A and B correspond to stable configurations with only one cluster active; state C corresponds to an unstable configuration with 2 clusters active. Bottom row: shape of the effective potential energy corresponding to the f-I curves shown in the top row. The effective potential energy is defined as the area between the identity line and the effective f-I curve (shaded areas in top row; see formula). The f-I curve flattening due to the anticipatory cue shrinks the height Δ of the effective energy barrier, making cluster transitions more likely and hence more frequent. d: Effect of the anticipatory cue (in units of the baseline current) on the height of the effective energy barrier Δ, calculated via mean field theory in a reduced two-cluster network of LIF neurons (see Methods).
Fig. 4:
Fig. 4:. Anticipatory cue induces faster onset of stimulus-coding states.
a: Raster plots of representative trials in the expected (left) and unexpected (right) conditions in response to the same stimulus at t=0. Stimulus-selective clusters (red tick marks, spikes) activate earlier than non-selective clusters (black tick marks, spikes) in response to the stimulus when the cue precedes the stimulus. b: Comparison of activation latency of selective clusters after stimulus presentation during expected (pink) and unexpected (blue) trials (mean±s.e.m. across 20 simulated networks, two-sided t-test, p=5.1x10⁻⁷). Latency in expected trials is significantly reduced. c: The effective energy landscape and the modulation induced by stimulus and anticipatory cue on two-clustered networks, computed via mean field theory (see Methods). Left panel: after stimulus presentation the stimulus-coding state (left well in left panel) is more likely to occur than the non-coding state (right well). Right panel: barrier heights as a function of stimulus strength in expected (`cue ON’) and unexpected trials (`cue OFF’). Stronger stimuli (lighter shades of cyan) decrease the barrier height Δ separating the non-coding and the coding state. In expected trials (dashed lines), the barrier Δ is smaller than in unexpected ones (full lines), leading to a faster transition probability from non-coding to coding states compared to unexpected trials (for stimulus ≥ 4% the barrier vanishes leaving just the coding state). Panel b: *** = p < 0.001, two-sided t-test.
Fig. 5:
Fig. 5:. Anticipation of coding states: model vs. data.
a: Representative trials from one ensemble of 9 simultaneously recorded neurons from clustered network simulations during expected (left) and unexpected (right) conditions. Top panels: spike rasters with latent states extracted via a HMM analysis (colored curves represent time course of state probabilities; colored areas indicate intervals where the probability of a state exceeds 80%; thick horizontal bars atop the rasters mark the presence of a stimulus-coding state). Bottom panels: Firing rate vectors for each latent state shown in the corresponding top panel. b: Latency of stimulus-coding states in expected (pink) vs. unexpected (blue) trials (mean±s.e.m. across n=20 simulated networks, two-sided t-test, p=0.014). Faster coding latency during expected trials is observed compared to unexpected trials. c-d: Same as a)-b) for the empirical datasets (mean±s.e.m. across n=17 recorded sessions, two-sided t-test, p=0.026). * = p < 0.05, ***= p < 0.001, two-sided t-test.

References

    1. Gilbert CD & Sigman M Brain states: top-down influences in sensory processing. Neuron 54, 677–696 (2007). - PubMed
    1. Jaramillo S & Zador AM The auditory cortex mediates the perceptual effects of acoustic temporal expectation. Nature neuroscience 14, 246–251, doi:10.1038/nn.2688 (2011). - DOI - PMC - PubMed
    1. Engel AK, Fries P & Singer W Dynamic predictions: oscillations and synchrony in top–down processing. Nature Reviews Neuroscience 2, 704–716 (2001). - PubMed
    1. Doherty JR, Rao A, Mesulam MM & Nobre AC Synergistic effect of combined temporal and spatial expectations on visual attention. Journal of Neuroscience 25, 8259–8266 (2005). - PMC - PubMed
    1. Niwa M, Johnson JS, O’Connor KN & Sutter ML Active engagement improves primary auditory cortical neurons’ ability to discriminate temporal modulation. Journal of Neuroscience 32, 9323–9334 (2012). - PMC - PubMed

Publication types