. 2019 Apr;37(4):461-468.
doi: 10.1038/s41587-019-0088-0. Epub 2019 Apr 1.

Inferring population dynamics from single-cell RNA-sequencing time series data

Affiliations

Inferring population dynamics from single-cell RNA-sequencing time series data

David S Fischer et al. Nat Biotechnol. 2019 Apr.

Abstract

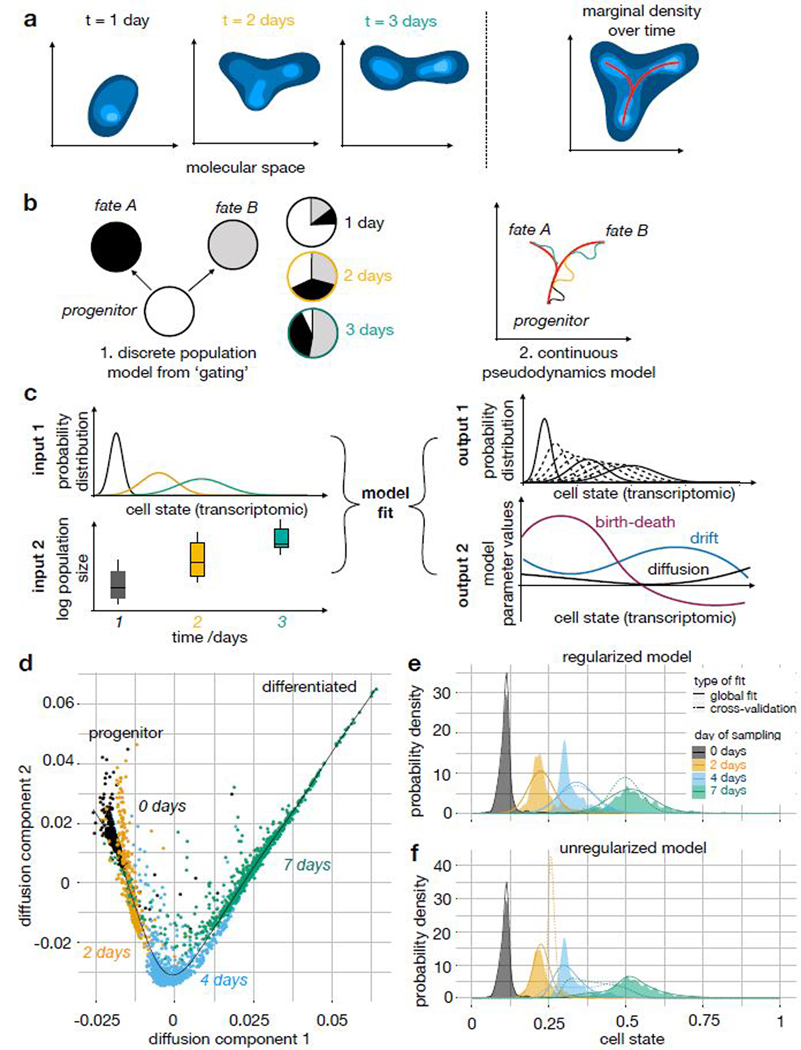
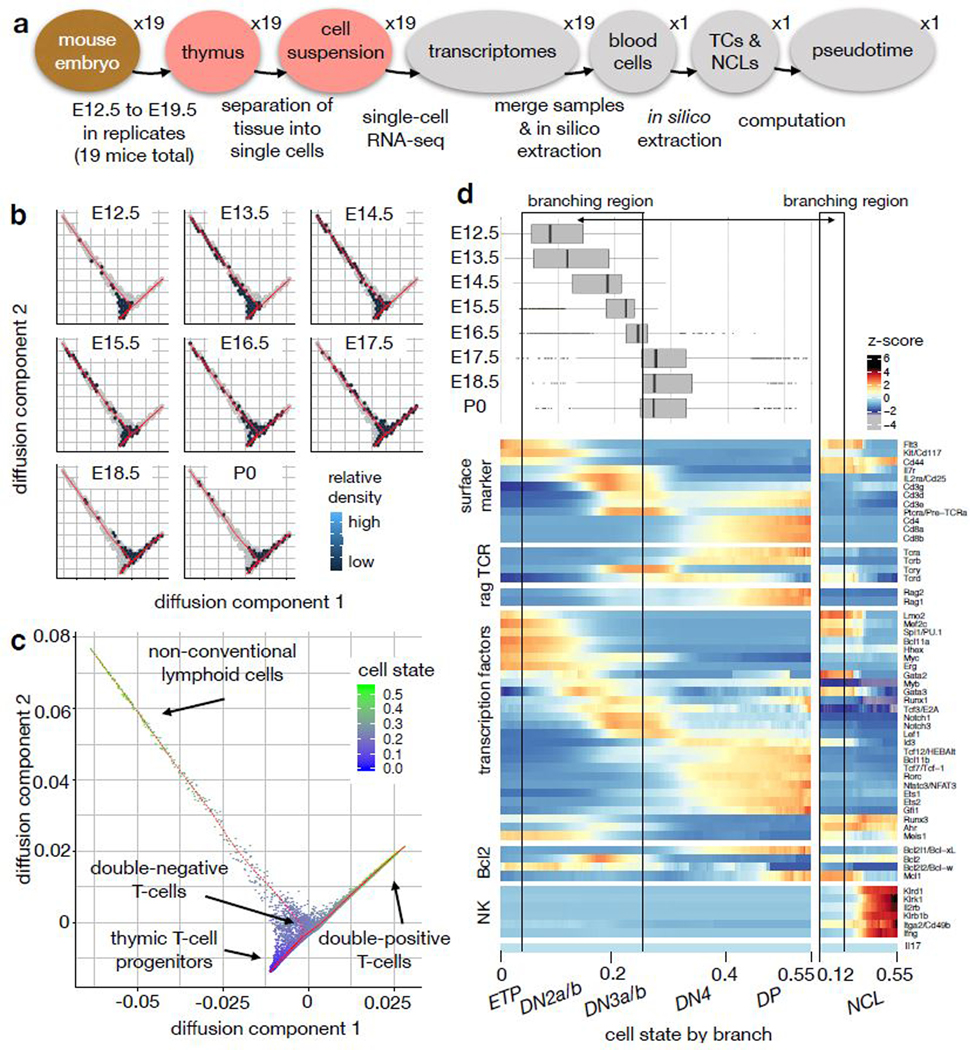
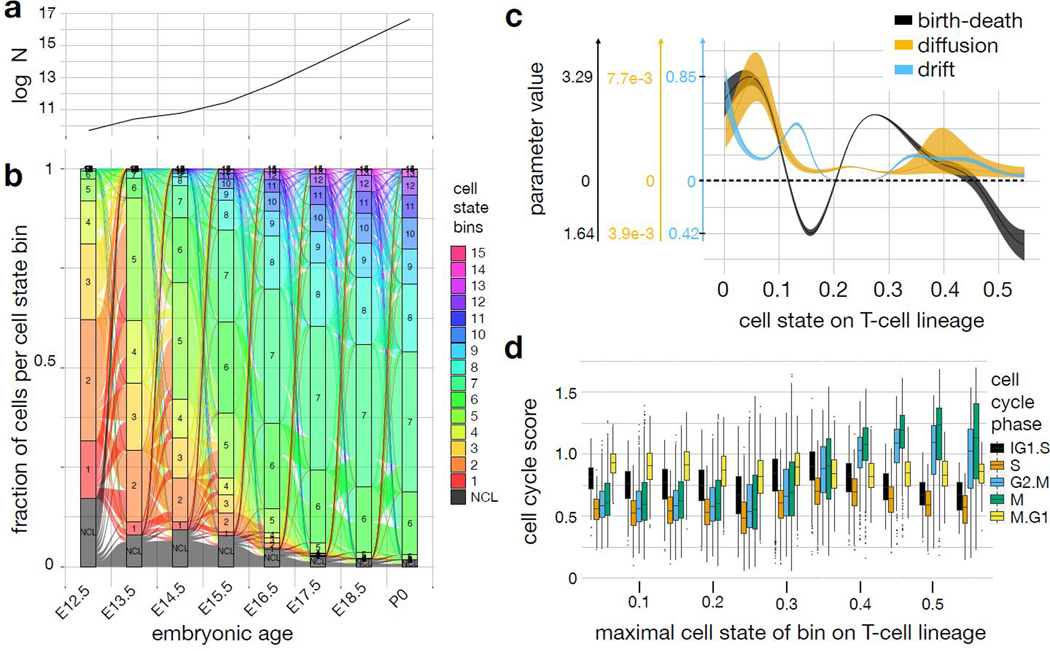
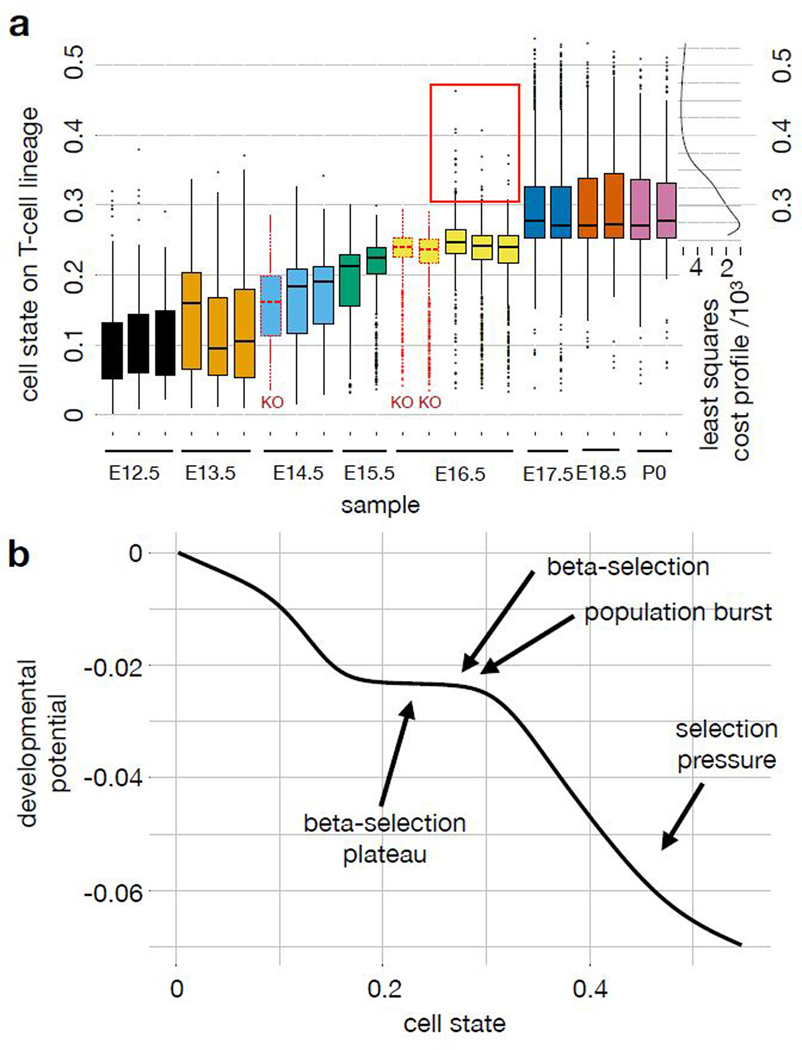
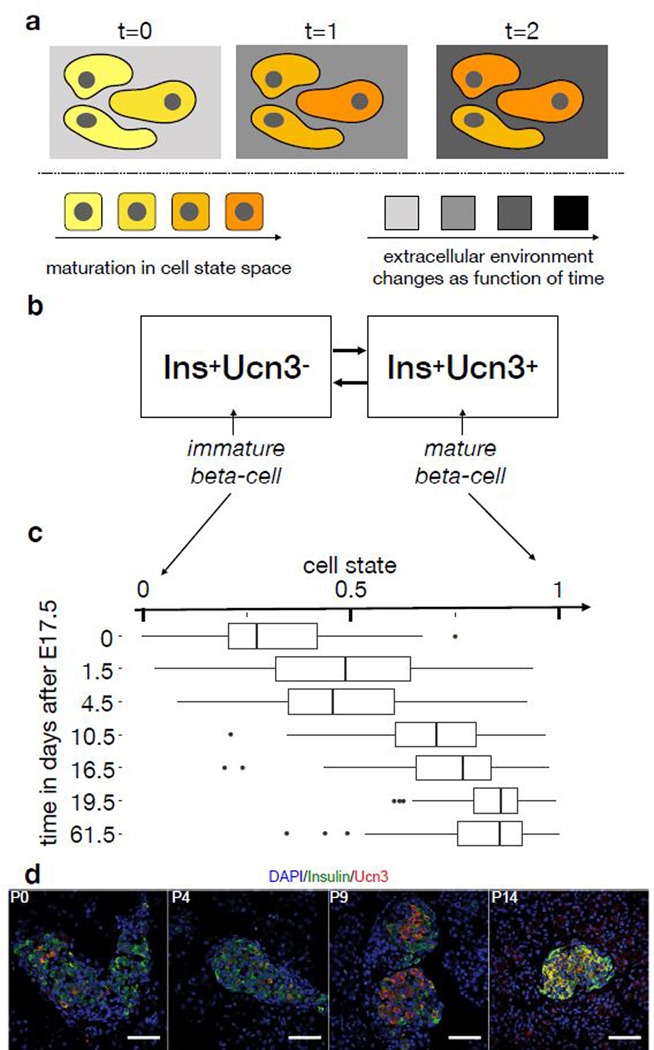
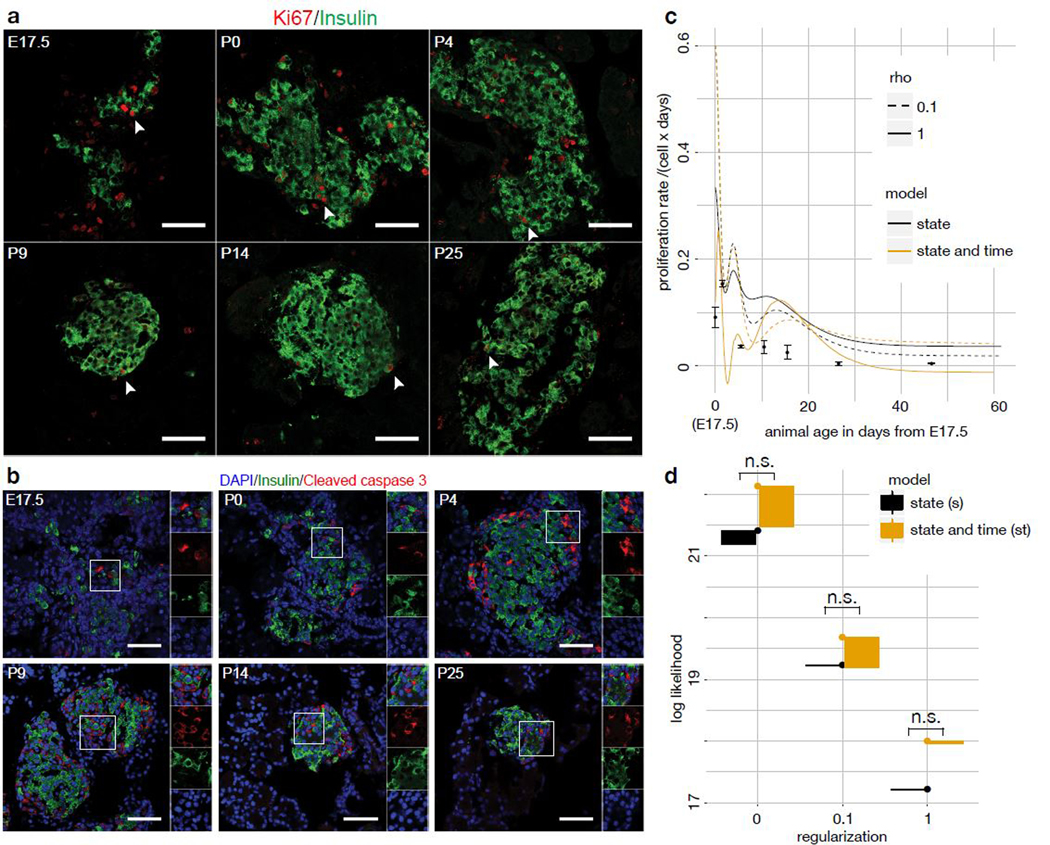
Recent single-cell RNA-sequencing studies have suggested that cells follow continuous transcriptomic trajectories in an asynchronous fashion during development. However, observations of cell flux along trajectories are confounded with population size effects in snapshot experiments and are therefore hard to interpret. In particular, changes in proliferation and death rates can be mistaken for cell flux. Here we present pseudodynamics, a mathematical framework that reconciles population dynamics with the concepts underlying developmental trajectories inferred from time-series single-cell data. Pseudodynamics models population distribution shifts across trajectories to quantify selection pressure, population expansion, and developmental potentials. Applying this model to time-resolved single-cell RNA-sequencing of T-cell and pancreatic beta cell maturation, we characterize proliferation and apoptosis rates and identify key developmental checkpoints, data inaccessible to existing approaches.


Conflict of interest statement

CONFLICT OF INTEREST

The authors declare no competing interests.

Figures

Figure 1
Figure 1
A population-based view of single-cell RNA-seq time-series experiments: Concept of pseudodynamics and example fits on a mouse embryonic stem cell differentiation data set. (a) Development can be modeled as the temporal progression of a population density in transcriptome (cell state) space. Here, the developmental process is a branched lineage from a progenitor to two terminal fates. (b) Dimension reductions of the full cell state space are useful for dynamic modelling. Discrete cell types, such as from FACS gates, were previously used for ordinary differential equation models. Branched trajectories with pseudotime coordinates can be used in the context of pseudodynamics. (c) Conceptual overview of the pseudodynamics algorithm: The input consists of developmental progress data (normalized distributions across cell state) and population size data (number of cells) for each time point. The output contains interpretable parameter estimates and imputed samples at unseen time points (dotted densities). (d) Diffusion map of mouse embryonic stem cell development in vitro after leukemia inhibitory factor (LIF) removal. Color: days after LIF removal in cell culture. (e,f) Kernel density estimate and simulated density of cells across cell state coordinate (diffusion pseudotime) at four sampled time points (n0=933, n2=303, n4=683, n7=798 cells) for regularized (rho = 1) and unregularized (rho = 0) model fits. Colored density: kernel density estimate, solid line: simulated density based on model fitted to all data, dotted line: simulated density in leave-one-time-point-out cross-validation.
Figure 2
Figure 2
A trajectory model for T-cell maturation yields a description with higher resolution than a discretized description of the cell state space. (a) Design of the single-cell RNA-seq experiment. TCs: T-cells, NCLs: non-conventional lymphoid cells. (b) 2D density estimate in hexagonal bins of population by time point in the diffusion map. The density is encoded by the hexagon color (dark: low density, bright: high density, white: no cells observed, grey: non-zero density in the union of all samples). The diffusion map was computed based on TCs and NCLs from all time points. (c) Diffusion map based on TCs and NCLs only with cell state (diffusion pseudotime) superimposed. (d) Summary of the trajectory model for T-cell maturation. The boxplots show the sampled density of cells across cell state by time point. The boxplots are based on nE12.5=366 cells, nE13.5=1611 cells, nE14.5= 981, nE15.5= 974, nE16.5= 2492, nE17.5= 1908, nE18.5= 857, nP0= 890. The center of each boxplots is the sample median, the whiskers extend from the upper (lower) hinge to the largest (smallest) data point no further than 1.5 times the interquantile range from the upper (lower) hinge. The heatmap shows z-scores of sliding window expression estimates across cell state in the T-cell lineage (n=10079 cells) and the NCL lineage (n=793 cells). ETP: early thymic progenitors, DN2a/b, DN3a/b, DN4: double-negative stages, DP: double-positive stage.
Figure 3
Figure 3
Pseudodynamics density and parameter fits extend the stationary description of T-cell maturation. (a) Simulated population size by time point. log N: log number of total cells. (b) Alluvial plot showing the flows between intervals of cell state bins across time. Each bar plot corresponds to one time point. The height of the boxes of each bin within a bar is proportional to the fraction of cells of all cells in that bin. The T-cell trajectory was divided into 15 equidistant bins in cell state (labelled 1–15), the non-conventional lymphoid cell branch was summarized to one bin (labelled NCL). The resulting 16 bins and their outflows are color coded. Outflow width represents the fraction of surviving cells transitioning into each bin at the old time point. Inflow width represents the contribution of each flow to the population size in a bin at the new time point. The alluvial plot is explained in Supp. Note 3 sec. SN3.2.2.7 and also provided as Supp. video 3. (c) Parameter estimates of pseudodynamics as function of cell state on the αβ-T-cell lineage with confidence intervals for regularization parameter rho=10. Shaded area: spline fit to 99% confidence interval boundary on spline nodes. (d) Transcriptome-based cell cycle state scores (online methods) per cell by cell state bin. The cell state was binned into intervals of length 0.05. The boxplots are based on nx cells observed per bin x (sorted ascending in cell state): n1=500, n2=930, n3=623, n4=1078, n5=3624, n6=2580, n7=646, n8=368, n9=276, n10=186, n11=61. The center of each boxplots is the sample median, the whiskers extend from the upper (lower) hinge to the largest (smallest) data point no further than 1.5 times the interquantile range from the upper (lower) hinge.
Figure 4
Figure 4
Pseudodynamics annotates a trajectory model with the position of a developmental checkpoint based on knock-out data, with the developmental potential and with developmental phases. (a) Boxplots of population density in cell state on T-cell lineage by sample with least squares cost profile of proposed beta-selection point as function of cell state based on the following number of cells per sample: n={215, 145, 55} at t=12.5; n={664, 603, 462} at t=13.5; n={436} at t=14.5 in the Rag2KO sample; n={487, 531} at t=14.5 in the wild-type samples; n={420, 560} at t=15.5; n={694, 896} at t=16.5 in the Rag1KO samples; n={784, 828, 865} at t=16.5 in the wild-type samples; n={929, 936} at t=17.5; n={429, 405} at t=18.5; n={378, 427} at t=19.5. Here, cell state coordinates are computed based on all replicates. Replicates are independent Drop-seq samples which are based on separate thymus samples, the two replicates at P0 are based on the two lobes of a single thymus. The red box denotes high cell state outliers at E16.5 only observed in wild-type. The cost profile shows the fit of the mutant data to the pseudodynamics parameterization which reflects the position of beta-selection in cell state space as a free parameter (online methods eq. 20). Color: time point, black solid outline: wild-type mice, red dotted outline: Rag1/2KO mice. The center of each boxplots is the sample median, the whiskers extend from the upper (lower) hinge to the largest (smallest) data point no further than 1.5 times the interquantile range from the upper (lower) hinge. (b) Approximation of developmental potential of the proposed model of T-cell maturation with other pseudodynamics output annotated. The developmental potential is the integral of the drift parameter on the T-cell lineage across cell state (online methods eq. 22).
Figure 5
Figure 5
Cell state space discretization and time-dependence of models of pancreatic β-cell maturation and proliferation. (a) Concept of state- and time-dependent effects in vivo. Cell state-dependent effects (cell color) directly depend only on the molecular state of the cell. Time-dependent effects (background color) are invariant with respect to the cell state. Time-dependent effects depend directly only on extracellular regulators if the cell state variable captures the full molecular state of a cell. (b) Surface marker-based compartment model for β-cell maturation. Here, the presence of Ucn3 is used as a marker for maturation within the set of Ins+ cells. (c) Continuous trajectory model of β-celll maturation in cell state space. Here, pseudotime quantifies maturation as cell state in a continuous interpolation of the two states shown in (b). The boxplots show the distribution of single-cell RNA-seq samples across cell state space by sampled time point with nx cells per time point x: n0=61, n1.5=84, n4.5=88, n10.5=81, n16.5=59, n19.5=71, n61.5=131. The center of each boxplots is the sample median, the whiskers extend from the upper (lower) hinge to the largest (smallest) data point no further than 1.5 times the interquantile range from the upper (lower) hinge. (d) Maturation quantification of β-cells in pancreas sections via co-staining of DAPI, insulin (β-cells) and Ucn3 (β-cell maturation) at multiple time points (P0, P4, P9, P14). The fractions of cells in the two compartments shown in (b) can be directly counted in these sections. We quantified the proliferation of 1000–3300 β-cells in 3 animals per animal per time point. White scale bar: 50 μm.
Figure 6
Figure 6
Likelihood-based model selection favors a state-dependent birth-death model over a state- and time-dependent model for β-cell maturation. (a,b) Proliferation (Ki67, a) and apoptosis (cleaved caspase-3, b) quantification of β-cells in pancreas sections via co-staining with DAPI and insulin (β-cells) at multiple time points (E17.5, P0, P4, P9, P14, P25). The fraction of proliferating and apoptotic β-cells can be directly counted, similarly to Fig. 5d. We observed the apoptosis and maturation status of 1900–3600 β-cells in 3 animals per time point. White scale bar: 50 μm. (c) Average birth-death rate per time point by model and observed proliferation rates by time point with one standard deviation around the mean as error bars. The birth-death rates at a given time point are computed as the convolution of the simulated population density at that time point with the parameter fit, both functions of cell state (Supp. Note 3 sec. SN3.2.3.3). The parameter fit is multiplied by the value of the time dependent birth-death function at that time point in the case of the time-dependent model. Two regularization hyper-parameters (rho) are shown for each model. (d) Likelihood of ten best fits by birth-death rate model for different regularization hyper-parameters. The interval shown is the interval between the best and the worst fit. Model selection was performed via a likelihood ratio test between of the best fit of each model (n.s.: not significant at threshold of 0.05).

References

Main references

    1. Klein AM et al. Droplet barcoding for single-cell transcriptomics applied to embryonic stem cells. Cell 161, 1187–1201 (2015). - PMC - PubMed
    1. Taniguchi K, Kajiyama T & Kambara H. Quantitative analysis of gene expression in a single cell by qPCR. Nat. Methods 6, 503–506 (2009). - PubMed
    1. Bandura DR et al. Mass cytometry: technique for real time single cell multitarget immunoassay based on inductively coupled plasma time-of-flight mass spectrometry. Anal. Chem. 81, 6813–6822 (2009). - PubMed
    1. Haghverdi L, Büttner M, Wolf FA, Buettner F & Theis FJ Diffusion pseudotime robustly reconstructs lineage branching. Nat. Methods 13, 845–848 (2016). - PubMed
    1. Trapnell C et al. The dynamics and regulators of cell fate decisions are revealed by pseudotemporal ordering of single cells. Nat. Biotechnol. 32, 381–386 (2014). - PMC - PubMed

Methods references

    1. Cohen SD, Hindmarsh AC & Dubois PF CVODE, a stiff/nonstiff ODE solver in C. Computers in physics (1996).
    1. Fröhlich F, Theis FJ, Rädler JO & Hasenauer J. Parameter estimation for dynamical systems with discrete events and logical operations. Bioinformatics 33, 1049–1056 (2017). - PubMed
    1. Stapor P et al. PESTO: Parameter EStimation TOolbox. Bioinformatics 34, 705–707 (2018). - PMC - PubMed
    1. Raue A et al. Lessons learned from quantitative dynamical modeling in systems biology. PLoS One 8, e74335 (2013). - PMC - PubMed
    1. Stubbington MJT et al. T cell fate and clonality inference from single-cell transcriptomes. Nat. Methods 13, 329–332 (2016). - PMC - PubMed

Publication types

MeSH terms