. 2019 Mar 18:10:472.
doi: 10.3389/fimmu.2019.00472. eCollection 2019.

Glucocorticoid Receptor-Deficient Foxp3+ Regulatory T Cells Fail to Control Experimental Inflammatory Bowel Disease

Affiliations

Glucocorticoid Receptor-Deficient Foxp3+ Regulatory T Cells Fail to Control Experimental Inflammatory Bowel Disease

Lourdes Rocamora-Reverte et al. Front Immunol. .

Abstract

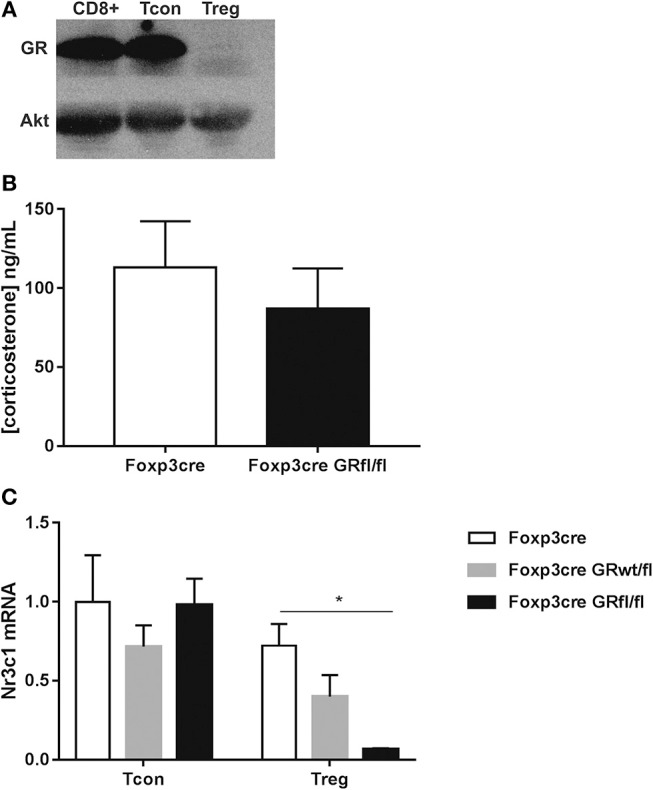
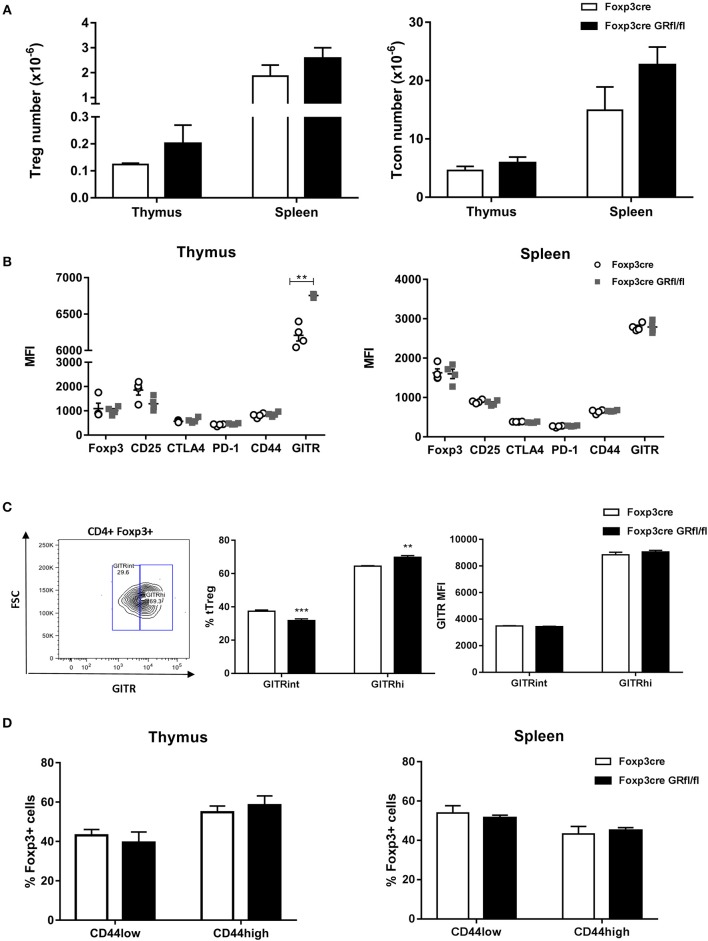
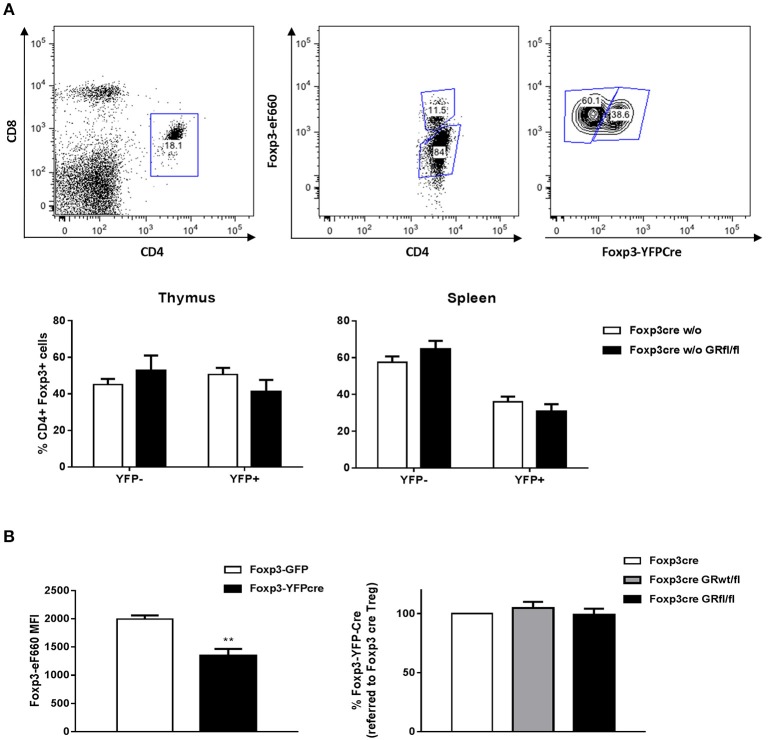
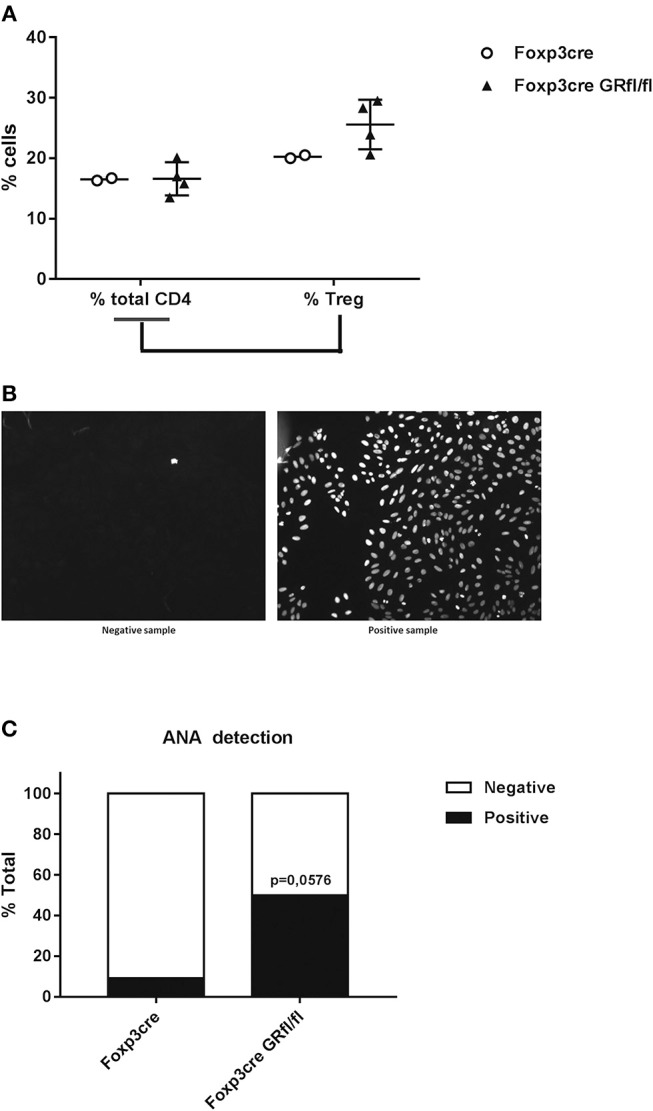
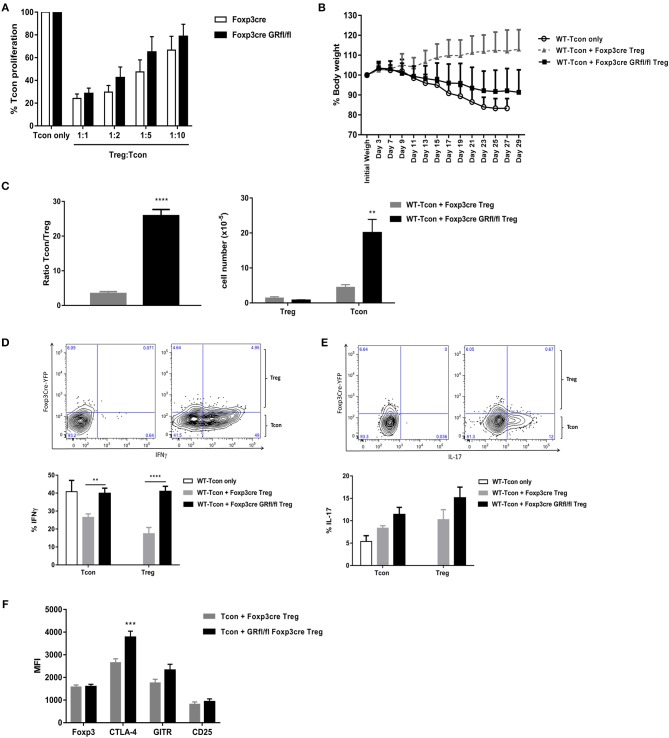
Activation of the immune system increases systemic adrenal-derived glucocorticoid (GC) levels which downregulate the immune response as part of a negative feedback loop. While CD4+ T cells are essential target cells affected by GC, it is not known whether these hormones exert their major effects on CD4+ helper T cells, CD4+Foxp3+ regulatory T cells (Treg cells), or both. Here, we generated mice with a specific deletion of the glucocorticoid receptor (GR) in Foxp3+ Treg cells. Remarkably, while basal Treg cell characteristics and in vitro suppression capacity were unchanged, Treg cells lacking the GR did not prevent the induction of inflammatory bowel disease in an in vivo mouse model. Under inflammatory conditions, GR-deficient Treg cells acquired Th1-like characteristics and expressed IFN-gamma, but not IL-17, and failed to inhibit pro-inflammatory CD4+ T cell expansion in situ. These findings reveal that the GR is critical for Foxp3+ Treg cell function and suggest that endogenous GC prevent Treg cell plasticity toward a Th1-like Treg cell phenotype in experimental colitis. When equally active in humans, a rationale is provided to develop GC-mimicking therapeutic strategies which specifically target Foxp3+ Treg cells for the treatment of inflammatory bowel disease.

Keywords: Foxp3; glucocorticoid; glucocorticoid receptor; regulatory T cell; suppression; transfer colitis.


Figures

Figure 1
Figure 1
Physical characterization of GR deletion in Foxp3+ Treg cells. (A) Immunoblotting shows GR protein expression in purified CD8+, CD4+CD25 Tcon, and CD4+Foxp3+ Treg cells from Foxp3-Cre GRfl/fl splenocytes. (B) Serum samples from Foxp3-Cre and Foxp3-Cre GRfl/fl mice were analyzed for corticosterone content by ELISA. (C) Real time qPCR analysis of Nr3c1 (GR) mRNA expression in CD4+CD25 Tcon and CD4+Foxp3+ Treg cells from Foxp3-Cre, Foxp3-Cre GRwt/fl and Foxp3-Cre GRfl/fl mice. Nr3c1 mRNA expression levels are referred to mRNA levels of CD4+ Tcon cells from Foxp3-Cre mice according to the ΔΔCt relative quantification method. Data are shown as mean ± SEM (n ≥ 3).
Figure 2
Figure 2
Immune characteristics of Foxp3-Cre GRfl/fl mice. (A) Thymi and spleens from Foxp3-Cre and Foxp3-Cre GRfl/fl mice were analyzed for cellularity of CD4+Foxp3+ Treg (left panel) and CD4+CD25 Tcon cells (right panel). (B) Treg cell signature marker expression by thymic (left panel) and splenic (right panel) CD4+Foxp3+ Treg cells. Data shown are median immunofluorescence intensity values from individual Foxp3-Cre or Foxp3-Cre GRfl/fl mice. (C) Thymic Treg cells were divided into subsets according to their GITR expression levels (GITRint or GITRhigh; left panel: gating; middle panel: frequency; right panel: MFI). (D) CD44 expression level of thymic (left panel) or splenic (right panel) CD4+Foxp3+ Treg cells from Foxp3-Cre and Foxp3-Cre GRfl/fl mice. Data are shown as mean ± SEM (n = 4).
Figure 3
Figure 3
Treg cell survival does not depend on GR expression. (A) CD4+Foxp3+ Treg cells from heterozygous female Foxp3-Cre/wt and Foxp3-Cre/wt GRfl/fl mice were divided into YFP+ (Cre+) and YFP (Cre) cells according to the gating strategy shown in the upper panels. Lower panels show YFP+ vs. YFP fractions in the thymus (left panel) or spleen (right panel). CD4+Foxp3+YFP+ Treg cells from heterozygous female Foxp3-Cre/wt GRfl/fl mice are GR-deficient whereas CD4+Foxp3+YFP Treg cells are GR-sufficient. (B) Foxp3 expression levels of Treg cells from WT (Foxp3-GFP reporter) and Foxp3-YFP-Cre mice (left panel). Data are shown as mean ± SEM (n = 3). The right panel shows Foxp3 expression in Treg cells from Foxp3-Cre, Foxp3-Cre GRwt/fl and Foxp3-Cre GRfl/fl mice. Data are shown as mean ± SEM (n = 5).
Figure 4
Figure 4
Increased frequency of antinuclear antibodies (ANA) in Foxp3-Cre GRfl/fl mice. (A) Flow cytometry analysis of splenic total CD4+ and CD4+Foxp3+ Treg cells (expressed as a percentage of total CD4+ cells) from Foxp3-Cre and Foxp3-Cre GRfl/fl mice. (B) Example of ANA determination by immunofluorescence. Mouse sera were incubated with HEp-2 cells and the presence of ANA was determined by indirect immunofluorescence microscopy. The sample on the left is ANA negative, while the sample on the right is considered ANA positive. (C) Presence of ANA in sera from 8 to 13 months old Foxp3-Cre and Foxp3-Cre GRfl/fl mice. Data are shown as mean ± SEM (n ≥ 7).
Figure 5
Figure 5
Suppression capacity of GR-deficient Treg cells is defective in vivo but not in vitro. (A) in vitro T cell suppression assay: WT CD4+Foxp3CD25CD45RBhigh Tcon cells were cultured either alone or co-cultured at different ratios with CD4+Foxp3+CD25+CD45RBlow Treg cells derived from Foxp3-Cre or Foxp3-Cre GRfl/fl mice. Data are shown as mean ± SEM (n = 5). (B) T cell transfer model of colitis in RAG1−/− mice. WT CD4+Foxp3CD25CD45RBhigh Tcon cells were either transferred alone (WT-Tcon only) or co-transferred with CD4+Foxp3+CD25+CD45RBlow Treg cells from Foxp3-Cre or Foxp3-Cre GRfl/fl mice. Body weight was assessed over time and animals were sacrificed either when weight loss exceeded 15% or 4 weeks after cell transfer (day 29) (C) Splenic CD4+CD25 Tcon and CD4+Foxp3+ Treg cells were enumerated (right panel) and the ratio between these subsets calculated (left panel). In vitro cytokine production of IFN-gamma (D) and IL-17 (E) by either splenic CD4+CD25 Tcon or CD4+Foxp3+ Treg cells obtained from RAG1−/− mice treated and sacrificed as described in (B). Representative gating strategy for IFN-gamma [(D), upper panels] and IL-17 [(E), upper panels] shows unstained samples (upper left panels) and cytokine-stained samples (upper right panels), derived from a mouse receiving WT-Tcon + GR-deficient Treg cells. (F) Treg cell signature marker expression by splenic Treg cells taken from mice described in (B). Data are shown as mean ± SEM (n ≥ 7).

References

    1. Sakaguchi S, Miyara M, Costantino CM, Hafler DA. Foxp3+ regulatory T cells in the human immune system. Nat Rev Immunol. (2010) 10:490–500. 10.1038/nri2785 - DOI - PubMed
    1. Shevach EM, Thornton AM. tTregs, pTregs, and iTregs: similarities and differences. Immunol Rev. (2014) 259:88–102. 10.1111/imr.12160 - DOI - PMC - PubMed
    1. Shevach EM. Foxp3(+) T regulatory cells: still many unanswered questions-a perspective after 20 years of study. Front Immunol. (2018) 9:1048. 10.3389/fimmu.2018.01048 - DOI - PMC - PubMed
    1. Dominguez-Villar M, Hafler DA. Regulatory T cells in autoimmune disease. Nat Immunol. (2018) 19:665–73. 10.1038/s41590-018-0120-4 - DOI - PMC - PubMed
    1. Cain DW, Cidlowski JA. Immune regulation by glucocorticoids. Nat Rev Immunol. (2017) 17:233–47. 10.1038/nri.2017.1 - DOI - PMC - PubMed

Publication types

MeSH terms