. 2019 Mar 18:10:486.
doi: 10.3389/fimmu.2019.00486. eCollection 2019.

Gab2 and Gab3 Redundantly Suppress Colitis by Modulating Macrophage and CD8+ T-Cell Activation

Affiliations

Gab2 and Gab3 Redundantly Suppress Colitis by Modulating Macrophage and CD8+ T-Cell Activation

Zhengqi Wang et al. Front Immunol. .

Abstract

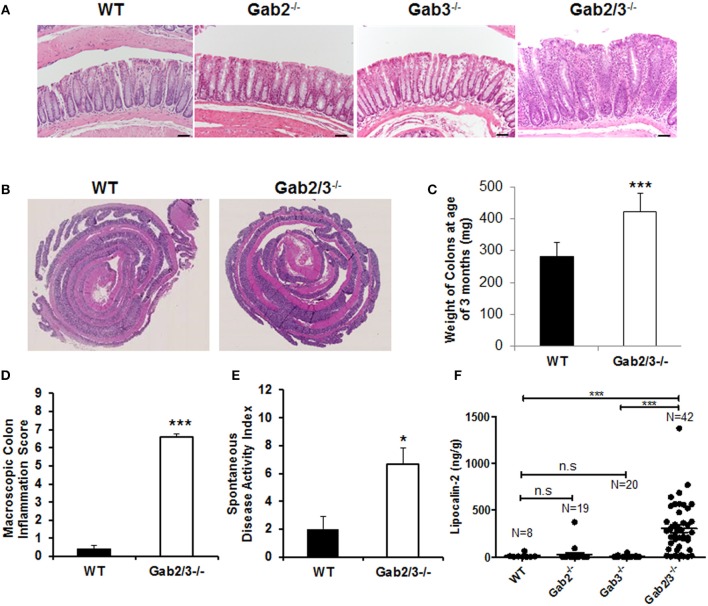
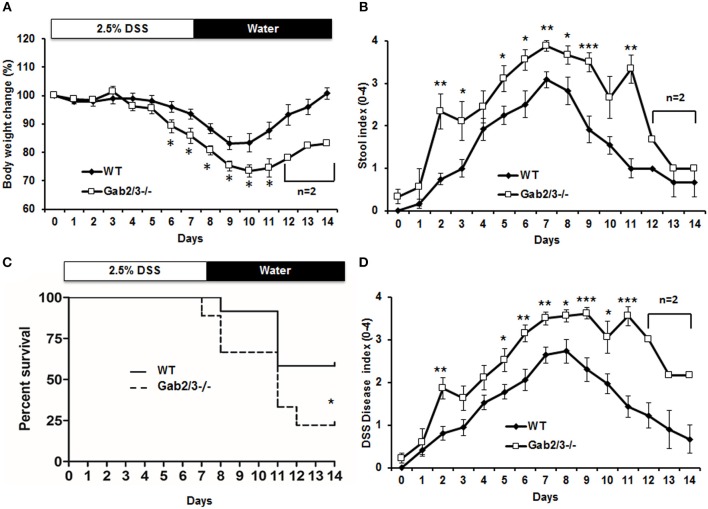
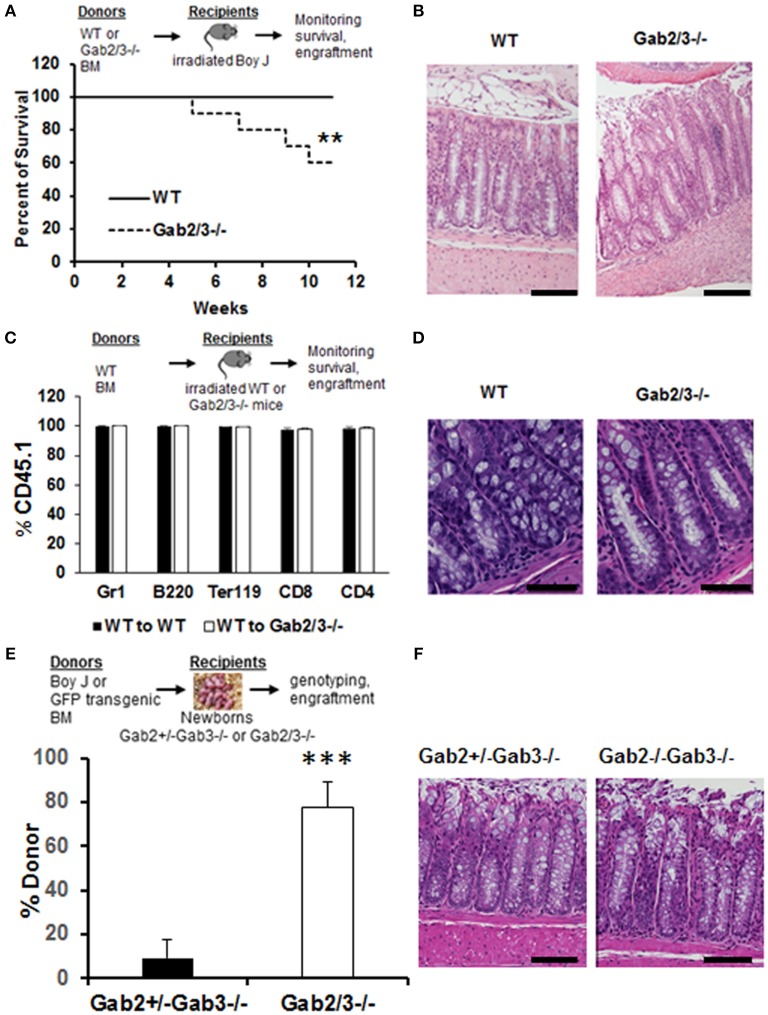
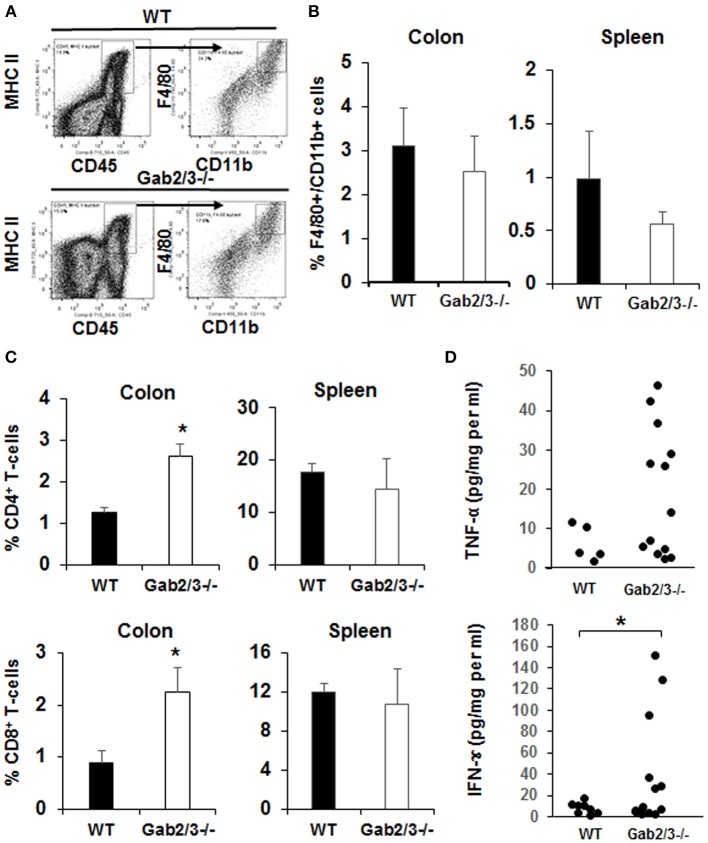
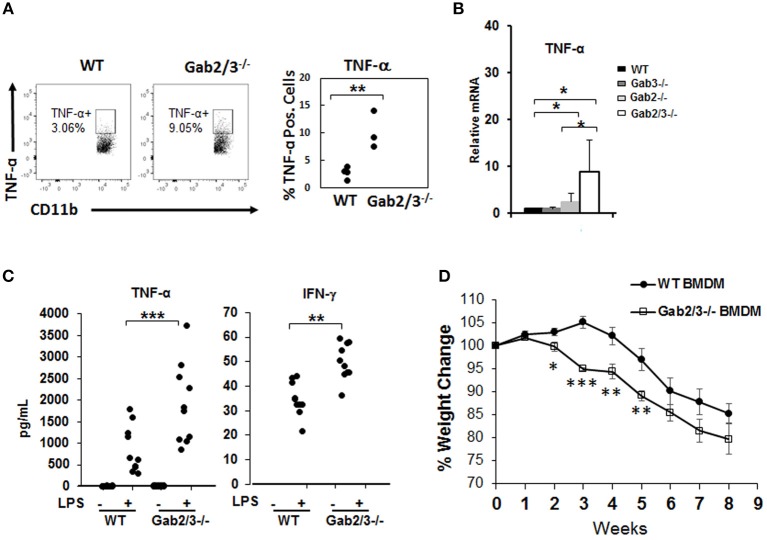
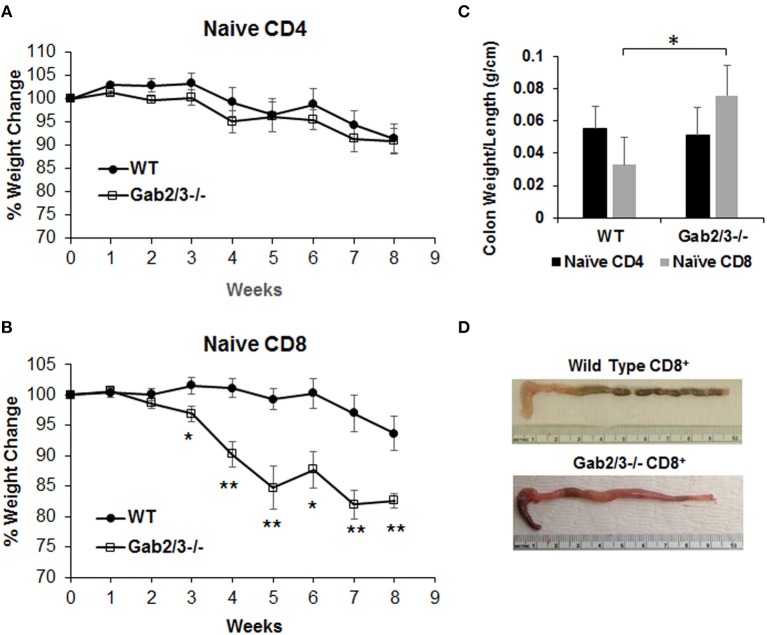
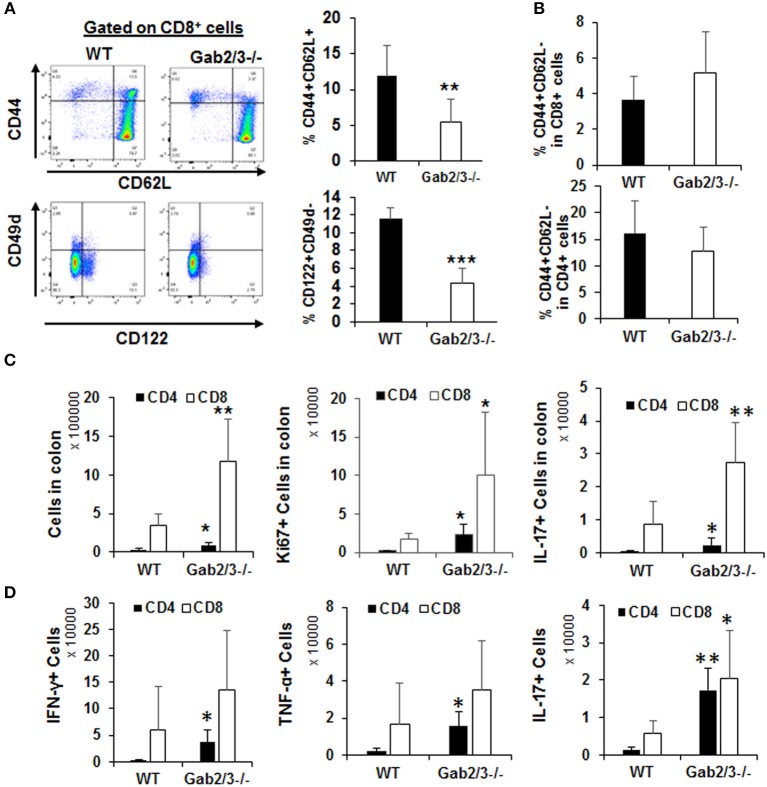
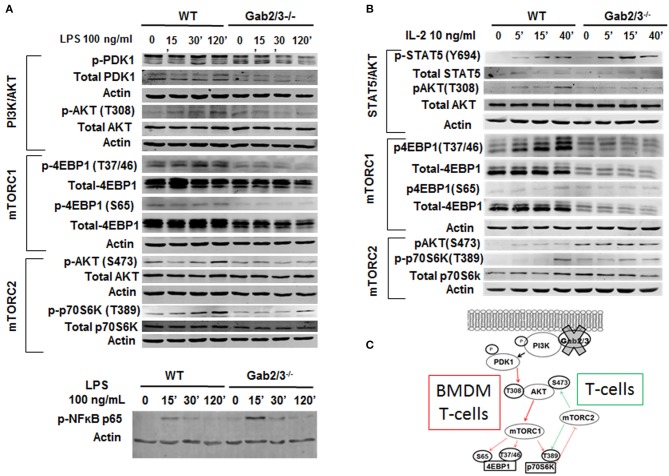
Inflammatory Bowel Disease (IBD) is a multi-factorial chronic inflammation of the gastrointestinal tract prognostically linked to CD8+ T-cells, but little is known about their mechanism of activation during initiation of colitis. Here, Grb2-associated binding 2/3 adaptor protein double knockout mice (Gab2/3-/-) were generated. Gab2/3-/- mice, but not single knockout mice, developed spontaneous colitis. To analyze the cellular mechanism, reciprocal bone marrow (BM) transplantation demonstrated a Gab2/3-/- hematopoietic disease-initiating process. Adoptive transfer showed individual roles for macrophages and T-cells in promoting colitis development in vivo. In spontaneous disease, intestinal intraepithelial CD8+ but much fewer CD4+, T-cells from Gab2/3-/- mice with rectal prolapse were more proliferative. To analyze the molecular mechanism, reduced PI3-kinase/Akt/mTORC1 was observed in macrophages and T-cells, with interleukin (IL)-2 stimulated T-cells showing increased pSTAT5. These results illustrate the importance of Gab2/3 collectively in signaling responses required to control macrophage and CD8+ T-cell activation and suppress chronic colitis.

Keywords: CD4+ T-cell; Grb2-associated binding protein; colitis; effector CD8+ T-cell; inflammatory bowel disease; intraepithelial lymphocyte; macrophage.


Figures

Figure 1
Figure 1
Development of spontaneous colitis in Gab2/3−/− but not Gab2−/− or Gab3−/− mice. (A) Representative colon histology from a total of WT, N = 3; Gab2−/−, N = 3; Gab3−/−, N = 3, Gab2/3−/−, N = 7 was assessed in WT, Gab2−/−, Gab3−/−, and Gab2/3−/− mice at 8–12 weeks of age. Bar = 50 μm. (B) Representative Swiss roll mounts displayed severe hyperplasia and increased thickness in Gab2/3−/− colons. (C) Colon weights at age 3 months were measured for both WT and Gab2/3−/−. Data are shown as mean ± standard deviation (SD) (unpaired t-test, N = 10 for WT, N = 11 for Gab2/3−/−, ***P < 0.001). (D) Macroscopic colon inflammatory scores for WT and Gab2/3−/− mice. Scoring colons was assessed by the average of colon weights, thickness, and stool consistency. Data are shown as the mean ± SD (unpaired t-test, N = 10 for WT, N = 11 for Gab2/3−/−, ***P < 0.001). (E) A composite spontaneous disease activity index of WT and Gab2/3−/− mice. Swiss roll mounts of WT and Gab2/3−/− colons were scored for the presence of crypt abscesses, crypt architectural distortion, and hyperplasia. Data are shown as mean ± SD (unpaired t-test, N = 3 for WT, N = 6 for Gab2/3−/−, *P < 0.05). (F) Stool samples were collected from mice and Lcn-2 enzyme was analyzed by ELISA based assay with the number of mice in each group indicated on the figure. (***P < 0.001; unpaired t-test).
Figure 2
Figure 2
DSS-induced colitis is more severe in Gab2/3−/− mice. WT (N = 12) and Gab2/3−/− (N = 9) mice were assessed following 2.5% DSS treatment for 7 days and then recovery on water for 7 days. (A) Body weight changes were monitored daily and were calculated as percent of the initial body weight at day 0. (B) Stool was assessed daily for consistency characterized as hard, soft, or diarrhea and for the presence of blood. (C) The percent survival of DSS-treated WT and Gab2/3−/− mice. Log rank test was used to calculate P-values (*P < 0.05). (D) Disease activity index [DAI (47)] scores measured by average of body weight loss, stool consistency, and bloody feces. For a, b, and d, data are shown as the mean ± standard error (SE). Unpaired t-test, WT from Day 0–11 (N = 7–12), Day 12–14 (N = 3); Gab2/3−/− from Day 0–10 (N = 6–9), Day 11 (N = 3), then Day 12–14 (N = 2). *P < 0.05, **P < 0.01, ***P < 0.001.
Figure 3
Figure 3
BM from Gab2/3−/− mice induces colitis in WT transplant recipients while reciprocal WT BM transplanted into Gab2/3−/− mice protects from colitis. (A) Diagram of WT or Gab2/3−/− BM transplantation into lethally-irradiated BoyJ recipients. Percentage of survival is shown as a Kaplan-Meier survival curve. Log rank test was used to calculate P-values (**P < 0.01). BM cells isolated from WT or Gab2/3−/− mice were injected into lethally-irradiated BoyJ mice (approximately 1 × 10⁷ cells/recipient). The results shown are the combination of 3 independent experiments with N = 15 for each group of mice. (B) Representative histology of WT and Gab2/3−/− BM transplanted mouse colon. Bar = 50 μm. (C) Diagram of WT BM (CD45.1) transplantation into lethally-irradiated WT or Gab2/3−/− recipients (CD45.2). The percentage of donor CD45.1 engraftment in the peripheral blood of WT BM transplanted WT or Gab2/3−/− mice. Experiments were repeated twice (N = 10 mice total for each group). (D) Representative normal colon histology in WT or Gab2/3−/− mice engrafted with WT BM donor cells. Bar = 100 μm. (E) Diagram of WT (CD45.1) or GFP transgenic BM transplantation into newborn mice on day 1 or 2 and mice were genotyped after weaning and donor engraftment was checked 16 weeks following transplantation. The percentage of donor engraftment in the peripheral blood of newborn recipients. One litter was injected with 1 × 10⁷ BoyJ BM cells and the other litter was injected with 1 × 10⁷ GFP transgenic BM cells. Totals of Gab2+/−Gab3−/− N = 9; Gab2−/−Gab3−/−, N = 4 mice (C57BL/6 background) were obtained and analyzed for evidence of long-term donor engraftment with CD45.1 congenic or GFP positive donor cells 16 weeks following injection. Data shown are the mean ± SD, ***P < 0.001; unpaired t-test. (F) Representative colon histology of Gab2+/−Gab3−/− and Gab2−/−Gab3−/− mice. Mice were euthanized at the age of 5 months and colon histology was examined. Bar = 50 μm.
Figure 4
Figure 4
Gab2/3−/− mice have increased macrophage and T-cell invasion of the colon and production of pro-inflammatory cytokines from colon extracts. (A) The flow cytometry gating strategy for F4/80 and CD11b+ cells is shown. Dead cells were excluded using the LIVE/DEAD fixable aqua dead cells stain kit (Invitrogen, Carlsbad, CA) and subsequent analyses were gated on live cells. Antigen presenting cells (APCs) were selected by MHC II and CD45 double staining, and F4/80 and CD11b cells were gated on APCs. Data were acquired with a LSRII flow cytometer (BD Biosciences, USA) and analyzed with FlowJo Software. (B) The percentages of F4/80 and CD11b double positive cells in the colon and spleen are shown as the mean ± SD (N = 4). (C) The percentage of total CD4+ and CD8+ cells in lamina propria lymphocytes (LPL) after colon digestion with collagenase or in mouse splenocytes. Data are shown as the mean ± SD (N = 4, *P < 0.05; unpaired t-test). (D) Freshly isolated mouse colon was used for colon organ culture with a 24-h collection time in IMEM with 5% FBS. Cytokines in cultured medium were measured using the mouse multiplex cytokine assay kit on a Luminex 100 instrument (N = 7, duplicated measurement). For comparison of WT vs. Gab2/3−/− groups; TNF-α P = 0.06 and for IFNγ *P = 0.02; unpaired t-test.
Figure 5
Figure 5
Increased induction of pro-inflammatory cytokines from unstimulated Gab2/3−/− BMDMs. (A) Freshly isolated BM from WT or Gab2/3−/− mice (high Lcn-2 level) were analyzed by intracellular flow cytometry using CD11b and F4/80 markers to identify macrophages and TNF-α antibody was used to detect cytokine-expressing macrophages (unpaired t-test, **P < 0.01). (B) BMDMs were analyzed for TNF-α mRNA levels by qRT-PCR. Both WT and Gab3−/− BMDM, N = 7; Gab2−/− BMDM, N = 5 and Gab2/3−/− BMDM, N = 3; *P < 0.05, unpaired t-test. (C) BMDMs were treated with or without LPS for 12 h and supernatant was collected to detect protein levels of TNF-α and IFN-γ by Luminex assay. The results shown represent 3 or more independent experiments. (**P < 0.01; ***P < 0.001; unpaired t-test). IFNγ levels were undetectable in unstimulated BMDMs. (D) WT or Gab2/3−/− LPS-activated BMDM cells (1 × 10⁶ each) were transferred into each Rag2−/− mouse by IP injection and 24 h later each mouse also received 8 × 10⁵ sorted WT naïve CD4+ T-cells. The weight change was monitored weekly and is shown as the mean ± SE for N = 11 for WT, N = 8 for Gab2/3−/− groups. Relative to WT, the time points for Gab2/3−/− with a significant change are indicated on the figure (*P < 0.05; **P < 0.01; ***P < 0.001, unpaired t-test). The results are representative from two independent experiments.
Figure 6
Figure 6
Adoptively transferred naïve Gab2/3−/− CD8+ T-cells are more colitogenic than WT CD8+ T-cells. (A) FACS sorted naïve CD4+CD45RBhigh cells from WT or Gab2/3−/− mice were transferred into Rag2−/− mice via IP injection (8 × 10⁵ cells/recipient). The weight change was monitored weekly. The results shown are combined from two independent experiments and are shown as the mean ± SE, for N = 12 from WT naïve CD4 and N = 16 for Gab2/3−/− naïve CD4. There was no significant difference between WT and Gab2/3−/− naïve CD4+ cell-transferred mice (unpaired t-test). (B) FACS isolated naïve CD8+ cells (CD8+CD44CD62L+) from WT or Gab2/3−/− mice were transferred into Rag2−/− mice via IP injection (4 × 10⁵ cells/recipient). The weight change was monitored weekly. The results shown are combined from 2 independent experiments and are shown as the mean ± SE, for N = 10 for WT and Gab2/3−/− naïve CD8 (*P < 0.05, **P < 0.01, unpaired t-test). (C) The ratio of colon weight/length is shown. Upon euthanasia, the colon weight and length were measured (data are presented as the mean ± SD, N = 8–9 mice per group, *P < 0.05; unpaired t-test). (D) Representative examples of the colon comparing WT to Gab2/3−/− naïve CD8+ T-cell adoptive transfer recipients.
Figure 7
Figure 7
Gab2/3−/− CD8+ intraepithelial T-cells have greater in vivo effector activities. (A) Freshly isolated splenocytes from WT and Gab2/3−/− mice were stained with CD4, CD8, CD44, CD62L, CD122, CD49d, and Sca1 antibodies. A representative histogram and gating strategy is shown on the left. Gating on CD8+ cells, the percentage of CD44+CD62L+ and CD122+CD49d is shown as the mean ± SD, N = 6, **P < 0.01; ***P < 0.001; unpaired t-test). Gab2/3−/− mouse spleen had a reduced population of CD44+CD62L+ and CD122+CD49d cells. (B) No change in either CD4+ or CD8+ splenocytes with the CD44+CD62L effector phenotype. (C) The total number of intraepithelial lymphocytes, Ki67+, and IL-17+ cells in colons from WT and Gab2/3−/− mice (For total and Ki67, N = 6; For IL-17, N = 6–7; **P < 0.01; *P < 0.05; unpaired t-test). (D) IELs were isolated and stimulated for 4 h with 50 ng/ml PMA/750 ng/ml ionomycin/5μg/ml BFA and the levels of intracellular IFNγ, TNFα, and IL-17 were measured by flow cytometry (N = 5; **P < 0.01; *P < 0.05; unpaired t-test). All data are shown as the mean ± SD.
Figure 8
Figure 8
Dysregulated PI3K/AKT/mTOR signaling in Gab2/3−/− BMDMs and T-cells. (A) Mature BMDMs were analyzed for the protein expression of several intermediates of the PI3K/AKT/mTOR signaling pathway following 0, 30, and 120 min of stimulation with 100 ng/ml LPS. Changes in PI3K/AKT/mTOR signaling pathway components including AKT, p70S6K, and 4EBP1 were observed and representative blots are shown. (B) Splenic T-cells were analyzed by Western blot for STAT5 and signaling molecules in the PI3K/AKT/mTORC1 pathway. WT and Gab2/3−/− T-cells were treated with or without 10 ng/mL IL-2. Representative blots are shown. (C) Schematic illustrations of roles for Gab2/3 in promoting PI3K/Akt/mTOR pathway activation with key phosphorylation sites shown. Inhibited pathways involving mTORC1 are shown with thin red arrows resulting in loss of negative feedback regulation in activated T-cells but not activated macrophages. T-cell specific gain of mTORC2 is reflected by the green arrows which activate AKT by phosphorylation of S473.

References

    1. Murray PJ, Smale ST. Restraint of inflammatory signaling by interdependent strata of negative regulatory pathways. Nat Immunol. (2012) 13:916–24. 10.1038/ni.2391 - DOI - PMC - PubMed
    1. Sellon RK, Tonkonogy S, Schultz M, Dieleman LA, Grenther W, Balish E, et al. . Resident enteric bacteria are necessary for development of spontaneous colitis and immune system activation in interleukin-10-deficient mice. Infect Immun. (1998) 66:5224–31. - PMC - PubMed
    1. Bouma G, Strober W. The immunological and genetic basis of inflammatory bowel disease. Nat Rev Immunol. (2003) 3:521–33. 10.1038/nri1132 - DOI - PubMed
    1. Mizoguchi A. Animal models of inflammatory bowel disease. Prog Mol Biol Transl Sci. (2012) 105:263–320. 10.1016/B978-0-12-394596-9.00009-3 - DOI - PubMed
    1. Lee JC, Lyons PA, McKinney EF, Sowerby JM, Carr EJ, Bredin F, et al. . Gene expression profiling of CD8+ T cells predicts prognosis in patients with Crohn disease and ulcerative colitis. J Clin Invest. (2011) 121:4170–9. 10.1172/JCI59255 - DOI - PMC - PubMed

Publication types

MeSH terms