. 2019 Mar 20;7(3):e01233.
doi: 10.1002/aps3.1233. eCollection 2019 Mar.

Toward a large-scale and deep phenological stage annotation of herbarium specimens: Case studies from temperate, tropical, and equatorial floras

Affiliations

Toward a large-scale and deep phenological stage annotation of herbarium specimens: Case studies from temperate, tropical, and equatorial floras

Titouan Lorieul et al. Appl Plant Sci. .

Abstract

Premise of the study: Phenological annotation models computed on large-scale herbarium data sets were developed and tested in this study.

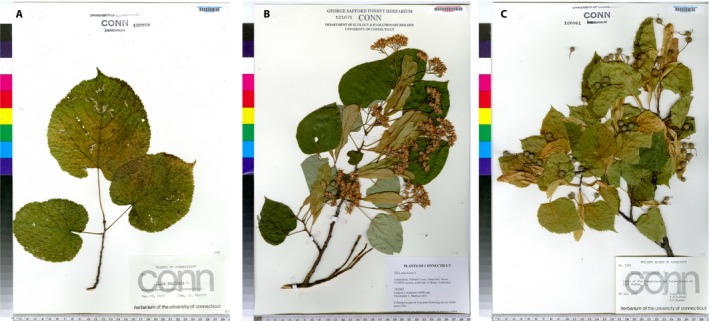
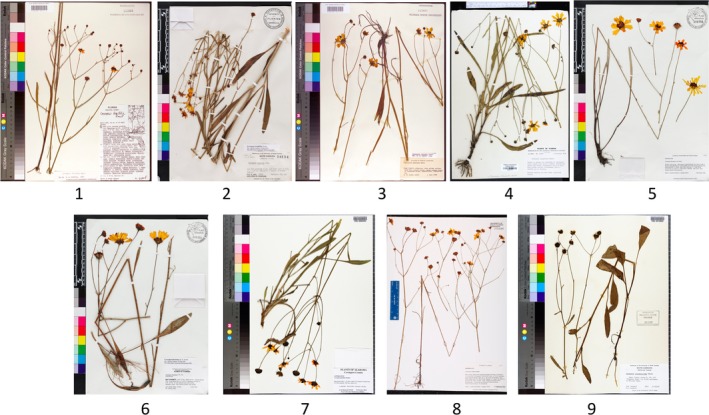
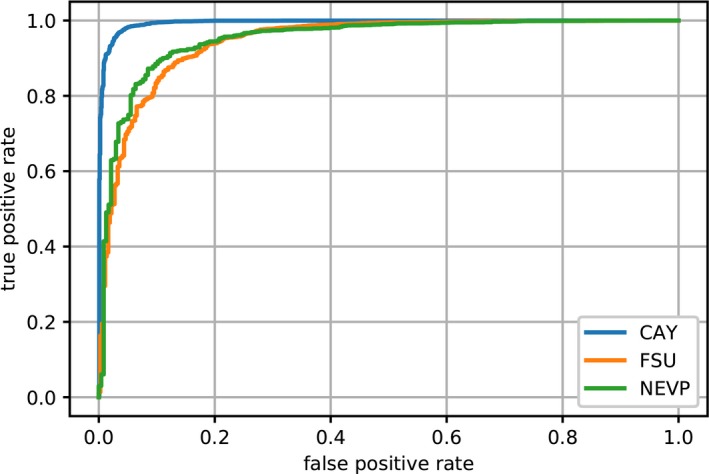
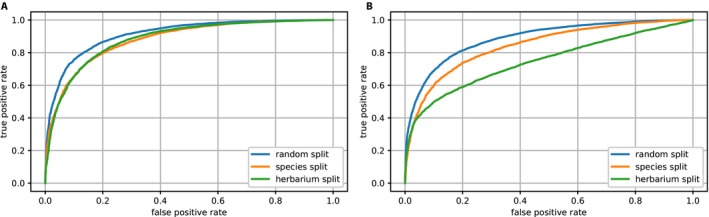
Methods: Herbarium specimens represent a significant resource with which to study plant phenology. Nevertheless, phenological annotation of herbarium specimens is time-consuming, requires substantial human investment, and is difficult to mobilize at large taxonomic scales. We created and evaluated new methods based on deep learning techniques to automate annotation of phenological stages and tested these methods on four herbarium data sets representing temperate, tropical, and equatorial American floras.

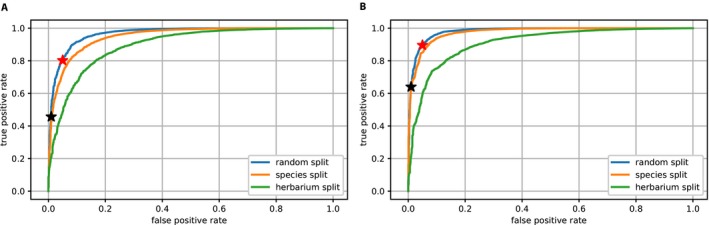
Results: Deep learning allowed correct detection of fertile material with an accuracy of 96.3%. Accuracy was slightly decreased for finer-scale information (84.3% for flower and 80.5% for fruit detection).

Discussion: The method described has the potential to allow fine-grained phenological annotation of herbarium specimens at large ecological scales. Deeper investigation regarding the taxonomic scalability of this approach is needed.

Keywords: convolutional neural network; deep learning; herbarium data; natural history collections; phenological stage annotation; visual data classification.


Figures

Figure 1
Figure 1
Illustration of the different phenological stages of Tilia americana on the NEVP herbarium data set. (A) Non‐fertile specimen, (B) specimen with open flowers, (C) specimen with ripe fruits.
Figure 2
Figure 2
Illustration of the nine different phenophases of Coreopsis gladiata recorded in the PHENO data set.
Figure 3
Figure 3
Fertility receiver operating characteristic (ROC) curves for EXP1‐Fertility, with ResNet50‐Large (A) and ResNet50‐VeryLarge (B). Blue = test set A (Random‐split); orange = test set B (Species‐split); green = test set C (Herbarium‐split); red stars = percentage of fertile specimens correctly detected at a false positive rate of 5%; black stars = percentage of fertile specimens correctly detected at a false positive rate of 1%.
Figure 4
Figure 4
Fertility receiver operating characteristic (ROC) curves for EXP1‐Fertility, with ResNet50‐VeryLarge.
Figure 5
Figure 5
Flower detection (A) and fruit detection (B) receiver operating characteristic (ROC) curves for EXP2‐Fl.Fr, with ResNet50‐VeryLarge. Blue = test set A (Random‐split); orange = test set B (Species‐split); green = test set C (Herbarium‐split).
Figure 6
Figure 6
L1 error cumulative distribution for phenophase detection experiment (EXP3‐Pheno) using the PHENO data set.
Figure 7
Figure 7
Row‐wise normalized confusion matrix of phenophase classification experiment (EXP3‐Pheno) using the PHENO data set.
Figure 8
Figure 8
Illustration of some difficult specimens to annotate in EXP1‐Fertility. (A) Fertile specimen of Hymenophyllum hirsutum, wrongly annotated by the ResNet50‐VeryLarge model and the human observer (P.B.). Fertility is expressed by small terminal sori (1–1.5 mm in diameter) at the extremity of the lamina. Red arrows show them on a close‐up of the lamina. (B) Fertile specimen of Cordia fanchoniae, wrongly annotated by the ResNet50‐VeryLarge model and correctly annotated by the human observer (P.B.). Fertility is expressed by a small young infructescence (1.3 cm high, marked by red arrows), just after anthesis and before the development of fruits.

References

    1. Allen, J. M. , Folk R. A., Soltis P. S., Soltis D. E., and Guralnick R. P.. 2018. Biodiversity synthesis across the green branches of the tree of life. Nature Plants 5: 11–13. - PubMed
    1. Bartomeus, I. , Ascher J. S., Wagner D., Danforth B. N., Colla S., Kornbluth S., and Winfree R.. 2011. Climate‐associated phenological advances in bee pollinators and bee‐pollinated plants. Proceedings of the National Academy of Sciences USA 108(51): 20645–20649. - PMC - PubMed
    1. Botella, C. , Joly A., Bonnet P., Monestiez P., and Munoz F.. 2018. A deep learning approach to species distribution modelling In Joly A., Vrochidis S., Karatzas K., Karppinen A., and Bonnet P. [eds.], Multimedia tools and applications for environmental and biodiversity informatics, 169–199. Springer, Cham, Switzerland.
    1. Brenskelle, L. , Stucky B. J., Deck J., Walls R., and Guralnick R. P.. 2019. Integrating herbarium specimen observations into global phenology data systems. Applications in Plant Sciences 7(3): e1231. - PMC - PubMed
    1. Carranza‐Rojas, J. , Goeau H., Bonnet P., Mata‐Montero E., and Joly A.. 2017. Going deeper in the automated identification of herbarium specimens. BMC Evolutionary Biology 17(1): 181. - PMC - PubMed