. 2019 Mar 27;5(3):477-485.
doi: 10.1021/acscentsci.8b00850. Epub 2019 Feb 13.

Promoting Angiogenesis in Oxidative Diabetic Wound Microenvironment Using a Nanozyme-Reinforced Self-Protecting Hydrogel

Affiliations

Promoting Angiogenesis in Oxidative Diabetic Wound Microenvironment Using a Nanozyme-Reinforced Self-Protecting Hydrogel

Haibin Wu et al. ACS Cent Sci. .

Abstract

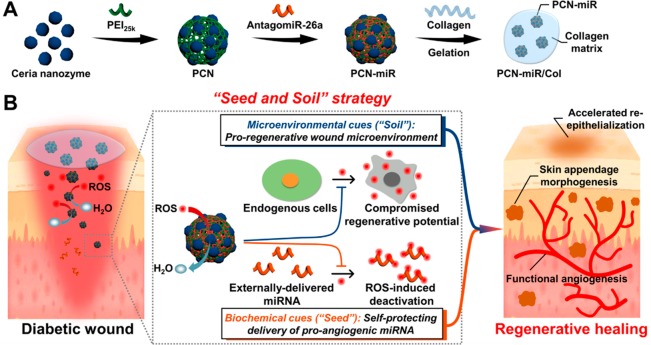
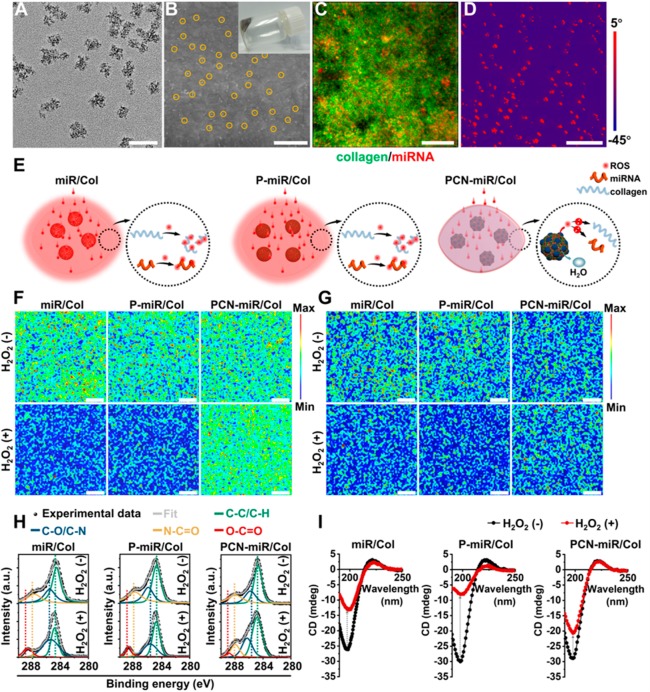
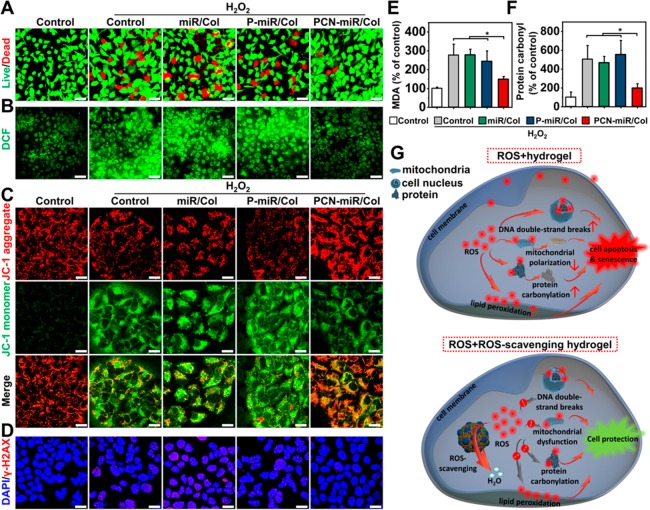
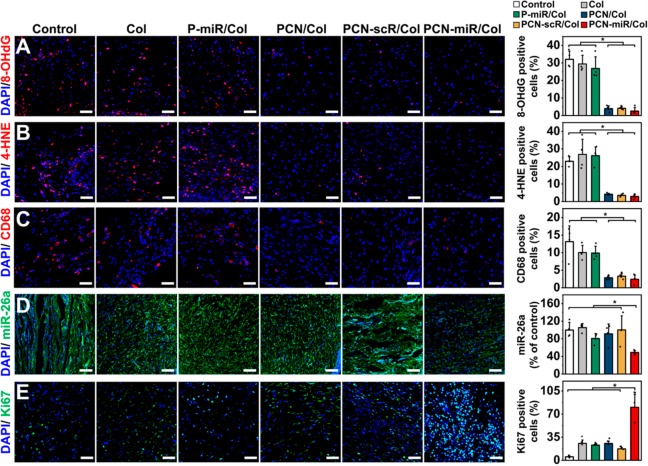
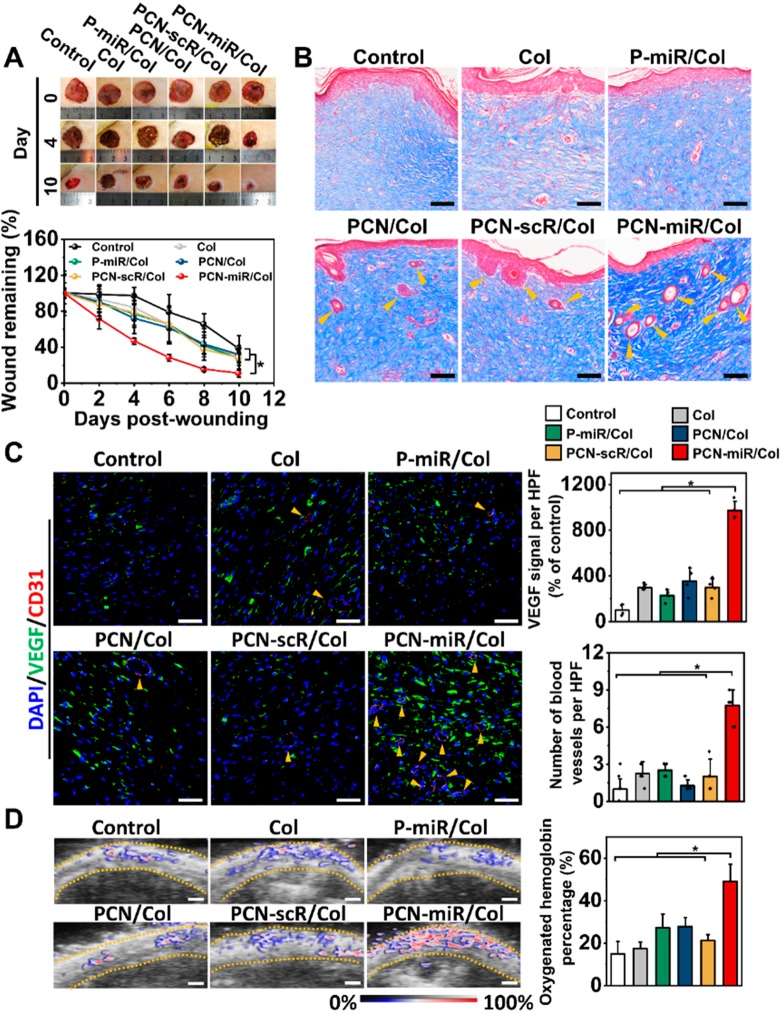
Impaired diabetic wound healing represents a devastating and rapidly growing clinical problem associated with high morbidity, mortality, and recurrence rates. Engineering therapeutic angiogenesis in the wounded tissue is critical for successful wound healing. However, stimulating functional angiogenesis of the diabetic wound remains a great challenge, due to the oxidative damage and denaturation of bio-macromolecule-based angiogenic agents in the oxidative diabetic wound microenvironment. Here, we present a unique "seed-and-soil" strategy that circumvents the limitation by simultaneously reshaping the oxidative wound microenvironment into a proregenerative one (the "soil") and providing proangiogenic miRNA cues (the "seed") using an miRNA-impregnated, redox-modulatory ceria nanozyme-reinforced self-protecting hydrogel (PCN-miR/Col). The PCN-miR/Col not only reshapes the hostile oxidative wound microenvironment, but also ensures the structural integrity of the encapsulated proangiogenic miRNA in the oxidative microenvironment. Diabetic wounds treated with the PCN-miR/Col demonstrate a remarkably accelerated wound closure and enhanced quality of the healed wound as featured by highly ordered alignment of collagen fiber, skin appendage morphogenesis, functional new blood vessel growth, and oxygen saturation.


Conflict of interest statement

The authors declare no competing financial interest.

Figures

Figure 1
Figure 1
Schematic illustration of the fabrication process for the PCN-miR/Col hydrogel, and the strategy for functional angiogenesis and regenerative diabetic wound healing. (A) Schematic illustration of the fabrication routes for PCN-miR/Col. (B) Schematic illustration of the PCN-miR/Col-enabled strategy for simultaneous self-protecting delivery of proangiogenic miRNA cues and creation of proregenerative wound microenvironment to drive highly efficient functional angiogenesis and regenerative diabetic wound healing.
Figure 2
Figure 2
Characterization of PCN-miR/Col hydrogel and their resistance to oxidative denaturation. (A) TEM image of PCN-miR. Scale bar, 50 nm. (B) SEM image of the surface of PCN-miR/Col (inset: digital photograph of PCN-miR/Col hydrogel). The PCN-miR (marked by yellow solid circles) was clearly observed. Scale bar, 1 μm. (C) Three-dimensional confocal laser scanning microscopy (CLSM) image of PCN-miR/Col, where collagen from the hydrogel is labeled with fluorescein isothiocyanate (green), and antagomiR-26a is tagged with Cy5 (red). Scale bar, 100 μm. (D) AFM phase image of PCN-miR/Col. Scale bar, 500 nm. (E) Schematic illustration of the responses of collagen-based hydrogels under ROS exposure. Confocal Raman mapping of collagen-based hydrogels before (upper panel) and after (lower panel) exposure to H2O2: (F) the 1280 cm–1 peak corresponds to the amide III from collagen, and (G) the 810 cm–1 peak corresponds to the backbone O-P-O stretching from antagomiR-26a. Scale bars, 20 μm. (H) Deconvoluted high-resolution C1s XPS and (I) CD spectra of collagen-based hydrogels with or without exposure to H2O2. The XPS spectra were fitted to four energy components centered at around 284.6 (C-C/C-H), 285.5 (C-O/C-N), 287.8 (N-C=O), and 288.6 (O-C=O) eV.
Figure 3
Figure 3
Incubation with the PCN-miR/Col confers robust protection to ROS-exposed cells. (A) Pretreatment of HUVECs with PCN-miR/Col abrogated H2O2-induced cell viability loss as indicated by live/dead staining with calcein-AM (green) and propidium iodide (red). Scale bars, 50 μm. (B) Representative CLSM images showing the H2O2-induced intracellular ROS accumulation in HUVECs with various pretreatments, using DCF-DA as an ROS indicator. Scale bars, 50 μm. Representative confocal images of (C) JC-1 (a mitochondrial membrane potential-sensitive probe) and (D) γ-H2AX (a marker of DNA double-strand breaks) staining in cells with various pretreatments after exposure to H2O2. Scale bars, 20 μm. (E) Lipid peroxidation product MDA and (F) protein carbonylation levels in cells with various pretreatments after exposure to H2O2. All results are presented as mean ± SD, *P < 0.05 by two-tailed unpaired Student’s t tests, n = 3. (G) Schematic illustration of the ROS-induced damage responses in cells cultured on collagen-based hydrogels.
Figure 4
Figure 4
In vivo topical application of PCN-miR/Col reshapes the highly oxidative and inflammatory wound microenvironment and corrects miR-26a overexpression. Representative confocal images of immunofluorescence staining and quantification for (A) 8-OHdG (a marker of oxidative DNA damage), (B) 4-HNE (a marker of lipid peroxidation), (C) CD68-positive macrophages, (D) miR-26a, and (E) Ki67-positive cells in sections from each group after 28 days of treatment (n = 4). Scale bars for 8-OHdG, 4-HNE, CD68, and Ki67 images, 50 μm; Scale bars for miR-26a image, 100 μm. All results are presented as mean ± SD, *P < 0.05 by two-tailed unpaired Student’s t tests.
Figure 5
Figure 5
PCN-miR/Col induces accelerated and regenerative diabetic wound healing in vivo. (A) Digital images of wounds at day 0, 4, and 10 after the indicated treatment (left panel) and quantification of wound closure as a percentage of the initial wound area (right panel, n = 5). (B) Masson’s trichrome staining of representative wound tissues from each group after 28 days of treatment. Scale bars, 100 μm. (C) Representative confocal images of VEGF and CD31 double-stained sections and quantification for VEGF expression and number of blood vessels per high-powered field (HPF) from each group at day 28. Scale bars, 50 μm. n = 4. (D) Photoacoustic images and quantification for oxygenated hemoglobin from each group at day 28. Scale bars, 1 mm. n = 3. All results are presented as mean ± SD, *P < 0.05 by two-tailed unpaired Student’s t tests.

References

    1. Falanga V. Wound healing and its impairment in the diabetic foot. Lancet 2005, 366, 1736–1743. 10.1016/S0140-6736(05)67700-8. - DOI - PubMed
    1. Armstrong D. G.; Boulton A. J. M.; Bus S. A. Diabetic foot ulcers and their recurrence. N. Engl. J. Med. 2017, 376, 2367–2375. 10.1056/NEJMra1615439. - DOI - PubMed
    1. Marino D.; Luginbuhl J.; Scola S.; Meuli M.; Reichmann E. Bioengineering dermo-epidermal skin grafts with blood and lymphatic capillaries. Sci. Transl. Med. 2014, 6, 221ra14. 10.1126/scitranslmed.3006894. - DOI - PubMed
    1. Wang H.; Agarwal P.; Xiao Y.; Peng H.; Zhao S.; Liu X.; Zhou S.; Li J.; Liu Z.; He X. A nano-in-micro system for enhanced stem cell therapy of ischemic diseases. ACS Cent. Sci. 2017, 3, 875–885. 10.1021/acscentsci.7b00213. - DOI - PMC - PubMed
    1. Duscher D.; Neofytou E.; Wong V. W.; Maan Z. N.; Rennert R. C.; Inayathullah M.; Januszyk M.; Rodrigues M.; Malkovskiy A. V.; Whitmore A. J.; et al. Transdermal deferoxamine prevents pressure-induced diabetic ulcers. Proc. Natl. Acad. Sci. U. S. A. 2015, 112, 94–99. 10.1073/pnas.1413445112. - DOI - PMC - PubMed

LinkOut - more resources