. 2019 Apr 2:8:e39159.
doi: 10.7554/eLife.39159.

Deficit of mitogen-activated protein kinase phosphatase 1 (DUSP1) accelerates progressive hearing loss

Affiliations

Deficit of mitogen-activated protein kinase phosphatase 1 (DUSP1) accelerates progressive hearing loss

Adelaida M Celaya et al. Elife. .

Abstract

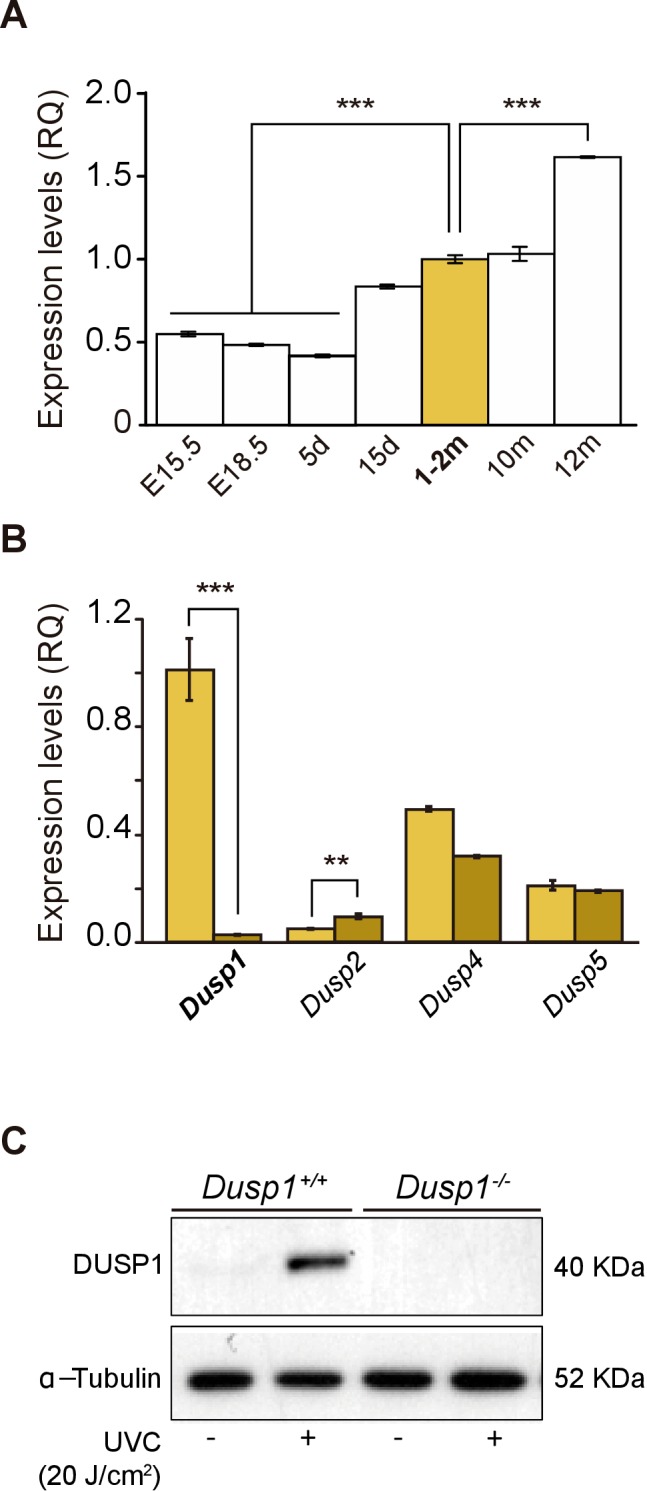
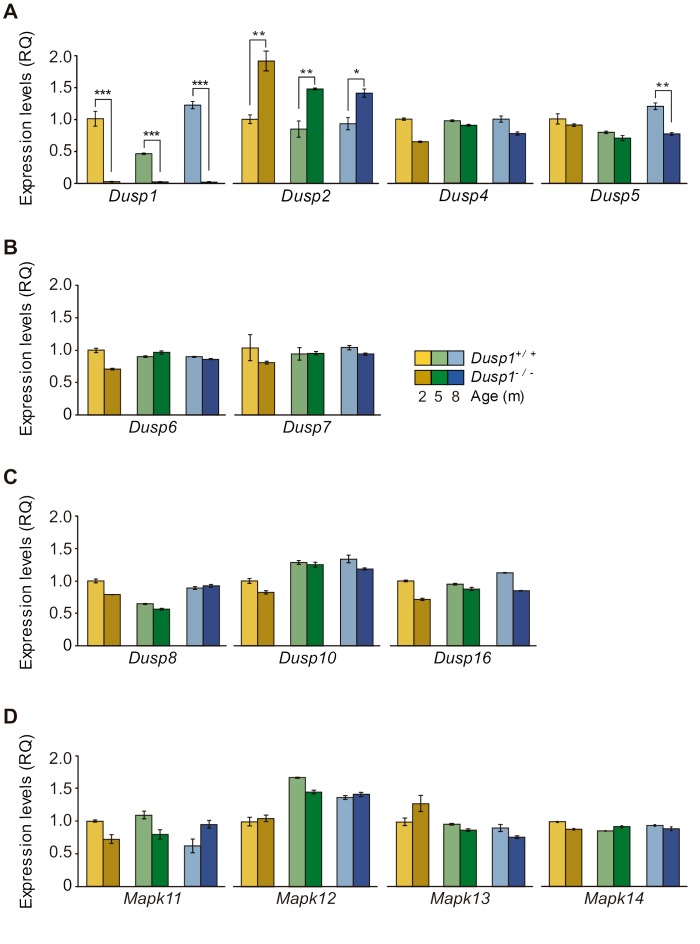
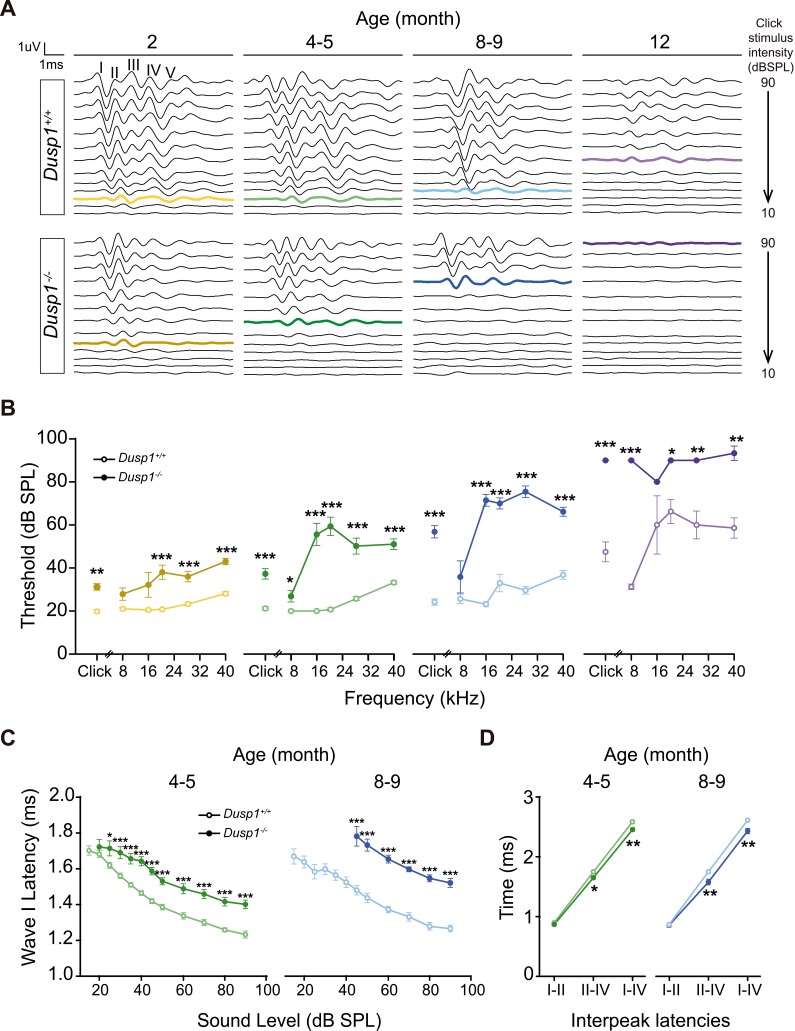
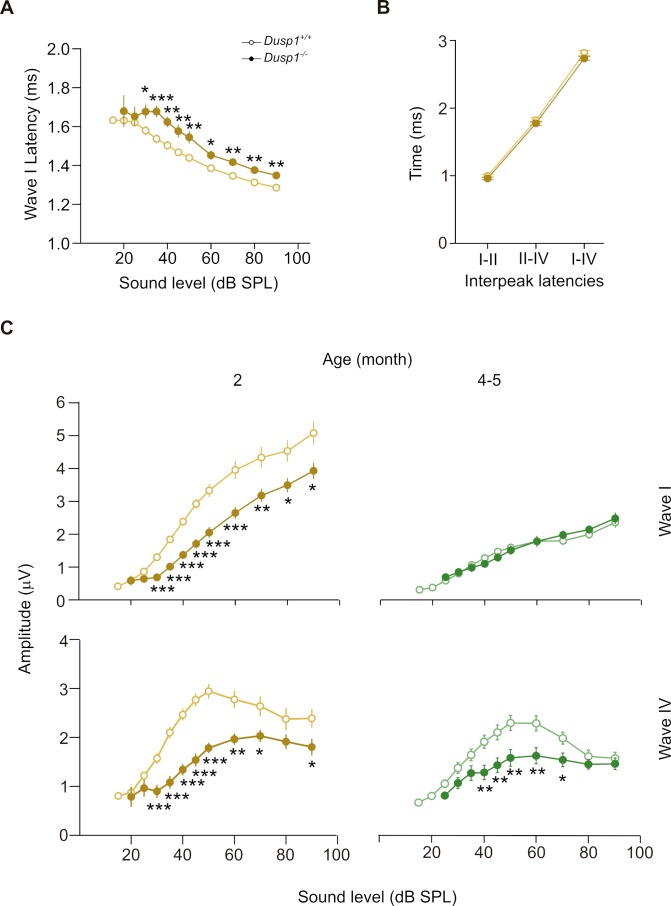
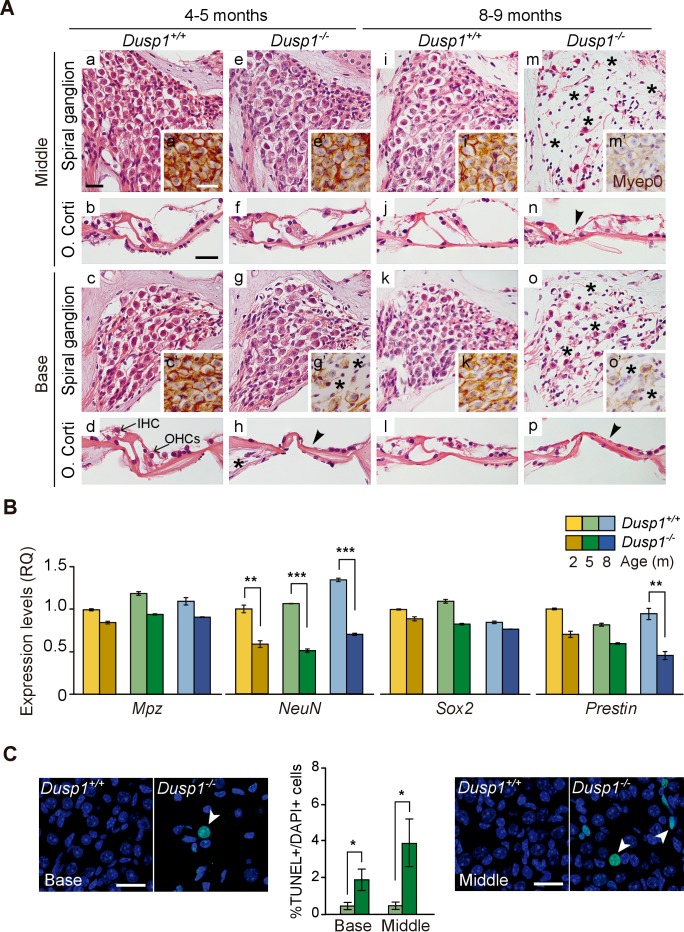
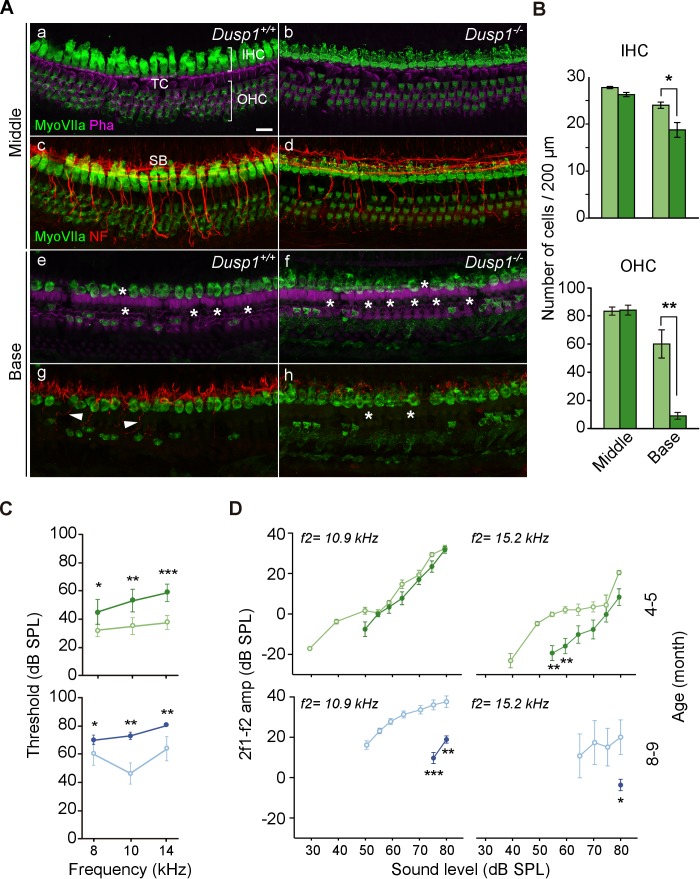
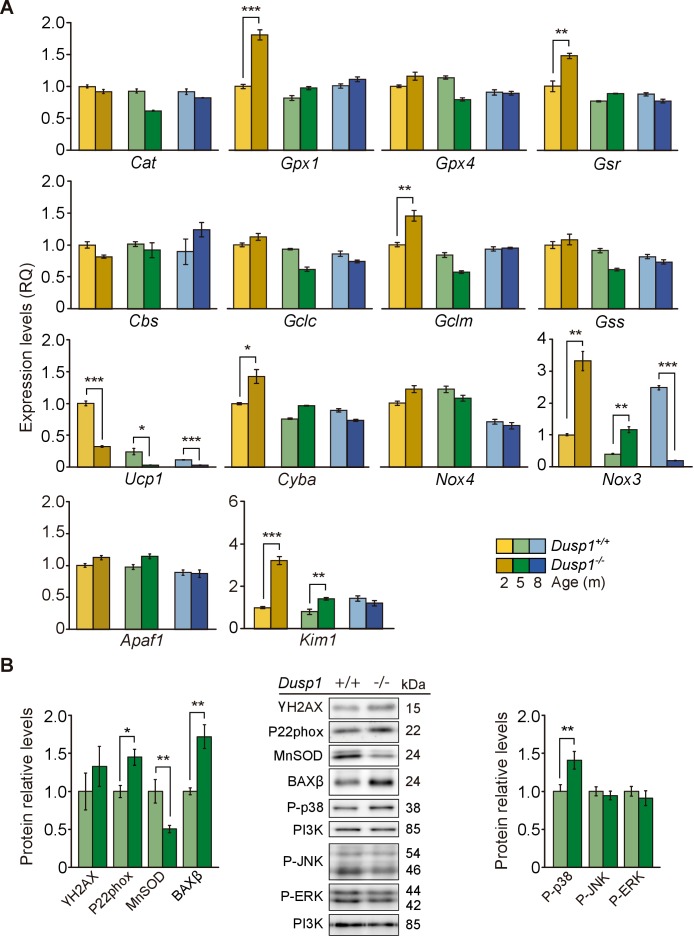
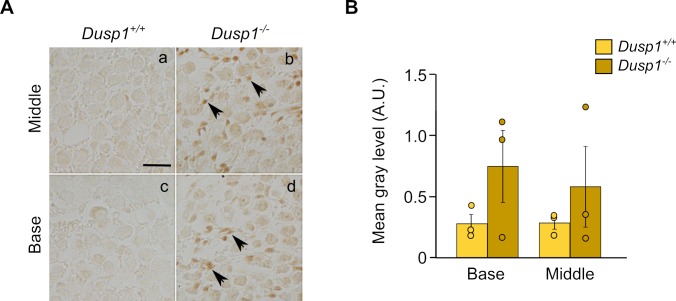
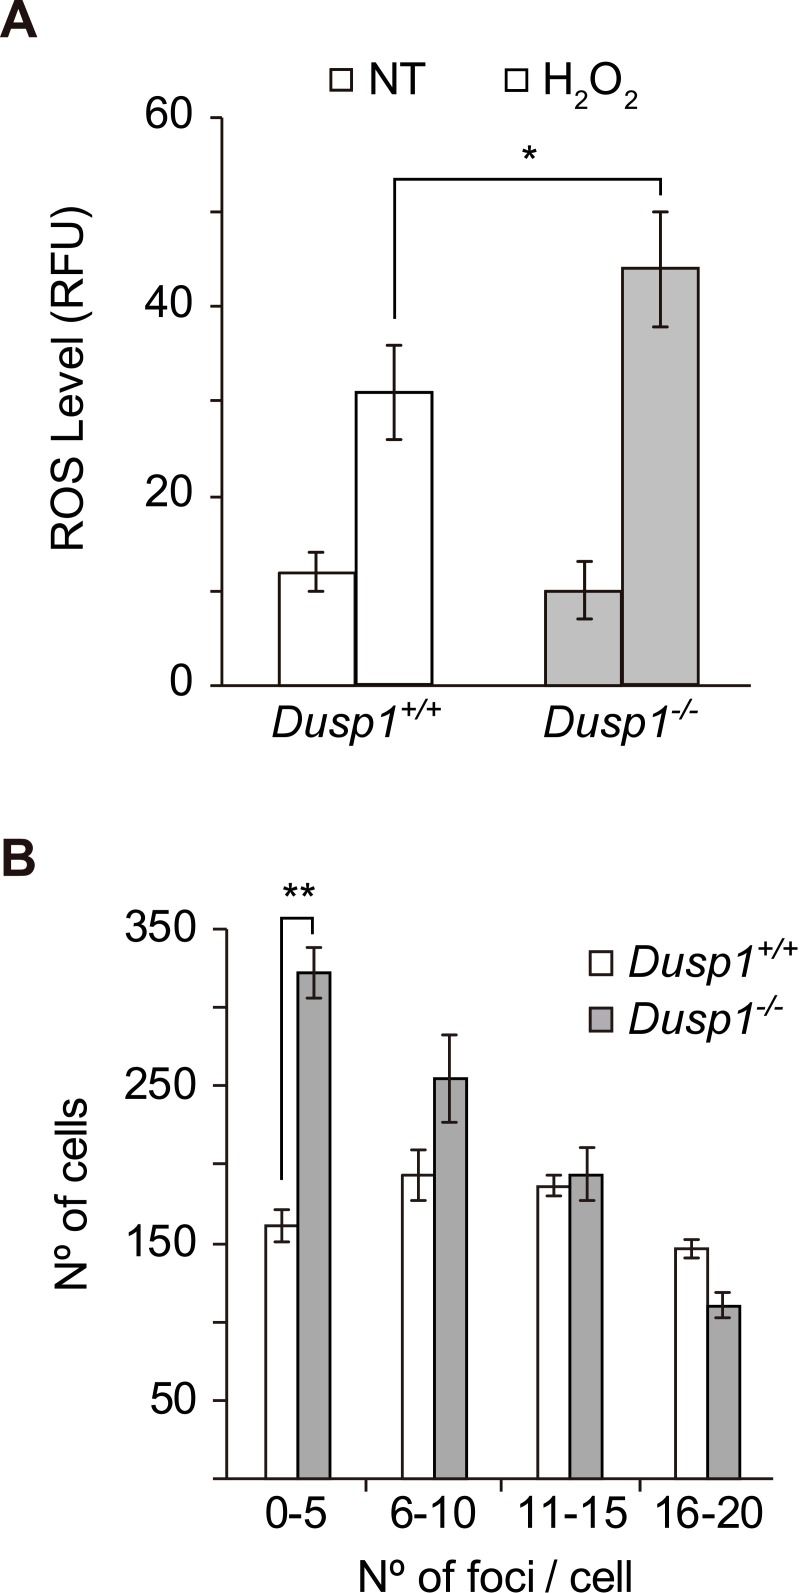
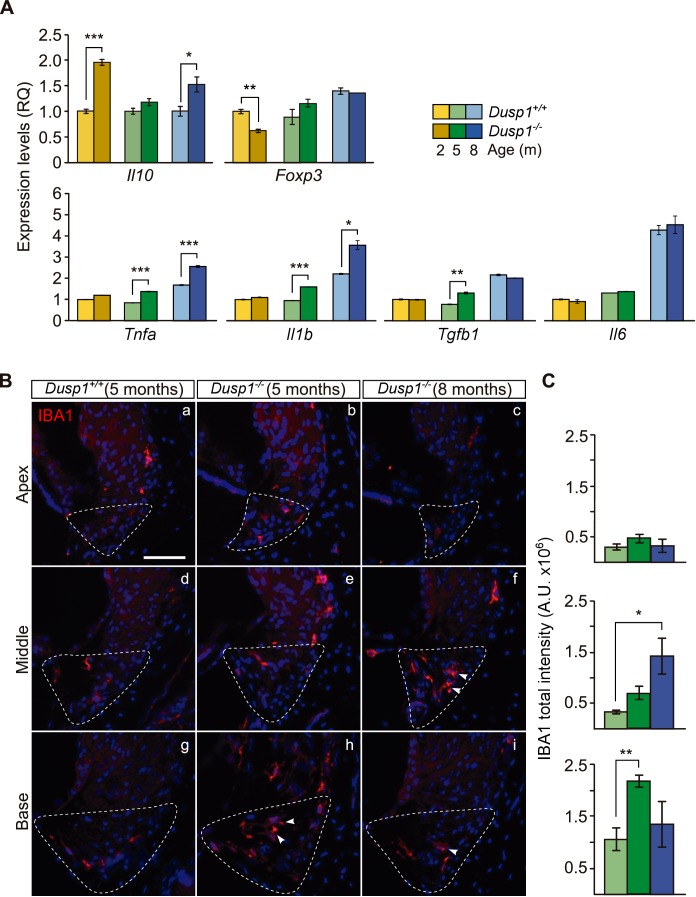
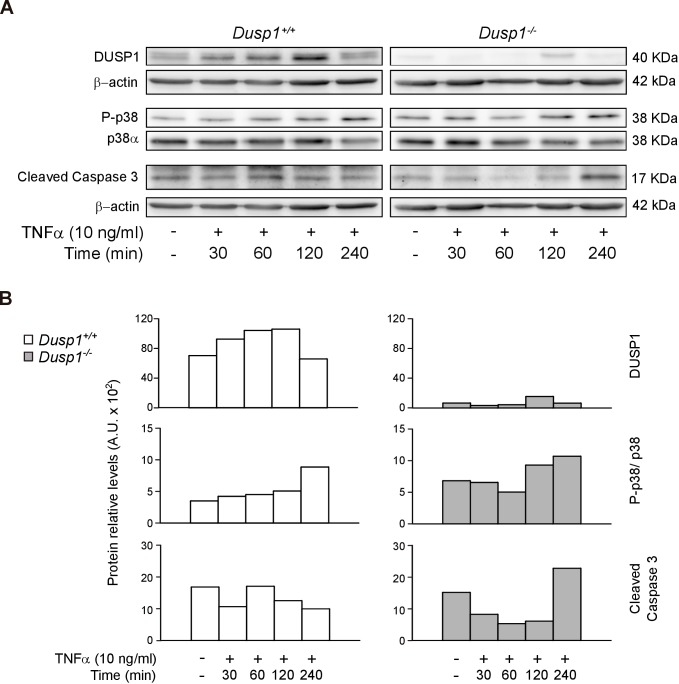
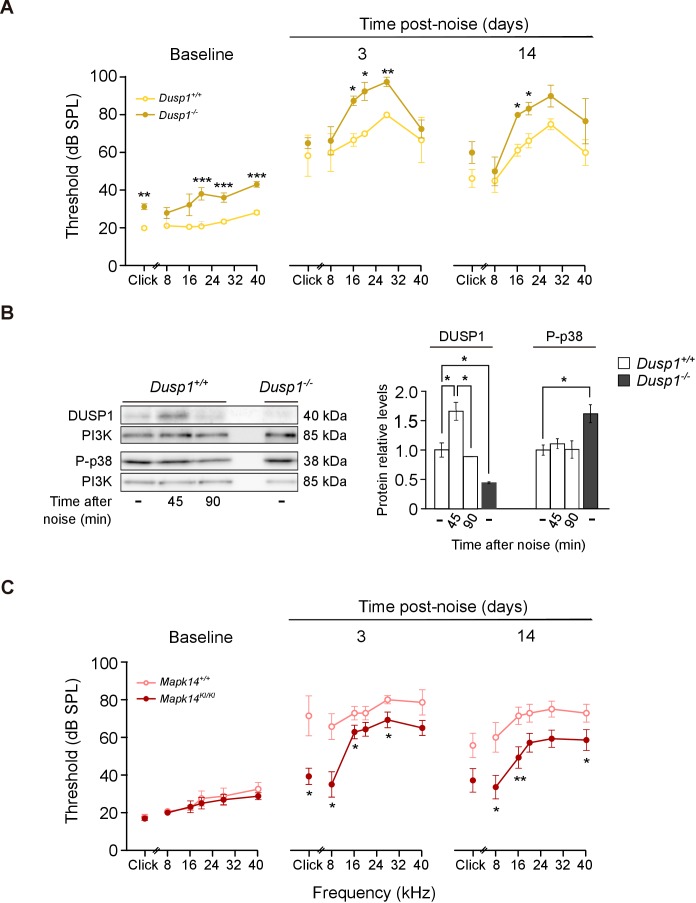
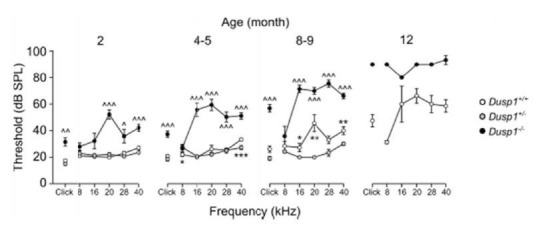
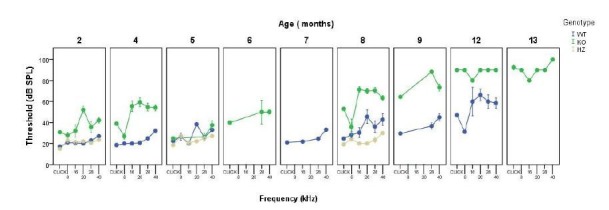
Mitogen-activated protein kinases (MAPK) such as p38 and the c-Jun N-terminal kinases (JNKs) are activated during the cellular response to stress signals. Their activity is regulated by the MAPK-phosphatase 1 (DUSP1), a key component of the anti-inflammatory response. Stress kinases are well-described elements of the response to otic injury and the otoprotective potential of JNK inhibitors is being tested in clinical trials. By contrast, there are no studies exploring the role of DUSP1 in hearing and hearing loss. Here we show that Dusp1 expression is age-regulated in the mouse cochlea. Dusp1 gene knock-out caused premature progressive hearing loss, as confirmed by auditory evoked responses in Dusp1-/- mice. Hearing loss correlated with cell death in hair cells, degeneration of spiral neurons and increased macrophage infiltration. Dusp1-/- mouse cochleae showed imbalanced redox status and dysregulated expression of cytokines. These data suggest that DUSP1 is essential for cochlear homeostasis in the response to stress during ageing.

Keywords: apoptosis; cochlea; dual phosphatases; human biology; inflammation; medicine; mouse; neuroscience; oxidative stress; sensorineural hearing loss.


Conflict of interest statement

AC, IS, JB, LR, LP, RP, SM, IV No competing interests declared

Figures

Figure 1.
Figure 1.. Expression of Dusp1 and related phosphatases in the mouse cochlea.
(A) Cochlear gene expression of Dusp1 in MF1 × 129 Sv mice from embryonic (E) to adult stages (measured in days (d) and months (m)). Expression levels were measured by RT-qPCR and calculated as 2–ΔΔCt (RQ), using Hprt1 as the reference gene and normalized to data from 1–2 month-old mice. Values are presented as mean ± SEM of triplicates from pool samples of three mice per condition. Statistically significant differences were analyzed by Student’s t-test, ***p<0.001. (B) Cochlear gene expression of inducible nuclear MKPs in the cochlea of 2-month-old Dusp1+/+ (light yellow) and Dusp1–/ mice (dark yellow). Expression levels were calculated as 2–ΔΔCt (RQ), using Rplp0 as the reference gene and normalized to 2-month-old wildtype Dusp1 expression. Data are presented as mean ± SEM of triplicates from pool samples of three mice per condition. Statistically significant differences were analyzed by the Student’s t-test (**p<0.01 and ***p<0.001). (C) MEFs cells from Dusp1+/+ or Dusp1–/mice were treated or not with 20 J/cm2 UVC light and harvested 30 min after stimuation. 20 μg of whole cell extracs (WCE) were resolved in SDS-PAGE and DUSP1 expression was detected using a specific antibody. Tubulin was used as a loading control.
Figure 1—figure supplement 1.
Figure 1—figure supplement 1.. Expression of MAP kinase and MAP kinase phosphatases in the mouse cochlea.
(A-C) Cochlear expression of MKPs genes from the first (A), second (B) and third (C) classes in Dusp1+/+ (lighter color bars) and Dusp1–/ mice (darker color bars) of 2, 4–5 and 8–9 months of age. (D) Cochlear expression of MAP kinase genes in Dusp1+/+ and Dusp1–/ mice at 2, 4–5 and 8–9 months of age. Expression levels were calculated as 2–ΔΔCt (RQ), using Rplp0 as the reference gene and normalized to the 2-month-old wildtype mice group. Values are presented as mean ± SEM of triplicates from pool samples of three mice per condition. Statistically significant differences were analyzed by Student’s t-test between genotypes (*p<0.05, **p<0.01, ***p<0.001).
Figure 2.
Figure 2.. Comparative longitudinal hearing evaluation of Dusp1+/+ and Dusp1–/ mice.
(A) Representative ABR recordings showing the typical I–V waves obtained in response to click stimuli from Dusp1+/+ and Dusp1–/ mice of 2, 4–5, 8–9 and 12 months of age, showing the hearing thresholds (colored bold lines). (B) Evolution of ABR thresholds (mean ± SEM) in response to click and tone burst stimuli in Dusp1+/+ (lighter color lines) and Dusp1–/ (darker color lines) mice of 2 (Dusp1+/+, n = 26; Dusp1–/, n = 25), 4–5 (Dusp1+/+, n = 25; Dusp1–/, n = 24), 8–9 (Dusp1+/+, n = 24; Dusp1–/, n = 22) and 12 months of age (Dusp1+/+, n = 7; Dusp1–/, n = 3). (C) Input–output function of wave I latency, the mean latency (± SEM) of ABR peak one is plotted against sound intensity (dB SPL) for mice of 4–5 (Dusp1+/+, n = 25; Dusp1–/, n = 24) and of 8–9 months of age (Dusp1+/+, n = 22; Dusp1–/, n = 21). (D) Interpeak latency (mean ± SEM) between peaks I–II, II–IV and I–IV obtained at 80 dB SPL click stimulation in mice of 4–5 (Dusp1+/+, n = 25; Dusp1-–/, n = 24) and 8–9 months of age (Dusp1+/+, n = 21; Dusp1–/, n = 21). Statistically significant differences were analyzed by Student’s t-test comparing genotypes (*p<0.05, **p<0.01, ***p<0.001).
Figure 2—figure supplement 1.
Figure 2—figure supplement 1.. ABR latencies and amplitudes of Dusp1+/+ and Dusp1–/ mice.
(A) Input–output function of wave I latency, the mean latency (± SEM) of ABR peak one is plotted against sound intensity (dB SPL) for mice of 2 months of age (Dusp1+/+, n = 23; Dusp1–/–, n = 24). (B) Interpeak latency (mean ± SEM) between peaks I–II, II–IV and I–IV obtained at 80 dB SPL click stimulation in mice of 2 months of age (Dusp1+/+, n = 23; Dusp1–/, n = 24). (C) Input–output function of wave I and IV amplitude, the mean amplitude (± SEM) of ABR peaks I and IV is plotted against sound intensity (dB SPL) for mice of 2 (Dusp1+/+, n = 22; Dusp1–/, n = 24) and 4–5 months of age (Dusp1+/+, n = 25; Dusp1–/, n = 24). Statistically significant differences were analyzed by Student’s t-test comparing genotypes (*p<0.05, **p<0.01, ***p<0.001).
Figure 3.
Figure 3.. Comparative cochlear cytoarchitecture of Dusp1+/+ and Dusp1–/ mice.
(A) Representative microphotographs of hematoxylin-eosin-stained paraffin cochlear mid-modiolar sections of Dusp1+/+ and Dusp1–/ mice, showing the spiral ganglion and the organ of Corti from the middle and basal turns of the cochlea at 4–5 (n = 5 per genotype) and 8–9 months of age (n = 5 per genotype). Insets present representative microphotographs of myelin protein p0 immunohistochemistry from the middle and basal turns of the cochlea at 4–5 (n = 3 per genotype) and 8–9 months of age (n = 3 per genotype). Asterisks and arrowheads indicate the absence of neural and hair cells, respectively. Scale bars: 25 µm. IHC, inner hair cell; OHC, outer hair cell. (B) Cochlear gene expression of Mpz, NeuN, Sox2 and Prestin in Dusp1+/+ (lighter color bars) and Dusp1–/ mice (darker color bars) at 2, 4–5 and 8–9 months of age. Expression levels were measured by RT-qPCR and calculated as 2–ΔΔCt (RQ), using Rplp0 as reference the gene and normalized to the 2-month-old wildtype mice group. Values are presented as mean ± SEM of triplicates from pool samples of three mice per condition. Statistically significant differences were analyzed by Student’s t-tests comparing genotypes (**p<0.01 and ***p<0.001). (C) TUNEL apoptosis detection. Representative confocal maximal projection microphotographs show the spiral ganglion of the middle and basal turns of 4–5 month-old Dusp1+/+ (light green bars, n = 4) and Dusp1–/ (dark light bars, n = 3) mice. Arrowheads indicate positive TUNEL cells. Quantification of positive TUNEL cells is shown as the percentage of total DAPI-positive cells in a region of interest (ROI) in the spiral ganglion. Values are presented as mean ± SEM. Statistically significant differences were analyzed by Student’s t-tests comparing genotypes (*p<0.05). Scale bar: 25 µm.
Figure 3—figure supplement 1.
Figure 3—figure supplement 1.. Middle and inner ear morphology of Dusp1+/+ and Dusp1–/ mice.
(A–D) Representative images taken after soft tissue cleaning of 2-month-old Dusp1+/+ (n = 4) and Dusp1–/– mice (n = 4). Lateral (A), medial (B), rostral (C) and caudal (D) views. Co, cochlea; Lsc, lateral semicircular canal; Ow, oval window; Pscl, posterior semicircular canal; Rw, round window; Ssc, superior semicircular canal . (E–F) Representative images of the middle ear ossicles of Dusp1+/+ (n = 4) (E) and Dusp1–/ (n = 4) (F) mice. Malleus (left), incus (center) and stapes (right) at 2 months of age. Scale bars: (A–D), 1 mm,;(E–F), 500 μm.
Figure 3—figure supplement 2.
Figure 3—figure supplement 2.. Comparative cochlear cytoarchitecture of 2-month-old Dusp1+/+ and Dusp1–/ mice.
Representative microphotographs of hematoxylin-eosin-stained paraffin cochlear mid-modiolar sections of Dusp1+/+ and Dusp1–/ mice showing the spiral ganglion, the organ of Corti and the lateral wall from the middle and basal turns of the cochlea at 2 months of age (n = 3 per genotype). Scale bars: 25 µm. IHC, inner hair cell; OHC, outer hair cell.
Figure 4.
Figure 4.. Organ of Corti degeneration in Dusp1–/ mice.
(A) Representative confocal maximal projection images of the organ of Corti of the middle and basal turns of 5-month-old Dusp1+/+ (n = 4) and Dusp1–/ (n = 4) mice immunolabeled for hair cells MyoVIIA (green), neurofilament (red) and phalloidin (purple). Asterisks and arrowheads indicate the absence or presence, respectively, of hair cells and fibers. Scale bar: 10 µm. IHC, inner hair cell; OHC, outer hair cell; SB, spiral bundle; TC, tunnel of Corti. (B) Quantification in the middle (35–45% distance from apex) and basal cochlear turns (60–70% distance from apex) of 5-month-old Dusp1+/+ (light green bars) and Dusp1–/ (dark green bars) mice of the number of outer (base, n = 3 per genotype; middle, n = 4 per genotype) and inner hair cells (base, n = 4 per genotype; middle n = 4, per genotype). Values are presented as mean ± SEM. (C) DPOAE thresholds (mean ± SEM) of Dusp1+/+ (light color lines) and Dusp / (dark color lines) mice of 4–5 months of age (8 kHz: Dusp1+/+, n = 5, Dusp1–/, n = 8; 10 kHz: Dusp1+/+ n = 4, Dusp1–/, n = 8; 14 kHz: Dusp1+/+ n = 4, Dusp1–/ n = 7) and 8–9 months of age (8 kHz: Dusp1+/+n = 5, Dusp1–/, n = 5; 10 kHz: Dusp1+/+ n = 4, Dusp1–/– n = 5; 14 kHz: Dusp1+/+ n = 4, Dusp1–/– n = 4). (D) DPOAE amplitude I/O function (mean ± SEM) evoked by stimulus (f2 = 10.9 kHz or f2 = 15.2 kHz) of Dusp1+/+ (lighter color lines) and Dusp1–/– (darker color lines) for mice of 4–5 and 8–9 months of age (at least three mice per genotype). Statistically significant differences were analyzed by Student’s t-tests comparing genotypes (*p<0.05, **p<0.01, ***p<0.001).
Figure 5.
Figure 5.. Cochlear oxidative stress status of Dusp1+/+ and Dusp1–/– mice.
(A) Cochlear expression of redox regulation and apoptosis genes in Dusp1+/+ (lighter color bars) and Dusp1–/ mice (darker color bars) of 2, 4–5 and 8–9 months of age. Expression levels were measured by RT-qPCR and calculated as 2–ΔΔCt (RQ), using Rplp0 as the reference gene and normalized to data from the 2-month-old wildtype mice group. Values are presented as mean ± SEM of triplicates from pool samples of three mice per condition. (B) Cochlear protein relative levels were measured by western blotting. Representative blots and quantification of levels are shown for γ-H2AX, P22phox, MnSOD, BAXβ, P-p38, P-JNK and P-ERK1/2 cochlear protein extracts from 5-month-old Dusp1+/+ (light green bars) and Dusp1–/ mice (dark green bars). Expression levels were calculated as a ratio using PI3K as housekeeping protein and normalized to the wildtype mice group. Values are presented as mean ± SEM of triplicates from pool samples of three mice per condition. Statistically significant differences were analyzed by Student’s t-tests comparing genotypes (*p<0.05, **p<0.01, ***p<0.001).
Figure 5—figure supplement 1.
Figure 5—figure supplement 1.. 3-Nitrotyrosine ( 3-NT) immunohistochemistry.
(A) Representative microphotographs of 3-NT levels detected by immunohistochemistry in the spiral ganglion of 2-month-old Dusp1+/+ and Dusp1–/(n = 3 per genotype). (B) Quantification of the 3-NT signal was measured in the spiral ganglion of the middle and basal cochlear turns of 2-month-old Dusp1+/+ (light bars) and Dusp1–/ mice (dark bars) (n = 3 per genotype). Values are presented as mean ± SEM. Data points are also represented to show individual variability.
Figure 5—figure supplement 2.
Figure 5—figure supplement 2.. Production of reactive oxygen species and DNA damage in MEF cells.
(A) Dusp1+/+ (white) and Dusp1–/ (gray) MEF cells were treated with H2O2 (200 µM) for 30 min. The results for non-treated control cells are also shown for comparison (NT). After harvesting the cells, the emission of dihydroethidium (DHE) was analyzed by flow cytometry. (B) Detection of DNA damage in MEFs cells. DNA damage was determined by immunocytochemistry with a γ-H2A.X antibody and the staining of nuclei with DAPI. Quantification of γ-H2A.X foci per cell is described in 'Materials and methods'. In each case, more than 200 cells were analyzed. Statistically significant differences were analyzed by two-way ANOVA (*p<0.05 and **p<0.01).
Figure 6.
Figure 6.. Exacerbated inflammatory response in Dusp1–/– mice.
(A) Cochlear expression of inflammatory response genes in Dusp1+/+ (lighter color bars) and Dusp1–/– mice (darker color bars) of 2, 4–5 and 8–9 months of age. Expression levels were calculated as 2–ΔΔCt (RQ), using Rplp0 as the reference gene and normalized to the 2-month-old wildtype mice group. Il10 data were normalized to the matched-age wildtype mice groups. Values are presented as mean ± SEM of triplicates from pool samples of three mice per condition. (B) Representative microphotographs of cochlear mid-modiolar cryosections immunolabeled for IBA1, showing a detail of the spiral ligament of the apical, middle and basal turns of 5-month-old Dusp1+/+ (n = 3) and Dusp1–/– mice of 5 (n = 3) and 8 months of age (n = 3). The Type IV fibrocytes region is outlined. Arrowheads point to macrophage cells. Scale: 50 µm. (C) IBA1 total fluorescence intensity was measured in the spiral ligament in each cochlear turn of 5-month-old Dusp1+/+ (light green bars; base, n = 4; middle, n = 5; apical, n = 4) and Dusp1–/– mice of 5 months (dark green bars, base, n = 4; middle, n = 6; apical, n = 5) and 8 months of age (dark blue bars, base, n = 4; middle, n = 3; apical, n = 3). Values are presented as mean ± SEM. Statistically significant differences were detected by Student’s t-test comparing genotypes (*p<0.05, **p<0.01, ***p<0.001).
Figure 6—figure supplement 1.
Figure 6—figure supplement 1.. TNF-α induces caspase 3 activation in Dusp1–/– MEF cells.
(A) MEFs cells from Dusp1+/+ or Dusp1–/– were treated or not with TNFα (10 ng/ml) and harvested 30 min, 1 hr, 2 hr and 4 hr after application of a stimulus. 20 μg of WCE were resolved in SDS-PAGE, and DUSP1, P-p38, p38 and Cleaved Caspase 3 fragment levels were measured using specific antibodies. β-actin and PI3K were used as a loading controls. (B) Quantification of protein levels are shown for Dusp1+/+ (white bars) and Dusp1–/– MEFs (grey bars) (n = 1).
Figure 7.
Figure 7.. Hearing loss following noise-exposure of Dusp1 and Mkp14 null mice.
(A) ABR thresholds (mean ± SEM) in response to click and tone burst stimuli before noise exposure (baseline) and 3 and 14 days post-noise (VSS, 107 dB, 30 min) exposure in Dusp1+/+ and Dusp1–/– mice (n = 4 per genotype). (B) Representative blots and quantification of levels are shown for DUSP1 and P-p38 cochlear protein extracts from Dusp1+/+ and Dusp1–/– mice and wildtype mice, 45 and 90 min after noise exposure. Expression levels were calculated as a ratio using PI3K as the loading control. Values are presented as mean ± SEM of triplicates from pool samples of three mice per condition. (C) Evolution of ABR thresholds (mean ± SEM) in response to click and tone burst stimuli before (baseline) and 3 and 14 days post-noise exposure in Mkp14+/+ and Mpk14KI/KI mice (n = 7 per genotype). Statistically significant differences were analyzed by Kruskal–Wallis tests comparing genotypes (*p<0.05, **p<0.01, ***p<0.001).
Author response image 1.
Author response image 1.. Comparative longitudinal hearing evaluation of Dusp1+/+, Dusp1+/-and Dusp1-/-mice.
Evolution of ABR thresholds (mean ± SEM) in response to click and tone bursts stimuli in Dusp1+/+(white circles), Dusp1+/-(grey circles) and Dusp1-/-(black circles) mice of 2 (Dusp1+/+, n=10; Dusp1+/-, n=7; Dusp1-/-, n=7), 4-5 (Dusp1+/+, n=28; Dusp1+/-, n=7; Dusp1-/-, n=24), 8-9 months of age (Dusp1++/+, n=24; Dusp1+/-, n=6; Dusp1-/-, n=22) and 12 months of age (Dusp1+/+, n=7; Dusp1+/-, n=3). Statistically significant differences were analysed by Student’s t-test comparing genotypes, * Dusp1+/-vs. Dusp1+/+; ^ Dusp1+/-vs. Dusp1-/- (*,^p<0.05, **,^^p<0.01, ***,^^^p<0.001).
Author response image 2.
Author response image 2.. Monthly evolution of auditory thresholds.

References

    1. Alagramam KN, Stepanyan R, Jamesdaniel S, Chen DH, Davis RR. Noise exposure immediately activates cochlear mitogen-activated protein kinase signaling. Noise and Health. 2014;16:400–409. doi: 10.4103/1463-1741.144418. - DOI - PMC - PubMed
    1. Anttonen T, Belevich I, Kirjavainen A, Laos M, Brakebusch C, Jokitalo E, Pirvola U. How to bury the dead: elimination of apoptotic hair cells from the hearing organ of the mouse. Journal of the Association for Research in Otolaryngology. 2014;15:975–992. doi: 10.1007/s10162-014-0480-x. - DOI - PMC - PubMed
    1. Balaban RS, Nemoto S, Finkel T. Mitochondria, oxidants, and aging. Cell. 2005;120:483–495. doi: 10.1016/j.cell.2005.02.001. - DOI - PubMed
    1. Bánfi B, Malgrange B, Knisz J, Steger K, Dubois-Dauphin M, Krause K-H. NOX3, a Superoxide-generating NADPH Oxidase of the Inner Ear. Journal of Biological Chemistry. 2004;279:46065–46072. doi: 10.1074/jbc.M403046200. - DOI - PubMed
    1. Bared A, Ouyang X, Angeli S, Du LL, Hoang K, Yan D, Liu XZ. Antioxidant enzymes, presbycusis, and ethnic variability. Otolaryngology–Head and Neck Surgery. 2010;143:263–268. doi: 10.1016/j.otohns.2010.03.024. - DOI - PMC - PubMed

Publication types

LinkOut - more resources