. 2019 Jun;33(6):7126-7142.
doi: 10.1096/fj.201801526RR. Epub 2019 Apr 2.

Fructose malabsorption induces cholecystokinin expression in the ileum and cecum by changing microbiota composition and metabolism

Affiliations

Fructose malabsorption induces cholecystokinin expression in the ileum and cecum by changing microbiota composition and metabolism

Xufei Zhang et al. FASEB J. 2019 Jun.

Abstract

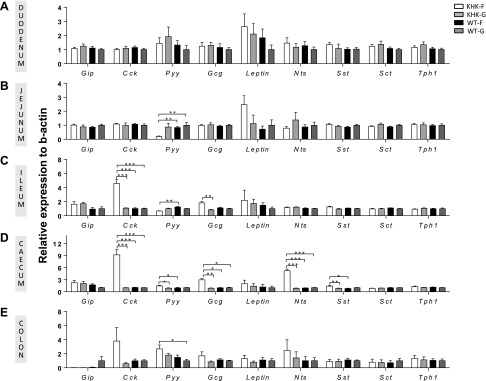
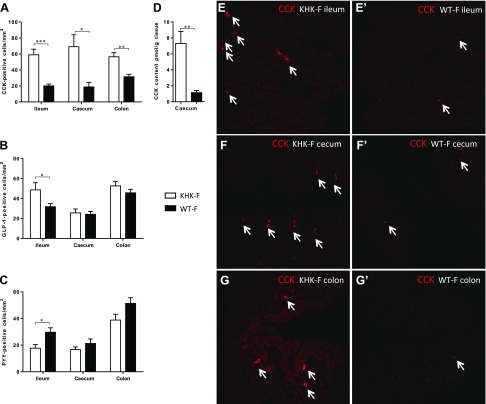
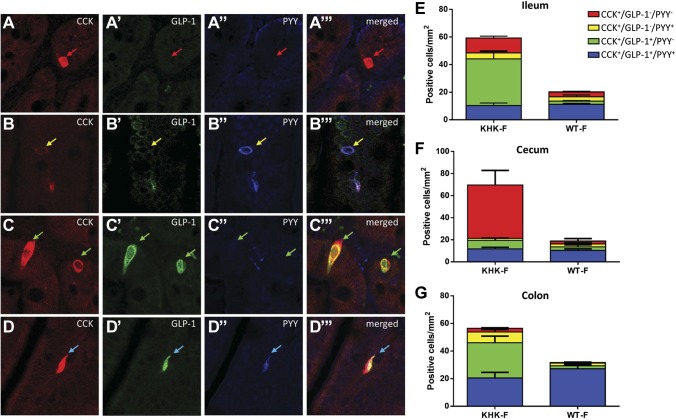
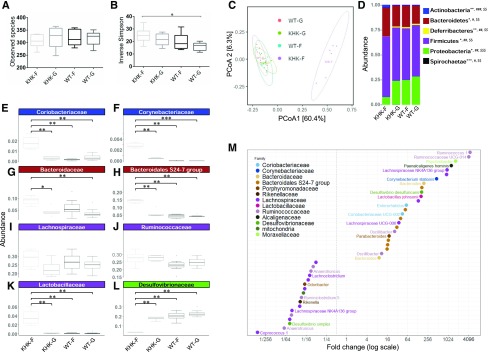
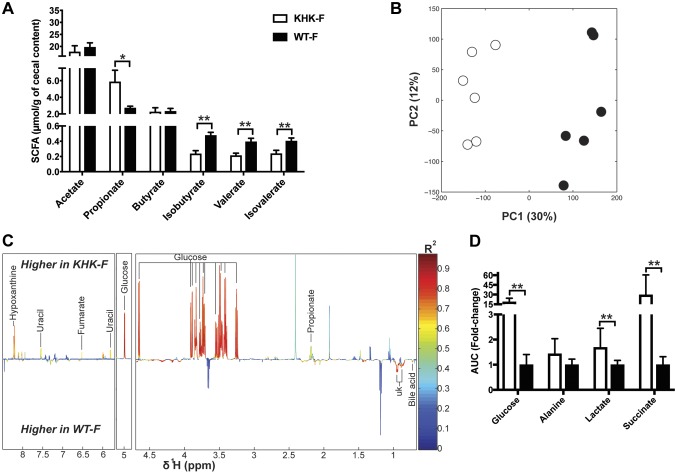
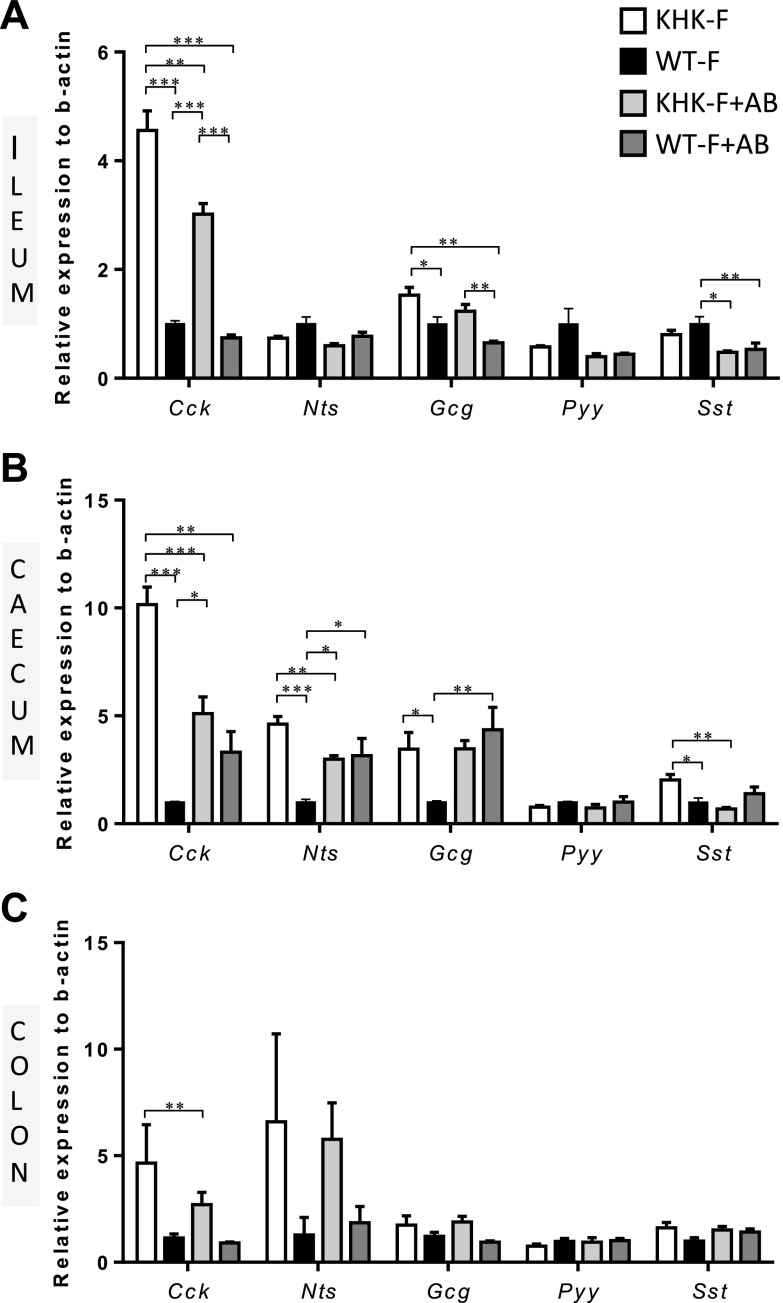
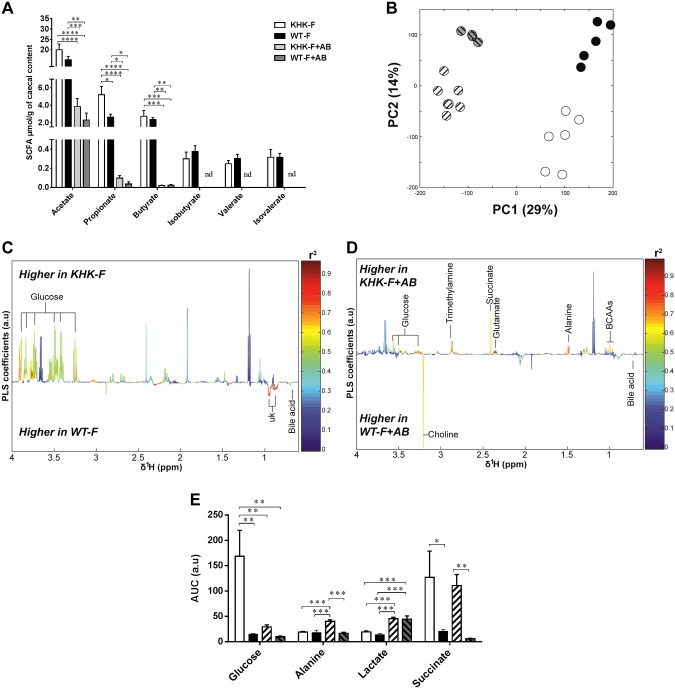
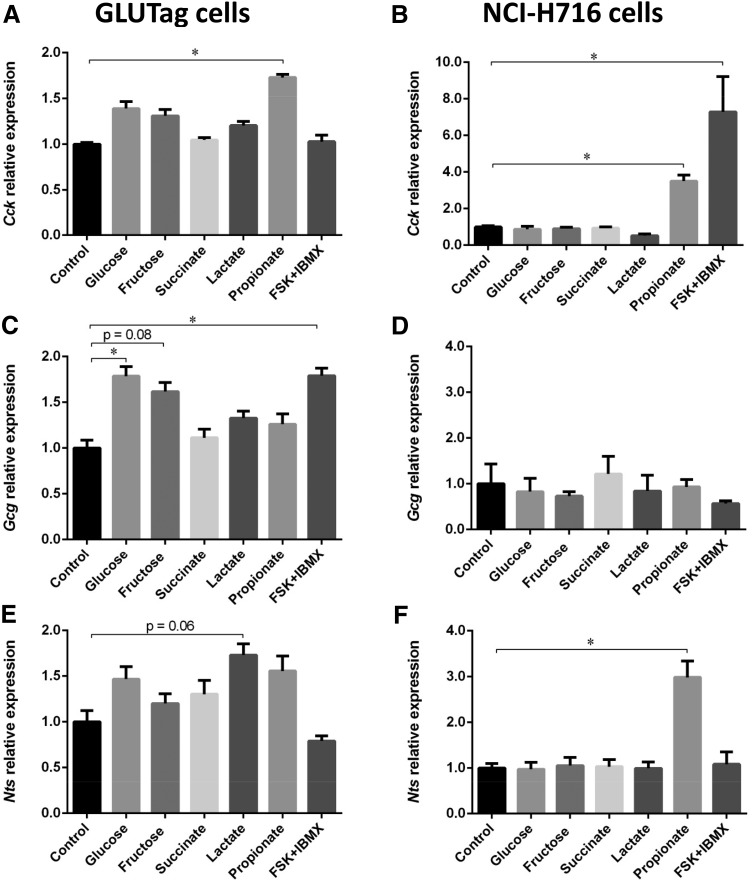
Current fructose consumption levels often overwhelm the intestinal capacity to absorb fructose. We investigated the impact of fructose malabsorption on intestinal endocrine function and addressed the role of the microbiota in this process. To answer this question, a mouse model of moderate fructose malabsorption [ketohexokinase mutant (KHK)-/-] and wild-type (WT) littermate mice were used and received a 20%-fructose (KHK-F and WT-F) or 20%-glucose diet. Cholecystokinin (Cck) mRNA and protein expression in the ileum and cecum, as well as preproglucagon (Gcg) and neurotensin (Nts) mRNA expression in the cecum, increased in KHK-F mice. In KHK-F mice, triple-label immunohistochemistry showed major up-regulation of CCK in enteroendocrine cells (EECs) that were glucagon-like peptide-1 (GLP-1)+/Peptide YY (PYY-) in the ileum and colon and GLP-1-/PYY- in the cecum. The cecal microbiota composition was drastically modified in the KHK-F in association with an increase in glucose, propionate, succinate, and lactate concentrations. Antibiotic treatment abolished fructose malabsorption-dependent induction of cecal Cck mRNA expression and, in mouse GLUTag and human NCI-H716 cells, Cck mRNA expression levels increased in response to propionate, both suggesting a microbiota-dependent process. Fructose reaching the lower intestine can modify the composition and metabolism of the microbiota, thereby stimulating the production of CCK from the EECs possibly in response to propionate.-Zhang, X., Grosfeld, A., Williams, E., Vasiliauskas, D., Barretto, S., Smith, L., Mariadassou, M., Philippe, C., Devime, F., Melchior, C., Gourcerol, G., Dourmap, N., Lapaque, N., Larraufie, P., Blottière, H. M., Herberden, C., Gerard, P., Rehfeld, J. F., Ferraris, R. P., Fritton, J. C., Ellero-Simatos, S., Douard, V. Fructose malabsorption induces cholecystokinin expression in the ileum and cecum by changing microbiota composition and metabolism.

Keywords: CCK; KHK; propionate.


Conflict of interest statement

The authors thank J. P. Furet (Micalis Institute, INRA, Jouy-en-Josas, France), F. Rouyer (Paris-Saclay Institute of Neuroscience, Université Paris Sud, CNRS, Université Paris–Saclay, Gif-sur-Yvette, France), and S. P. Shirazi-Beechey (Institute of Integrative Biology, University of Liverpool, United Kingdom) for sharing reagents and equipment. The authors are grateful to the INRA Migale bioinformatics platform (http://migale.jouy.inra.fr/) for providing computational resources, the Genotoul high-throughput sequencing platform (http://bioinfo.genotoul.fr/), and the histology facility of UMR 1313 Génétique Animale et Biologie Intégrative (GABI). This work was supported by grants from Institut Benjamin Delessert and by INRA. The China Scholarship Council (CSC) and INRA funded PhD fellowships to X.Z. The authors declare no conflicts of interest.

Figures

Figure 1
Figure 1
KHK−/− and WT mice were fed 20% fructose (KHK-F or WT-F) or 20% glucose diet (KHK-G or WT-G) for 8 wk. The mRNA expression levels of the main entero-hormones were measured in KHK-F, KHK-G, WT-F, and WT-G mice in the duodenum (A), the jejunum (B), the ileum, (C), the cecum (D), and the proximal colon (E). The relative values were normalized to WT-G levels (n = 6–8/group). All values are means ± sem. Means were compared by 1-way ANOVA followed by Tukey’s post hoc test. *P < 0.05, **P < 0.01, ***P < 0.001.
Figure 2
Figure 2
KHK−/− and WT mice were fed 20% fructose (KHK-F and WT-F, respectively) for 8 wk. AC) Distribution of CCK- (A), GLP-1- (B), and PYY-positive EECs (C) per section area (square millimeters) of mucosa in the ileum, cecum, and colon of KHK-F and WT-F. D) CCK peptide content in cecum tissue of KHK-F and WT-F. EG′) Representative immunofluorescence staining of CCK-positive cells (red) in ileum (E, E′), cecum (F, F′), and colon (G, G′) of KHK-F (E, F, G) and WT-F (E′, F′, G′) mice (n = 5–6/group). Original magnification value, ×158. All values are means ± sem. Means were compared with Student’s t test. *P < 0.05, **P < 0.01, ***P < 0.001.
Figure 3
Figure 3
KHK−/− and WT mice were fed 20% fructose (KHK-F or WT-F) for 8 wk. AD‴) Representative triple-immunofluorescence staining of CCK (red), GLP-1 (green), and PYY (blue) in the ileum of KHK-F mice. Each set of panels (e.g., AA‴) shows the same field of view with CCK, GLP-1, and PYY channels separately and a merged image. Red arrows show EECs in which CCK only is expressed (CCK+/GLP-1/PYY), yellow arrows show EECs in which CCK and PYY are both expressed (CCK+/GLP-1/PYY+), green arrows show EECs in which CCK and GLP-1 are both expressed (CCK+/GLP-1+/PYY), and blue arrows show EECs in which CCK, GLP-1, and PYY (CCK+/GLP-1+/PYY+) are expressed. EG) Quantification of the density of the different populations of CCK+ cells in the ileum (E), cecum (F), and colon (G) of KHK-F and WT-F (n = 5–6/group). All values are means ± sem. The counts and statistics are presented in Supplemental Table S3.
Figure 4
Figure 4
Microbiota composition of the cecum content collected from KHK−/− or WT mice fed 20% fructose (KHK-F or WT-F) or 20% glucose (KHK-G or WT-G) diet for 8 wk (n = 6–8/group). Analysis was based on 16S rDNA sequencing (region V3-V4). A, B) Observed species richness (A) and inverse Simpson index (B) as indicators of α-diversity. C) Principal coordinates analysis (PCoA) of Bray-Curtis compositional dissimilarity at the OTU level. D) Mean relative abundance at phylum level in cecum content of each group. EL) The most abundant families from Actinobacteria (E, F), Bacteroidetes (G, H), Firmicutes (IK), and Proteobacteria (L) phyla. M) Graphic representation of differentially abundant OTUs between KHK-F and WT-F having a large (FC >8 or FC <1/8) and significant (P < 0.001) effect size in addition to high relative abundances (>0.1% in at least half the samples). Each OTU is represented by a dot and colored according to its taxonomic classification at the family level. Taxonomy at the genus or species level is also indicated, when available, next to each OTU. A logarithmic scale (log-2) was used for the x axis. Observed species richness and inverse Simpson index values are means ± sem. Means were compared by 1-way ANOVA followed by Tukey’s post hoc test. *P < 0.05. For D, the mean of each group is represented along the x axis and the y axis refers to relative normalized abundances. Phylum relative abundance data were compared using Kruskal-Wallis test. *P < 0.05, **P < 0.01, ***P < 0.001 indicating significantly different phyla abundances between KHK-F and KHK-G, #P < 0.05, ##P < 0.01, ###P < 0.001 between KHK-F and WT-F, and $$P < 0.01, $$$P < 0.001 between KHK-F and WT-G (significance adjusted for false-discovery rate of P < 0.05). For EL, the y axis refers to relative normalized abundances, and the lines indicate median and the boxes indicate first and third quartiles. Family abundance data were compared using the Wilcoxon test. *P < 0.05, **P < 0.01 when compared with KHK-F.
Figure 5
Figure 5
Metabolite composition of the cecum content collected from KHK−/− or WT mice fed 20% fructose (KHK-F or WT-F) diet for 8 wk (n = 5–6/group). A) SCFA quantification in cecum content by gas chromatography. B) PCA score plots obtained from 1H-NMR spectra of cecum content extracts of KHK-F or WT-F. C) Plot of O-PLS-DA coefficients related to the discrimination between 1H-NMR spectra from cecum content extracts of WT-F vs. KHK-F. D) Bar graph representation of the relative integral in arbitrary units (a.u) for different metabolites (glucose, lactate, alanine, and succinate) in cecum content. AUC, area under the curve; UK, unknown. All values are means ± sem; means were compared with Student’s t test. *P < 0.05, **P < 0.001.
Figure 6
Figure 6
KHK−/− and WT mice were fed 20% fructose for 3 wk with (KHK-F + AB or WT-F + AB) or without (KHK-F or WT-F) AB treatment (n = 5–7/group). The mRNA expression levels of gut peptides were measured in WT-F, KHK-F, WT-F + AB, and KHK-F + AB mice in the ileum (A), the cecum (B), and the proximal colon (C). Data were normalized to levels in WT-F. All values are means ± sem. Means were compared by 1-way ANOVA followed by Tukey’s post hoc test. *P < 0.05, **P < 0.01, ***P < 0.001.
Figure 7
Figure 7
Metabolite composition of the cecum content collected from KHK−/− or WT mice fed 20% fructose diet for 3 wk with (KHK-F + AB or WT-F + AB) or without (KHK-F or WT-F) AB treatment (n = 5–7/group). A) SCFA quantification in cecum content by gas chromatography. B) PCA score plots obtained from 1H-NMR spectra of cecum content extracts from KHK-F, KHK-F + AB, WT-F, and WT-F + AB. C) Plots of O-PLS-DA coefficients related to the discrimination between 1H-NMR spectra of cecum content extracts from WT-F vs. KHK-F. D) Plots of O-PLS-DA coefficients related to the discrimination between 1H-NMR spectra of cecum content extracts from WT-F + AB vs. KHK-F + AB. E) Bar graph representation of the relative integral for different metabolites (glucose, lactate, alanine, and succinate) in cecum content. AUC, area under the curve. All values are means ± sem. Means were compared by 1-way ANOVA followed by Tukey’s post hoc test. *P < 0.05, **P < 0.01, ***P < 0.001, ****P < 0.0001.
Figure 8
Figure 8
Cck (A, B), Gcg (C, D), and Nts (E, F) mRNA expression in GLUTag and NCI-H716 cells, respectively, incubated for 24 h with 1 mM glucose (control) or 25 mM glucose, 25 mM fructose, 2 mM succinate, 10 mM lactate, 2 mM propionate, or 25 mM glucose + 10 μM forskolin + 10 μM 3-isobutyl-1-methylxanthine (FSK/IBMX) (n = 3/group for GLUTag and n = 4/group for NCI-H716). The relative values were normalized to control levels. All values are means ± sem. Means were compared by Kruskal-Wallis test followed by Dunn’s multiple comparison test. *P < 0.05.

References

    1. Marriott B. P., Cole N., Lee E. (2009) National estimates of dietary fructose intake increased from 1977 to 2004 in the United States. J. Nutr. 139, 1228S–1235S - PubMed
    1. Tappy L., Lê K. A. (2010) Metabolic effects of fructose and the worldwide increase in obesity. Physiol. Rev. 90, 23–46 - PubMed
    1. Jones H. F., Butler R. N., Brooks D. A. (2011) Intestinal fructose transport and malabsorption in humans. Am. J. Physiol. Gastrointest. Liver Physiol. 300, G202–G206 - PubMed
    1. Douard V., Ferraris R. P. (2013) The role of fructose transporters in diseases linked to excessive fructose intake. J. Physiol. 591, 401–414 - PMC - PubMed
    1. Jones H. F., Burt E., Dowling K., Davidson G., Brooks D. A., Butler R. N. (2011) Effect of age on fructose malabsorption in children presenting with gastrointestinal symptoms. J. Pediatr. Gastroenterol. Nutr. 52, 581–584 - PubMed

Publication types

LinkOut - more resources