. 2019 Apr 1;11(4):460.
doi: 10.3390/cancers11040460.

Cx43 Expression Correlates with Breast Cancer Metastasis in MDA-MB-231 Cells In Vitro, In a Mouse Xenograft Model and in Human Breast Cancer Tissues

Affiliations

Cx43 Expression Correlates with Breast Cancer Metastasis in MDA-MB-231 Cells In Vitro, In a Mouse Xenograft Model and in Human Breast Cancer Tissues

Jalal M Kazan et al. Cancers (Basel). .

Abstract

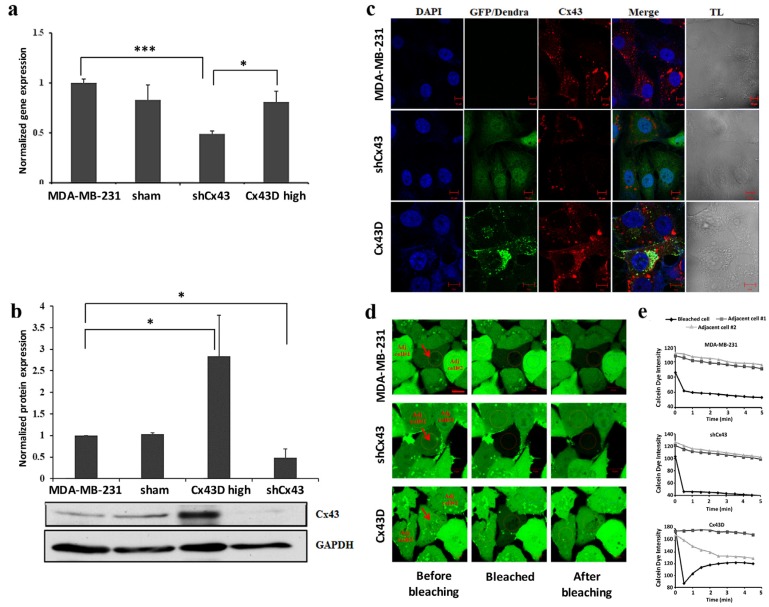
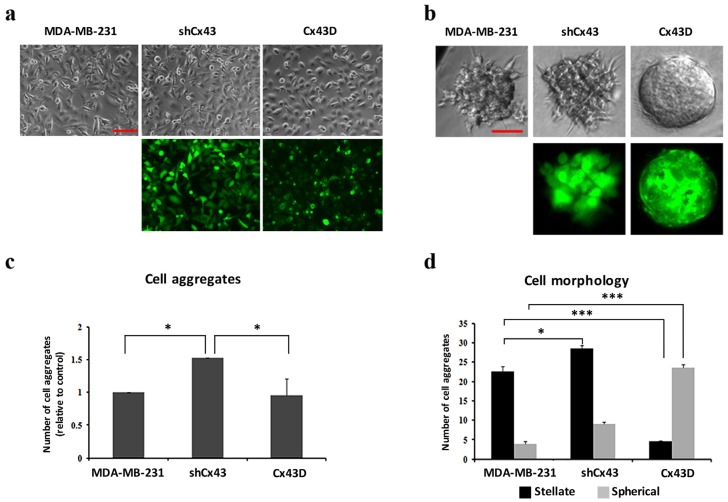
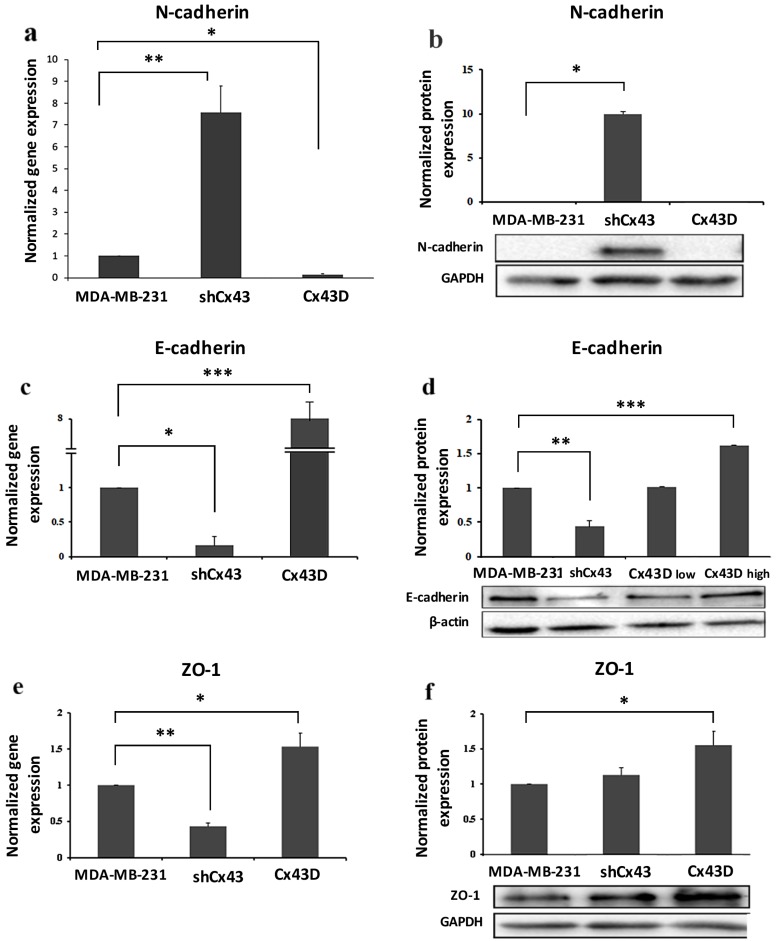
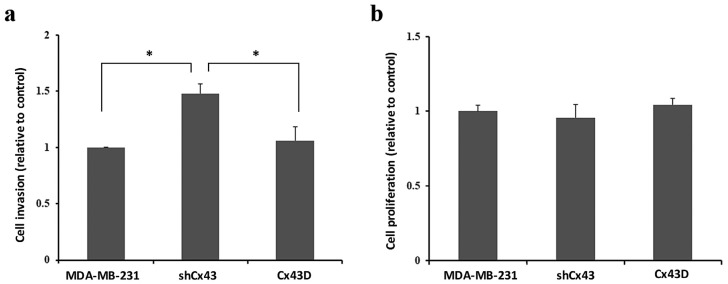
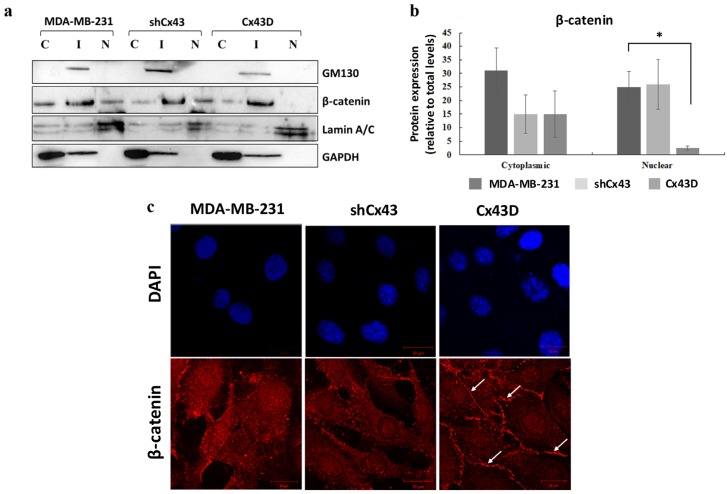
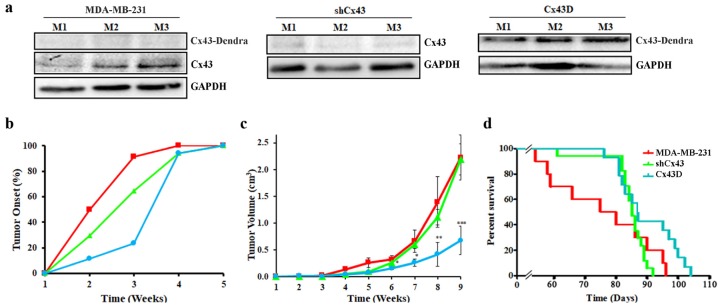
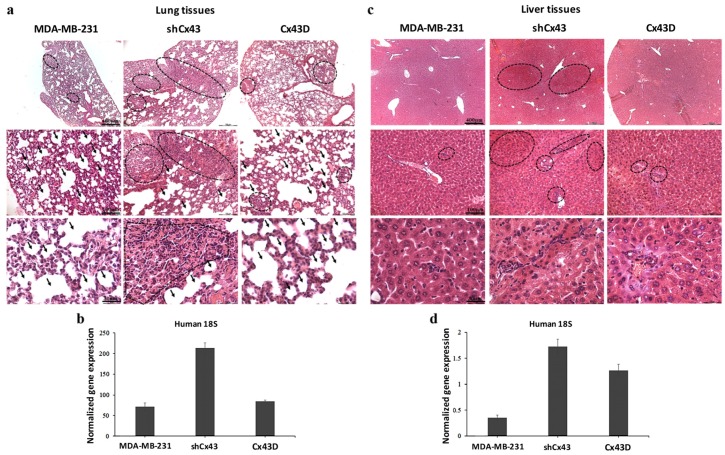
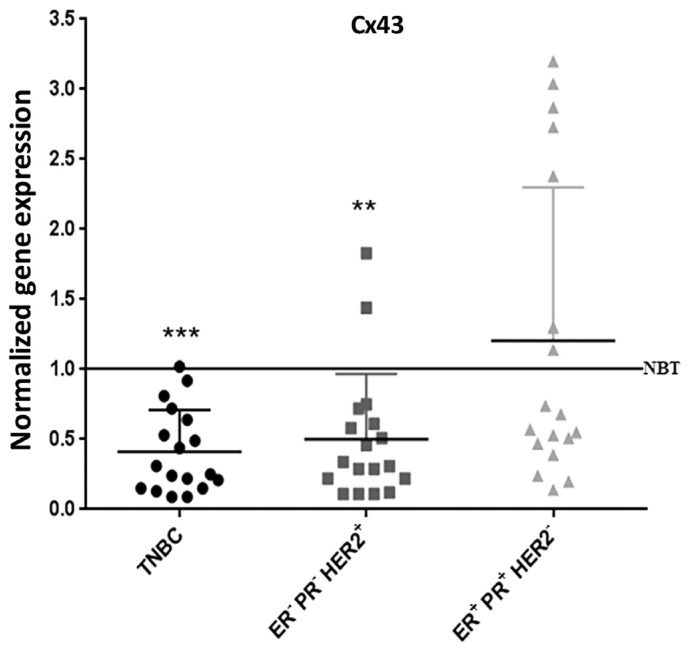
Connexins regulate multiple cellular functions and are considered tumor suppressors. Connexin43 (Cx43) is frequently down-regulated in breast tumors. However, Cx43 regulation during cancer onset and metastasis is complex and context-dependent. We investigated the effect of Cx43 over-expression or knock-down on the metastatic potential of MDA-MB-231 breast cancer cells in vitro and in vivo and in human breast cancer tissues. MDA-MB-231 cells over-expressing (Cx43D) or down-regulating Cx43 (shCx43) were generated and used in proliferation, migration, and invasion assays. The regulation of genes/proteins implicated in progression, invasion and metastasis was assessed in vitro and in immune-compromized mice injected with MDA-MB-231, Cx43D or shCx43 cells. Primary tumor onset/growth, metastasis and overall survival of these animals was monitored and evaluated. In addition, Cx43 expression in human breast carcinoma samples was assessed by qPCR. Cx43 over-expression increased protein levels of epithelial markers E-cadherin and zonula occludens 1 expression and resulted in the sequestration of β-catenin at the cell membrane, while Cx43 knock-down induced protein expression of the mesenchymal marker N-cadherin and an increased invasive potential of shCx43 cells. In vivo, in mice xenografted with breast cancer cells, Cx43 over-expression decreased tumor volume, attenuated cell metastasis to lungs and liver and increased overall mice survival. Importantly, the expression of Cx43 in triple negative human breast cancer tissues is also down-regulated. Collectively, Cx43 over-expression induced an epithelial-like phenotype in MDA-MB-231 cells and suppressed tumor growth and metastasis to secondary organs in vivo. In contrast, Cx43 knock-down in MDA-MB-231 cells induced a mesenchymal phenotype with increased cell invasion leading to an enhanced metastatic phenotype. These data provide evidence for a pivotal role of Cx43 in breast cancer metastasis and support the potential targeting of connexins in breast cancer therapy.

Keywords: EMT; breast cancer; connexin43; epithelial-to-mesenchymal transition; metastasis; triple negative breast cancer.


Conflict of interest statement

The authors declare no competing financial interests.

Figures

Figure 1
Figure 1
Down-regulation or over-expression of Cx43 in MDA-MB-231 cells. (a) Bar graph representing Cx43 mRNA expression in MDA-MB-231, sham cells, shCx43 and Cx43D cells as detected by qPCR and normalized to GAPDH. Results are representative of three independent experiments. (b) Western blot of Cx43 protein expression in MDA-MB-231, sham cells, shCx43 and Cx43D cells with densitometry analysis of two independent experiments, after normalization to GAPDH. (c) Representative immunofluorescence images of Cx43 expression in parental MDA-MB-231, shCx43 and Cx43D cells. DAPI was used as a nuclear stain and transmitted light (TL) microscopy was used to show cell morphology. GFP/Dendra panel represents the green fluorescence of MDA-MB-231 cells transfected/transduced with shCx43/Cx43D vectors, respectively. Scale bar = 10 µm. (d) Representative fluorescence images of FRAP. Red arrows indicate the photobleached cells; ‘Adj. cell#1 and’ ‘Adj. cell#2’ refer to non-photobleached adjacent cells. Scale bar represents 10 µm. (e) Quantification of fluorescence intensity of regions of interest (ROIs) relative to adjacent unbleached cells. Values represent the fluorescence intensity (averages ± SD) of each ROI based on several measurements calculated by the Zeiss Zen 2011 software. A minimum of ten different ROIs per condition were analyzed. Sham cells are the GFP-negative cells obtained after sorting of shCx43 or Cx43D cells. * p < 0.05; *** p < 0.001.
Figure 2
Figure 2
Cx43 upregulation decreases formation of invasive cell aggregates in 3D cultures. (a) and (b) Microscopic images for cells in 2D and 3D culture systems (scale bars of 100 and 50 µm), respectively. Upper panels show bright field images of cells/aggregates and lower panels show fluorescent images of shCx43 cells/aggregates or Cx43D cells/aggregates. (c) Bar graph showing the number of cell aggregates formed after 8 days in culture, normalized to number of cell aggregates formed by parental MDA-MB-231 cells. (d) Bar graph showing the numbers of cell aggregates with stellate versus spherical morphology after 8 days in culture. Results are averages of ten different fields of three independent experiments. * p < 0.05; *** p < 0.001.
Figure 3
Figure 3
Cx43 overexpression decreases the expression of EMT markers. (a,c,e) Bar graph displaying N-cadherin, E-cadherin and ZO-1 mRNA expression levels in MDA-MB-231, shCx43 and Cx43D cells, as detected by qPCR and normalized to GAPDH. Results are representative of two independent experiments. (b,d,f) Western blots of N-cadherin, E-cadherin and ZO-1 protein expression in MDA-MB-231 cells, shCx43 and Cx43D cells, with densitometry analysis after normalization to GAPDH (or β-actin). Panel (d) also displays western blotting data of E-cadherin protein levels in Cx43D (low) and Cx43D (high). Results are representative of two independent experiments. * p < 0.05; ** p < 0.01; *** p < 0.001.
Figure 4
Figure 4
Cx43 knock-down enhances the invasion of MDA-MB-231 cells. (a,b). Bar graph showing the normalized cell index of shCx43 and Cx43D cells, relative to parental MDA-MB-231 cells, as detected by RTCA invasion and proliferation assays, respectively. Cell impedance readings were taken every 15 min for a minimum of 48 h. Results are representative of four independent experiments. * p < 0.05.
Figure 5
Figure 5
Cx43 over-expression sequesters β-catenin at the cell membrane in MDA-MB-231 cells. (a) Western blotting of β-catenin in cellular fractions of MDA-MB-231 cells, shCx43 cells and Cx43D cells. Proteins from the cytosolic (C), intermediate (I) and nuclear (N) fractions were blotted with compartment-specific antibodies, GAPDH, GM130 and Lamin A/C, respectively. (b) Bar graph displaying the densitometry analysis of nuclear versus cytosolic β-catenin expression with respect to total β-catenin protein levels. Two independent experiments were performed and plotted. (c) Representative immunofluorescence images of β-catenin expression in parental MDA-MB-231, shCx43 and Cx43D cells, counterstained with DAPI. Micrographs are representative of at least ten different fields per cell line. Scale bar represents 20 µm. * p < 0.05.
Figure 6
Figure 6
Cx43 over-expression delays tumor onset, decreases tumor volume and increases overall survival. (a) Western blotting of Cx43 in primary tumor tissues from three different mice, 9 weeks post-injection with parental MDA-MB-231, shCx43 or Cx43D cells. (b) Graph showing primary tumor onset over time. Mice were monitored for any palpable tumors at the site of injection. Percentage of mice with first palpable tumor occurrence was plotted against time. (c) Graph displaying tumor volume (in cm3) measured using a Vernier caliper, on a weekly basis throughout the experimental duration. (d) Kaplan-Meier survival curves of mice injected with parental MDA-MB-231, shCx43 or Cx43D cells. Mice were monitored daily until moribund state or death was reached. * p < 0.05; ** p < 0.01; *** p < 0.001.
Figure 7
Figure 7
Down-regulation of Cx43 enhances breast cancer metastasis to the lung and liver. (a,c) H&E staining showing metastatic foci in lung and liver tissues, respectively, at week 9 post-injection of parental MDA-MB-231, shCx43 or Cx43D cells. (b,d) qPCR analysis of human 18S ribosomal RNA levels, in lung and liver tissues of mice bearing MDA-MB-231, shCx43 or Cx43D cells.
Figure 8
Figure 8
Cx43 expression is down-regulated in TNBC patients. qPCR analysis of Cx43 in TNBC, ER PR HER2+ and ER+ PR+ HER2 subtypes of human breast cancer, after normalization to GAPDH. Results are plotted as fold change normalized to the expression level of Cx43 mRNA in normal breast tissues (NBT). ** p < 0.01; *** p < 0.001.

References

    1. Alby L., Auerbach R. Differential adhesion of tumor cells to capillary endothelial cells in vitro. Proc. Natl. Acad. Sci. USA. 1984;81:5739–5743. doi: 10.1073/pnas.81.18.5739. - DOI - PMC - PubMed
    1. Nicolson G.L. Cancer metastasis: Tumor cell and host organ properties important in metastasis to specific secondary sites. Biochim. Biophys. Acta. 1988;948:175–224. doi: 10.1016/0304-419X(88)90010-8. - DOI - PubMed
    1. Pauli B.U., Lee C.L. Organ preference of metastasis. The role of organ-specifically modulated endothelial cells. Lab. Investig. J. Tech. Methods Pathol. 1988;58:379–387. - PubMed
    1. Iozzo R.V. Neoplastic modulation of extracellular matrix. Colon carcinoma cells release polypeptides that alter proteoglycan metabolism in colon fibroblasts. J. Biol. Chem. 1985;260:7464–7473. - PubMed
    1. Liotta L.A., Saidel M.G., Kleinerman J. The significance of hematogenous tumor cell clumps in the metastatic process. Cancer Res. 1976;36:889–894. - PubMed