. 2019 Apr 1;20(7):1618.
doi: 10.3390/ijms20071618.

Rosiglitazone Enhances Browning Adipocytes in Association with MAPK and PI3-K Pathways During the Differentiation of Telomerase-Transformed Mesenchymal Stromal Cells into Adipocytes

Affiliations

Rosiglitazone Enhances Browning Adipocytes in Association with MAPK and PI3-K Pathways During the Differentiation of Telomerase-Transformed Mesenchymal Stromal Cells into Adipocytes

Abeer Maher Fayyad et al. Int J Mol Sci. .

Abstract

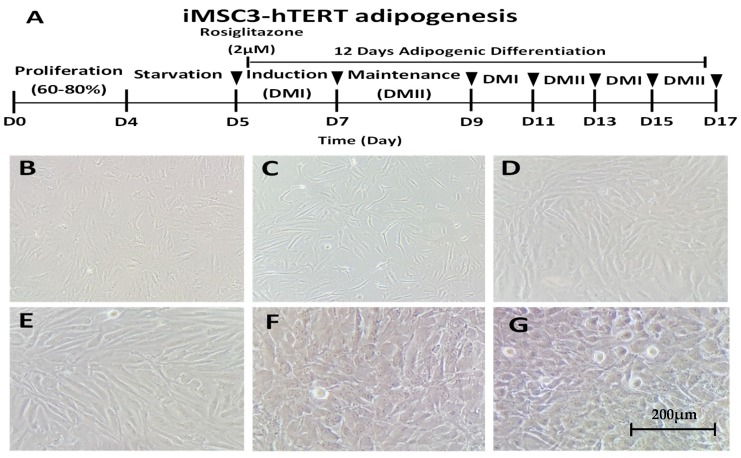
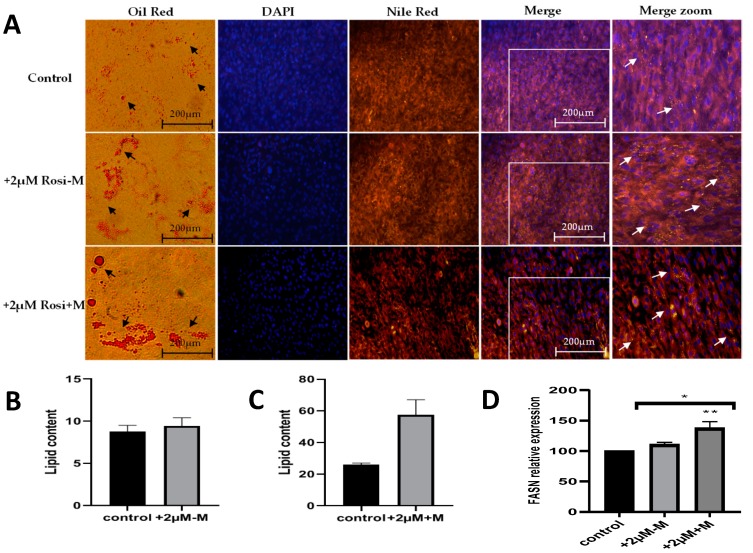
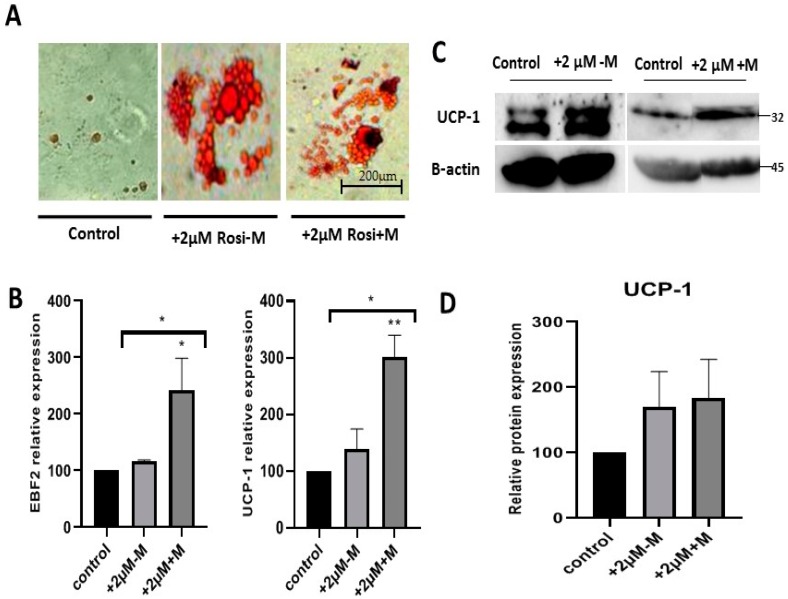
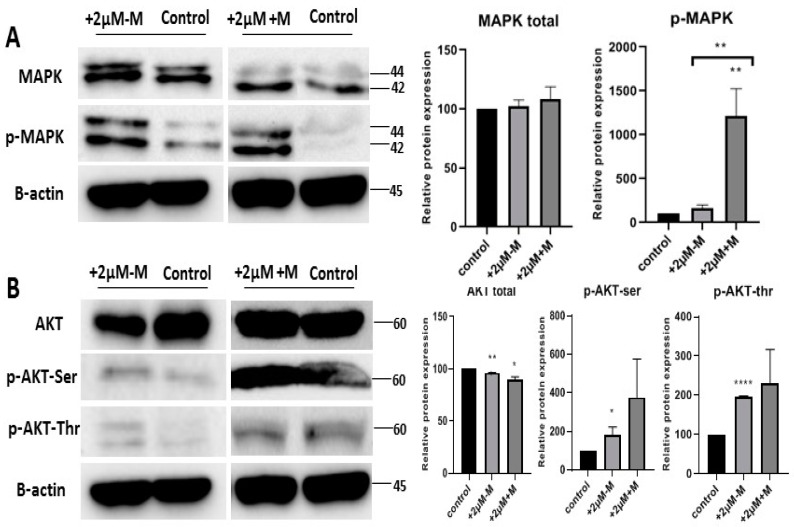
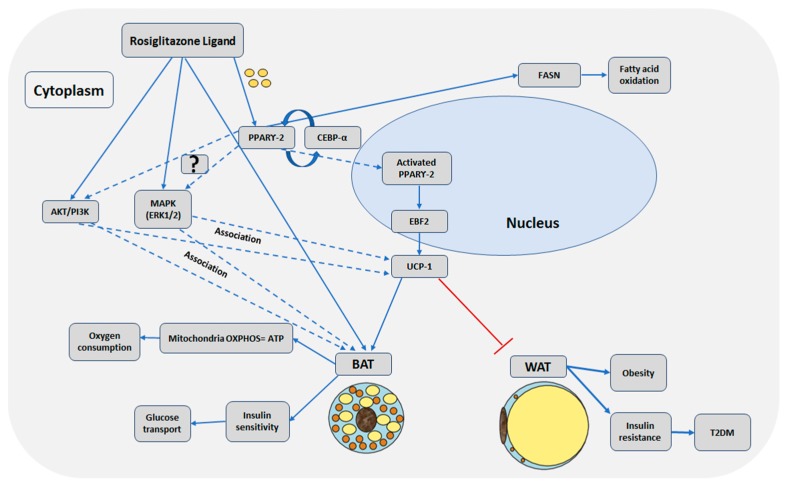
Obesity is a major risk for diabetes. Brown adipose tissue (BAT) mediates production of heat while white adipose tissue (WAT) function in the storage of fat. Roles of BAT in the treatment of obesity and related disorders warrants more investigation. Peroxisome proliferator activator receptor gamma (PPAR-γ) is the master regulator of both BAT and WAT adipogenesis and has roles in glucose and fatty acid metabolism. Adipose tissue is the major expression site for PPAR-γ. In this study, the effects of rosiglitazone on the brown adipogenesis and the association of MAPK and PI3K pathways was investigated during the in vitro adipogenic differentiation of telomerase transformed mesenchymal stromal cells (iMSCs). Our data indicate that 2 µM rosiglitazone enhanced adipogenesis by over-expression of PPAR-γ and C/EBP-α. More specifically, brown adipogenesis was enhanced by the upregulation of EBF2 and UCP-1 and evidenced by multilocular fatty droplets morphology of the differentiated adipocytes. We also found that rosiglitazone significantly activated MAPK and PI3K pathways at the maturation stage of differentiation. Overall, the results indicate that rosiglitazone induced overexpression of PPAR-γ that in turn enhanced adipogenesis, particularly browning adipogenesis. This study reports the browning effects of rosiglitazone during the differentiation of iMSCs into adipocytes in association with the activation of MAPK and PI3K signaling pathways.

Keywords: MAP kinase pathway; PI-3 kinase pathway; PPAR-γ; UCP-1; brown adipocytes; rosiglitazone; telomerase-transformed mesenchymal stromal cells (iMSC3).


Conflict of interest statement

The authors declare no conflict of interest. The funders had no role in the design of the study; in the collection, analyses, or interpretation of data; in the writing of the manuscript, or in the decision to publish the results.

Figures

Figure 1
Figure 1
Differentiation of telomerase-transformed mesenchymal stromal cells into adipocytes: (A) adipogenic differentiation protocol of iMSC3-hTERT for three cycles (in total, 12 days) with and without rosiglitazone; (B) 50–60% confluent mesenchymal stromal cells; (C) cells after 24 h of serum starvation; differentiating adipocytes at the initial stages of induction (D) without and (E) with rosiglitazone; and mature adipocytes after 12 days of differentiation in control cells (F) and cells with rosiglitazone treatment (G).
Figure 2
Figure 2
Effect of rosiglitazone on the fatty acid synthesis and lipid content in MSC-derived adipocytes. (A) Following differentiation, adipocytes from control, rosiglitazone in induction and rosiglitazone in both induction and maintenance were stained with Oil-O red, Nile red and DAPI stains to observe the increase in the density of lipid droplets accumulation in control, +2 µM-M, and +2 µM+M rosiglitazone, respectively. (B,C) Mature adipocytes lipid content was determined by eluting the Oil-O red stain and reading its absorbance at 500 nm. (D) Expression of fatty acid synthase gene was assessed, and data normalized to GAPDH gene. Data represent mean ± S.E.M. * p < 0.05, ** p < 0.01 versus control.
Figure 3
Figure 3
Effects of rosiglitazone on gene expression of PPAR-γ and C/EBP-α in mature adipocytes. Mesenchymal stromal cells were treated without (−) (control) or with (+) 2 µM rosiglitazone in both induction and maintenance media (+2 µM+M) or only in induction media (+2 µM-M) prior to RNA extraction. Extracted RNA was used for expression studies. The representative statistical data of (A) PPAR-γ and (B) C/EBP-α gene expression were normalized to GAPDH gene and are presented as mean ± S.E.M. * p < 0.05, ** p < 0.01, *** p < 0.001 versus control.
Figure 4
Figure 4
Rosiglitazone induces browning characteristics during adipocytes formation. (A) Oil-O red staining of adipocytes with (+) or without (−) rosiglitazone. (B) Gene expression profiles of EBF2 transcription factor and UCP-1 brown adipocyte marker in control and 2 µM rosiglitazone treatment in the induction (+2 µM-M) and rosiglitazone treatment within both induction and maintenance (+2 µM+M). (C) The representative Western blot of brown adipocyte marker, UCP-1, in the differentiated adipocytes without rosiglitazone and with rosiglitazone in the induction only and rosiglitazone in induction and maintenance: UCP-1 (~32 kDa), normalized to that of β-actin (~45 kDa). (D) Quantity of the UCP-1 protein level in each condition. The data are presented as mean ± S.E.M. * p < 0.05, ** p < 0.01 versus control.
Figure 5
Figure 5
MAP kinase and PI3-kinase signaling pathways activated by rosiglitazone during the enhancing of brown lineage. Total and phosphorylated proteins of derived adipocytes from different experimental groups without (−) (control) or with (+) 2 µM rosiglitazone 48 hours (+2 µM+M) or 96 h (+2 µM-M): (A) MAPK (~42/44 kDa) and phospho-MAPK (~42/44 kDa); (B) total AKT (~60 kDa), phospho-AKT-serine (~60 kDa), and phospho-AKT-threonine (~60 kDa) normalized to that of β-actin (~45 kDa). Statistical data are presented as mean ± S.E.M. *p < 0.05, **p < 0.01, ***p < 0.001 versus control.
Figure 6
Figure 6
Schematic illustration of possible molecular mechanisms for Rosiglitazone enhanced browning of adipocytes. Solid line arrows indicate activation or induction, dotted line arrows indicate association that needs further confirmation of activation, and the red “T” arrow indicates inhibition.

References

    1. Kwak D.H., Lee J.H., Kim T., Ahn H.S., Cho W.K., Ha H., Hwang Y.H., Ma J.Y. Aristolochia Manshuriensis Kom Inhibits Adipocyte Differentiation by Regulation of ERK1/2 and Akt Pathway. PLoS ONE. 2012;7:e49530. doi: 10.1371/journal.pone.0049530. - DOI - PMC - PubMed
    1. Choi J., Kim J., Ali M., Jung H., Min B., Choi R., Kim G., Jung H. Anti-Adipogenic Effect of Epiberberine is Mediated by Regulation of the Raf/MEK1/2/ERK1/2 and AMPKα/Akt Pathways. Arch. Pharm. Res. 2015;38:2153–2162. doi: 10.1007/s12272-015-0626-3. - DOI - PubMed
    1. Koppen A., Kalkhoven E. Brown vs. White Adipocytes: The PPARc Coregulator Story. Koppen, A.; Kalkhoven, E. Brown vs white adipocytes: The PPARγ coregulator story. FEBS Lett. 2010;584:3250–3259. doi: 10.1016/j.febslet.2010.06.035. - DOI - PubMed
    1. Lu Y., Fujioka H., Joshi D., Li Q., Sangwung P., Hsieh P., Zhu J., Torio J., Sweet D., Wang L. Mitophagy is Required for Brown Adipose Tissue Mitochondrial Homeostasis during Cold Challenge. Sci. Rep. 2018;8:8251. doi: 10.1038/s41598-018-26394-5. - DOI - PMC - PubMed
    1. Cedikova M., Kripnerová M., Dvorakova J., Pitule P., Grundmanova M., Babuska V., Mullerova D., Kuncova J. Mitochondria in White, Brown, and Beige Adipocytes. Stem Cells Int. 2016;2016:1–11. doi: 10.1155/2016/6067349. - DOI - PMC - PubMed

MeSH terms