

Use of pre-hospital emergency medical services in urban and rural municipalities over a 10 year period: an observational study based on routinely collected dispatch data
- PMID: 30940157
- PMCID: PMC6444540
- DOI: 10.1186/s13049-019-0607-5
Use of pre-hospital emergency medical services in urban and rural municipalities over a 10 year period: an observational study based on routinely collected dispatch data
Abstract
Background: Pre-hospital emergency medical services (EMS) are an integral part of emergency medical care. EMS planning can be achieved by analyzing patterns of use. However, long-term time trends of EMS use have rarely been studied. The objective of this retrospective study was to investigate utilization patterns over a ten year period, and to compare utilization trends between urban and rural municipalities and between events with and without prehospital emergency physician (PEP) dispatch.
Methods: Routine data collected by 26 dispatch centers in the federal state of Bavaria, Germany, from 2007 to 2016 was analyzed. Emergency locations were classified into five levels of rurality. Negative binomial mixed effects regression models were fitted to predict emergency rates and to investigate differences in rates and utilization trends. Graphical representation methods were used to compare distribution of transport rates and distribution across daytime and weekday.
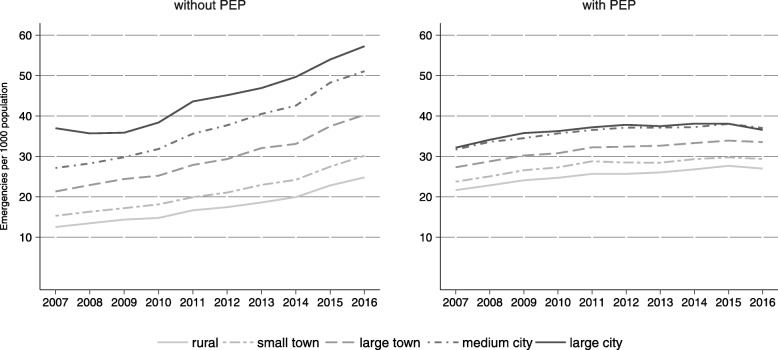
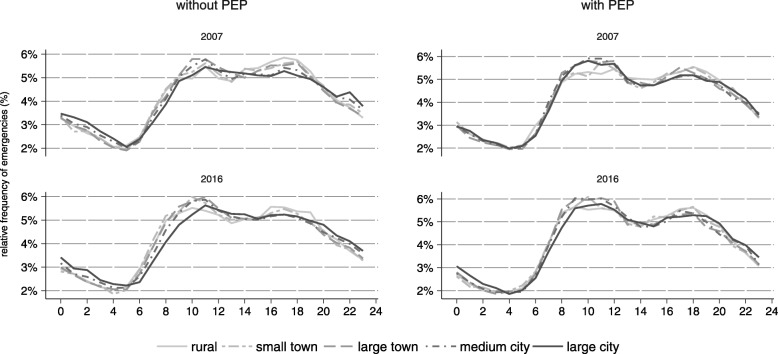
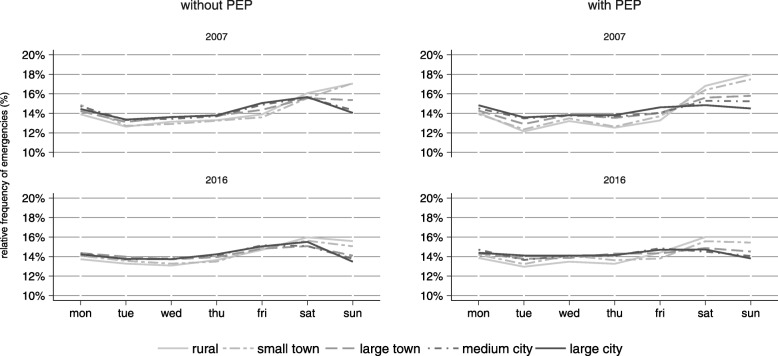
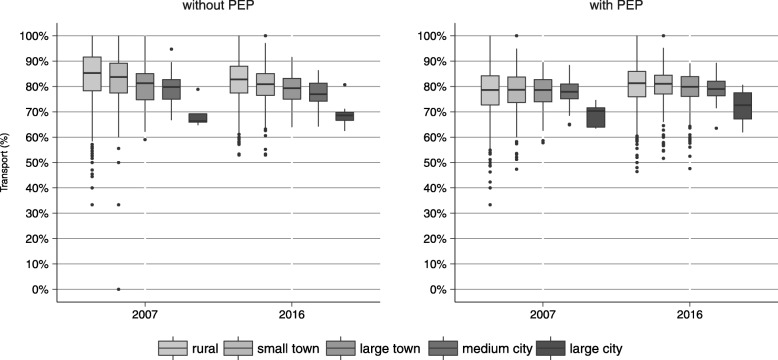
Results: Twelve million two hundred thousand one hundred fifty-five dispatches assigned to 7,725,636 single emergencies were included. The mean number of emergencies per year and 1000 population (emergency rate) was 42.8 (±16.0) in rural municipalities and 80.7 (±9.3) in large cities. Compared to rural municipalities, cities had higher emergency rates without (IRR = 3.0, CI 2.2-4.0) and with pre-hospital physicians (IRR = 1.5, CI 1.2-2.0). Between 2007 and 2016, the absolute number of emergencies increased by 49.1%. Estimated annual percent change of emergency rates without physician activation ranged from 5.7% (CI 4.3-7.1) in cities to 7.8% (CI 7.6-7.9) in rural areas. Changes in emergency rates with physician attendance were lower, with estimated increases between 1.3 and 2.4%. The average proportion of patients transported to a hospital was lower in cities and remained unchanged. There were no considerable differences or changes in the distribution across daytime and weekdays.
Conclusion: Differences between cities and other areas suggest that the planning of EMS should be targeted to regional characteristics. A substantial increase in emergency rates was observed across all areas of Bavaria, but did not impact transport rates or temporal distributions. Further research is needed to better understand the urgency of emergency events and reasons behind increasing EMS utilization.
Keywords: Emergency medical dispatch; Epidemiology; Health services use; Pre-hospital emergency medical services.
Conflict of interest statement
Ethics approval and consent to participate
The study was approved by the ethics committee of the medical faculty of the University of Munich (Project-No 17–813). Consent to participate was not required as data were anonymized.
Consent for publication
Not applicable
Competing interests
The authors declare that they have no competing interests.
Publisher’s Note
Springer Nature remains neutral with regard to jurisdictional claims in published maps and institutional affiliations.
Figures
References
-
- Toloo S, FitzGerald G, Aitken P, Ting J, Tippett V, Chu K. Emergency health services: demand and service delivery models. Monograph 1: literature review and activity trends. 2011.
Publication types
MeSH terms
LinkOut - more resources
Full Text Sources
Medical
Miscellaneous
