

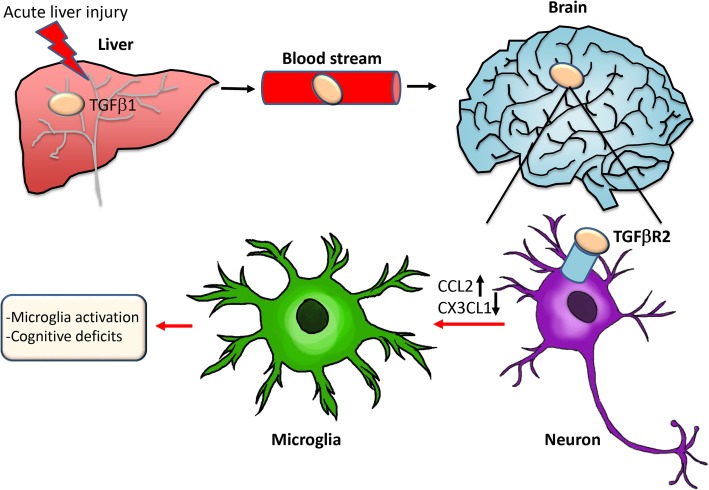
Elevated circulating TGFβ1 during acute liver failure activates TGFβR2 on cortical neurons and exacerbates neuroinflammation and hepatic encephalopathy in mice
- PMID: 30940161
- PMCID: PMC6446280
- DOI: 10.1186/s12974-019-1455-y
Elevated circulating TGFβ1 during acute liver failure activates TGFβR2 on cortical neurons and exacerbates neuroinflammation and hepatic encephalopathy in mice
Abstract
Background: Acute liver failure resulting from drug-induced liver injury can lead to the development of neurological complications called hepatic encephalopathy (HE). Hepatic transforming growth factor beta 1 (TGFβ1) is upregulated due to liver failure in mice and inhibiting circulating TGFβ reduced HE progression. However, the specific contributions of TGFβ1 on brain cell populations and neuroinflammation during HE are not known. Therefore, the aim of this study was to characterize hepatic and brain TGFβ1 signaling during acute liver failure and its contribution to HE progression using a combination of pharmacological and genetic approaches.
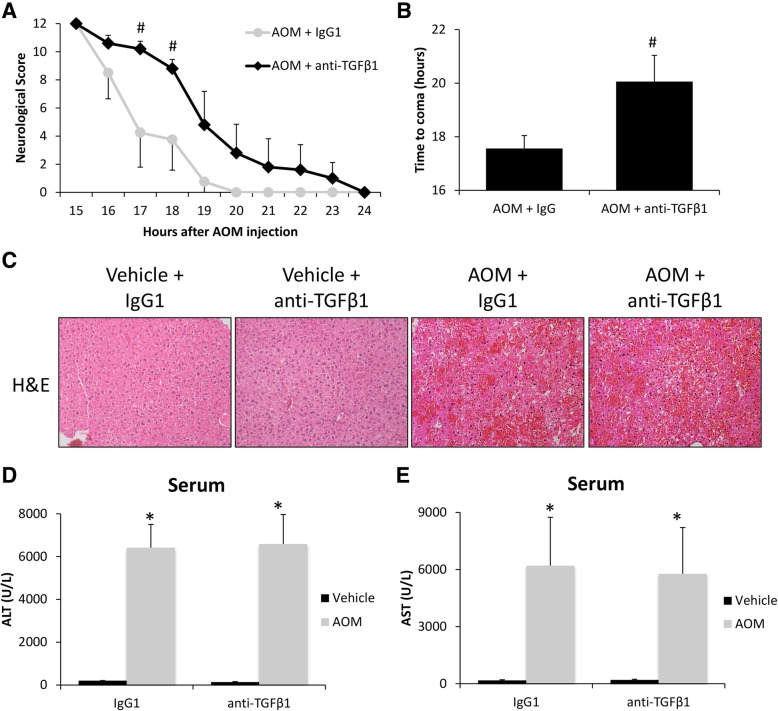
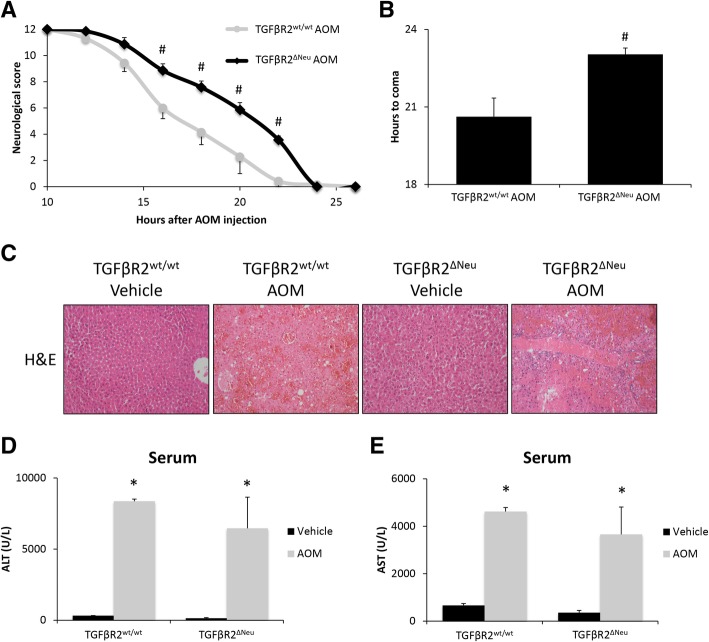
Methods: C57Bl/6 or neuron-specific transforming growth factor beta receptor 2 (TGFβR2) null mice (TGFβR2ΔNeu) were treated with azoxymethane (AOM) to induce acute liver failure and HE. The activity of circulating TGFβ1 was inhibited in C57Bl/6 mice via injection of a neutralizing antibody against TGFβ1 (anti-TGFβ1) prior to AOM injection. In all mouse treatment groups, liver damage, neuroinflammation, and neurological deficits were assessed. Inflammatory signaling between neurons and microglia were investigated in in vitro studies through the use of pharmacological inhibitors of TGFβ1 signaling in HT-22 and EOC-20 cells.
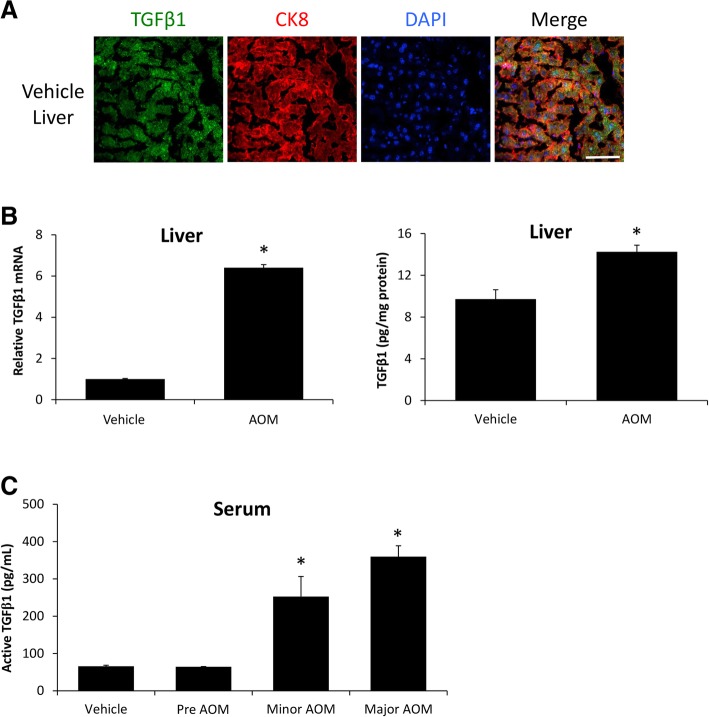
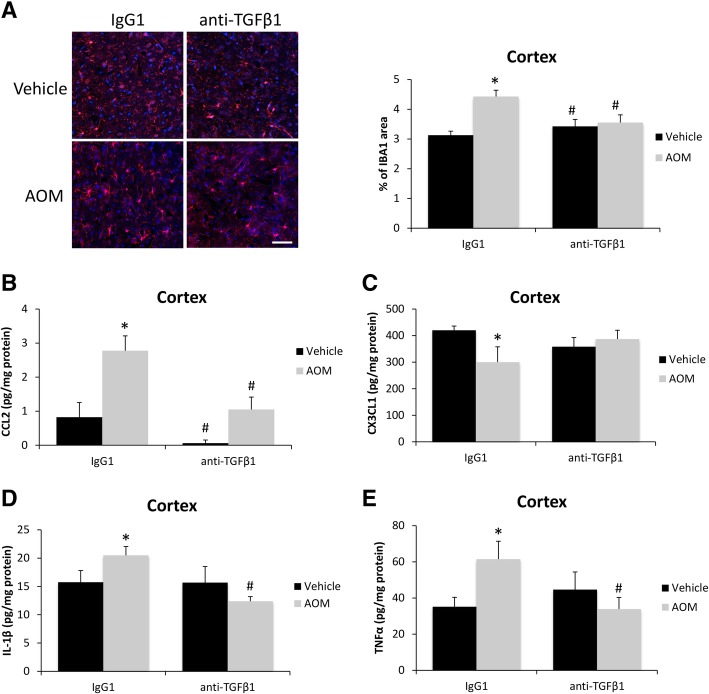
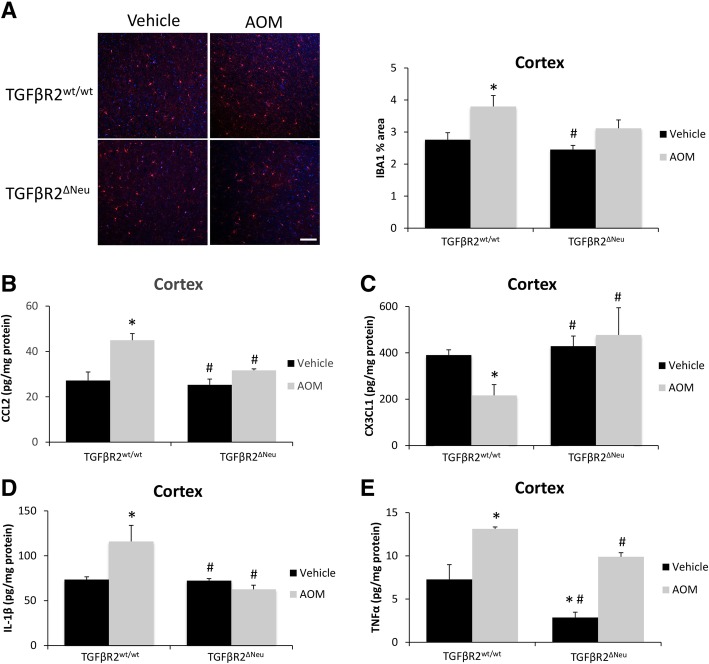
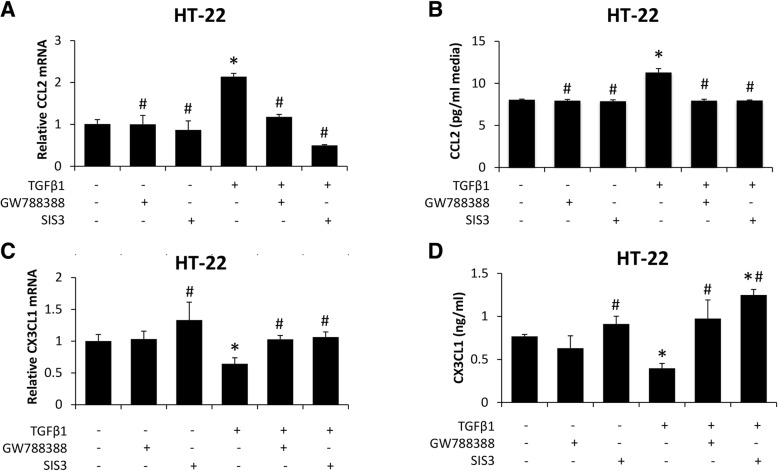
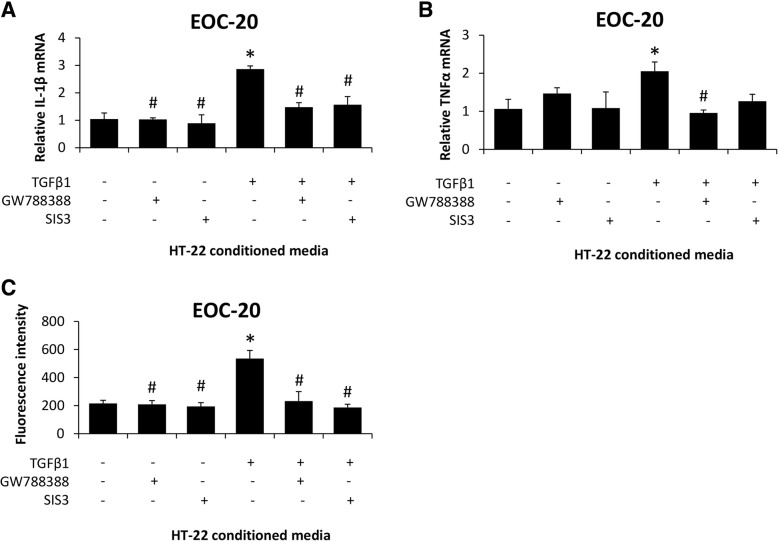
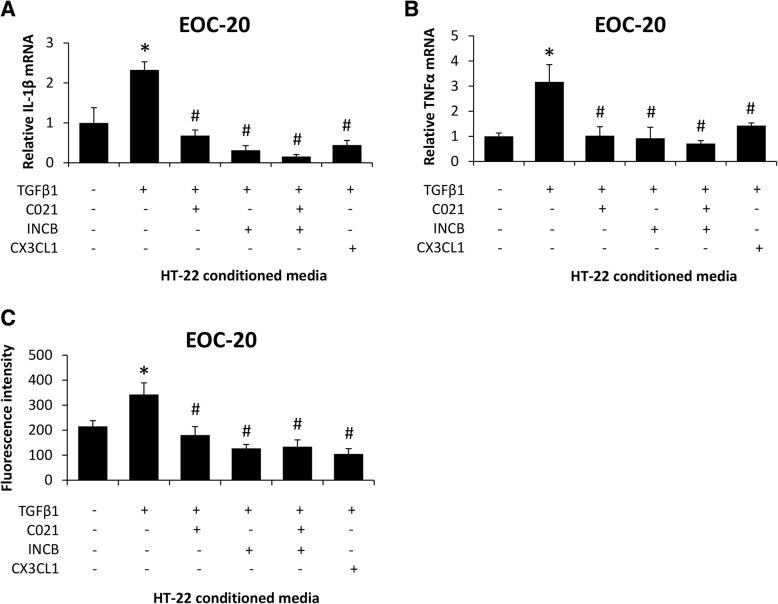
Results: TGFβ1 was expressed and upregulated in the liver following AOM injection. Pharmacological inhibition of TGFβ1 after AOM injection attenuated neurological decline, microglia activation, and neuroinflammation with no significant changes in liver damage. TGFβR2ΔNeu mice administered AOM showed no effect on liver pathology but significantly reduced neurological decline compared to control mice. Microglia activation and neuroinflammation were attenuated in mice with pharmacological inhibition of TGFβ1 or in TGFβR2ΔNeu mice. TGFβ1 increased chemokine ligand 2 (CCL2) and decreased C-X3-C motif ligand 1 (CX3CL1) expression in HT-22 cells and reduced interleukin-1 beta (IL-1ß) expression, tumor necrosis factor alpha (TNFα) expression, and phagocytosis activity in EOC-20 cells.
Conclusion: Increased circulating TGFβ1 following acute liver failure results in activation of neuronal TGFβR2 signaling, driving neuroinflammation and neurological decline during AOM-induced HE.
Keywords: Acute liver failure; Azoxymethane; Microglia; Necrosis; Neuroinflammation.
Conflict of interest statement
Ethics approval and consent to participate
All animal experiments in this study were performed in accordance with the Animal Welfare Act, and the Guide for the care and use of Laboratory Animals, and were approved by the Baylor Scott & White Health IACUC committee (#2011-052R).
Consent for publication
Not applicable.
Competing interests
The authors declare that they have no competing interests.
Publisher’s Note
Springer Nature remains neutral with regard to jurisdictional claims in published maps and institutional affiliations.
Figures
References
-
- American Association for the Study of Liver D, European Association for the Study of the L Hepatic encephalopathy in chronic liver disease: 2014 practice guideline by the European Association for the Study of the liver and the American Association for the Study of Liver Diseases. J Hepatol. 2014;61(3):642–659. doi: 10.1016/j.jhep.2014.05.042. - DOI - PubMed
-
- Matkowskyj KA, Marrero JA, Carroll RE, Danilkovich AV, Green RM, Benya RV. Azoxymethane-induced fulminant hepatic failure in C57BL/6J mice: characterization of a new animal model. Am J Phys. 1999;277(2):G455–G462. - PubMed
MeSH terms
Substances
Grants and funding
LinkOut - more resources
Full Text Sources
Molecular Biology Databases
Research Materials
Miscellaneous
