. 2019 Jun:24:108-119.
doi: 10.1016/j.molmet.2019.03.001. Epub 2019 Mar 13.

Discovering metabolic disease gene interactions by correlated effects on cellular morphology

Affiliations

Discovering metabolic disease gene interactions by correlated effects on cellular morphology

Yang Jiao et al. Mol Metab. 2019 Jun.

Abstract

Objective: Impaired expansion of peripheral fat contributes to the pathogenesis of insulin resistance and Type 2 Diabetes (T2D). We aimed to identify novel disease-gene interactions during adipocyte differentiation.

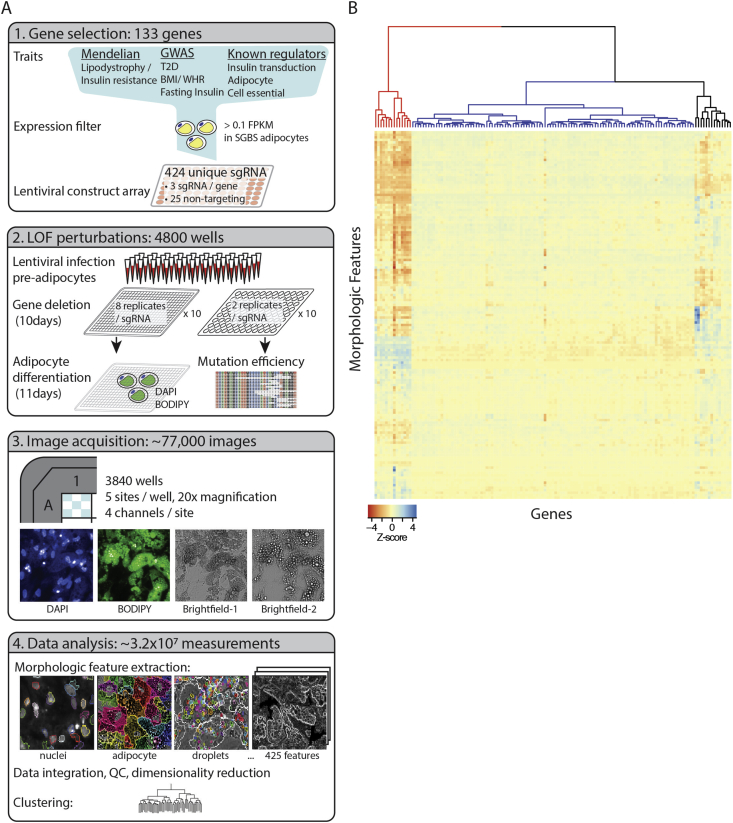
Methods: Genes in disease-associated loci for T2D, adiposity and insulin resistance were ranked according to expression in human adipocytes. The top 125 genes were ablated in human pre-adipocytes via CRISPR/CAS9 and the resulting cellular phenotypes quantified during adipocyte differentiation with high-content microscopy and automated image analysis. Morphometric measurements were extracted from all images and used to construct morphologic profiles for each gene.

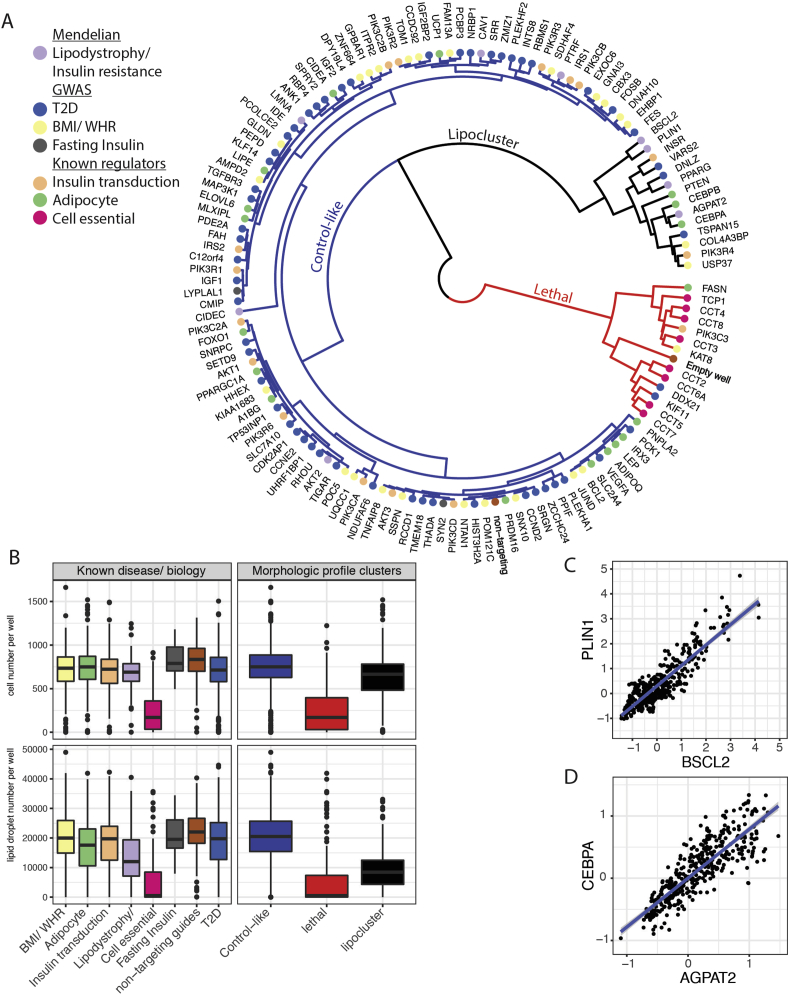
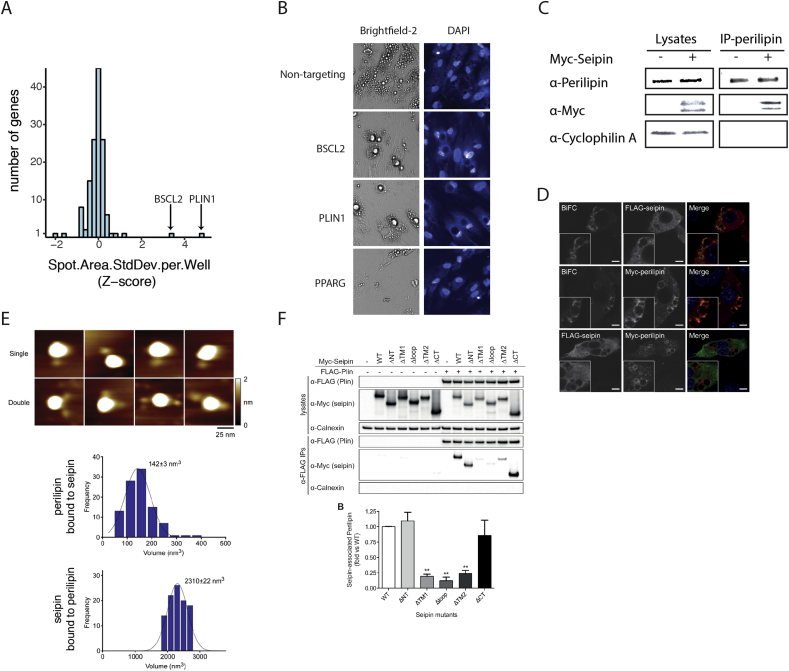
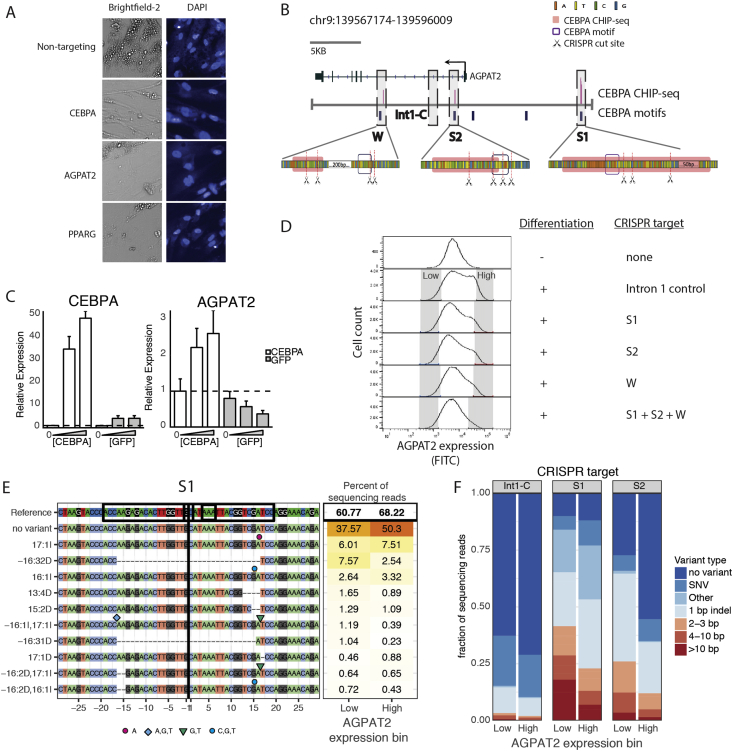
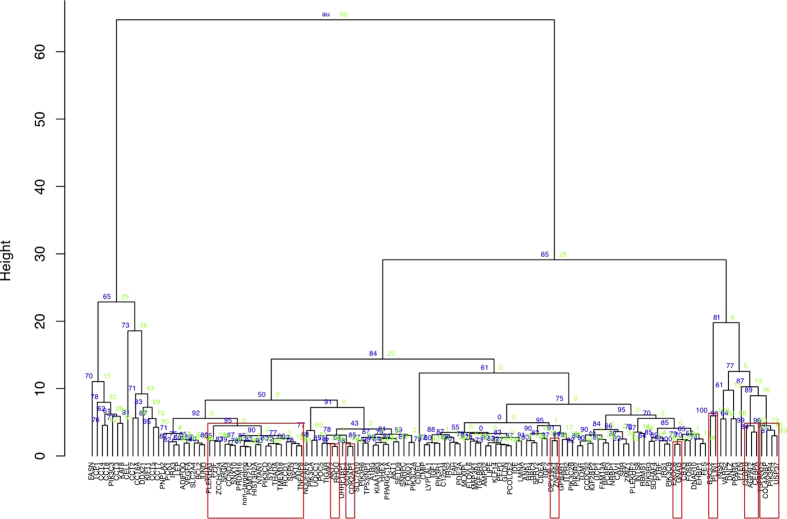
Results: Over 107 morphometric measurements were obtained. Clustering of the morphologic profiles accross all genes revealed a group of 14 genes characterized by decreased lipid accumulation, and enriched for known lipodystrophy genes. For two lipodystrophy genes, BSCL2 and AGPAT2, sub-clusters with PLIN1 and CEBPA identifed by morphological similarity were validated by independent experiments as novel protein-protein and gene regulatory interactions.

Conclusions: A morphometric approach in adipocytes can resolve multiple cellular mechanisms for metabolic disease loci; this approach enables mechanistic interrogation of the hundreds of metabolic disease loci whose function still remains unknown.

Keywords: Functional genomics; Gene discovery; Genetic screen; High content imaging; Insulin resistance; Lipodystrophy; Metabolic syndrome; Type 2 diabetes.


Figures

Figure 1
Figure 1
Functional interaction of metabolic disease-associated loci in human adipocytes by morphologic profiling. (A) [1] Genes were systematically identified from both Mendelian and common forms of metabolic disease alongside known regulators of adipocyte function and insulin signaling. This list was filtered by gene expression in differentiating SGBS cells resulting in 125 genes for study. Three independent CRISPR/CAS9 constructs were designed for each gene alongside non-targeting controls, and cloned for arrayed lentiviral transduction. [2] SGBS pre-adipocytes were infected with the lentiviral guide array and incubated for 10 days to allow gene knockout. After incubation transduced cells were differentiated into adipocytes; selected constructs were re-infected for assessment of gene modification/mutation efficiency. [3] Differentiated cells were stained for lipid (BODIPY) and nuclei (DAPI) and imaged in the corresponding fluorescent channels along with two types of brightfield images on an automated high-content microscope (Opera Phenix). [4] Each image was processed to segment cells, extract and numerically quantify 425 morphologic features. The resulting data were filtered for quality, removing poorly reproducible and redundant features to create morphologic profiles for each of the genes studied. The morphologic features were clustered to relate genes to one another and obtain novel mechanistic insight. (B) Morphologic profiles of 125 metabolic disease genes and 8 essential gene controls perturbed in human adipocytes. Z-scores of the 425 morphologic features (rows) for the 133 perturbed genes (columns) are displayed as a heatmap. The genes are clustered by morphologic similarity among the gene knockouts. The three major branches of the clustering dendrogram are color-coded as described in detail in the methods and Figure 2.
Figure 2
Figure 2
Comparison of morphologic profile annotations to known biology and identification of novel morphologic interactions. (A) Morphologic correlations overlaid with known gene annotations. Shown is a circular dendrogram relating the morphologic profiles obtained from perturbing 133 genes, non-targeting controls, and empty wells. The distal leaves of the dendrogram (individual genes) are labeled and color-coded according to their relation to known genetic disease associations and cellular biology. The first three major branches of the dendrogram are highlighted in color and named “control-like” (blue; inclusion of non-targeting controls), “lethal” (red; inclusion of empty wells) and “lipocluster” (black; inclusion of many known lipodystrophy genes). (B) Cell number and lipid accumulation in sets of genes according to known disease/biological associations or morphologic similarity. Boxplots show median, 25th and 75th percentiles of cell number (top panels) or lipid droplet number (bottom panels) in the 133 gene knockouts grouped by known disease/biological associations (left panels) or by morphologic profile similarity (as shown in 2A). (C) Scatterplot comparing 425 morphologic features (Z-scores) identified from human adipocytes ablated for BSCL2 or PLIN1. Pearson r = 0.89, p < 2.2 × 10−16. (D) Scatterplot comparing 425 morphologic features (Z-scores) identified from human adipocytes ablated for CEBPA or AGPAT2. Pearson r = 0.85, p < 2.2 × 10−16.
Figure 3
Figure 3
Protein–protein interaction of BSCL2 and PLIN1 at the lipid droplet surface. (A) Histogram of Z-scores for variation in lipid droplet size in SGBS adipocytes ablated for 133 genes. Variation in lipid droplet size is quantified by automated image analysis and feature extraction and summarized as the standard deviation for all cells exposed to targeting constructs for a gene. Adipocytes targeted with constructs against BSCL2 or PLIN1 result in the most extreme Z-scores for variation in lipid droplet size among the 133 genes. (B) 20× brightfield and fluorescence (488 nm, DAPI stained) images of SGBS cells exposed to gene targeting and non-targeting CRISPR/CAS9 constructs and subsequently differentiated. Residual large lipid droplets are observed with BSCL2 or PLIN1 ablation when compared to control or PPARG ablation. (C) Co-immunoprecipitation and western blotting of seipin and perilipin in human adipocytes. SGBS adipocytes were transduced with Myc-seipin and differentiated for seven days. Endogenous perilipin was immunoprecipitated and co-immunoprecipitation of exogenous Myc-seipin is observed. Cyclophilin A was blotted as a cell loading control. (D) 3T3-L1 cells were induced to differentiate and co-transfected with FLAG-seipin-YFPn and Myc-perilipin-YFPc on day 2 of differentiation. Following a temperature shift to induce the formation of reconstituted YFP, cells were fixed on day 5 of differentiation and stained for FLAG-seipin (top panels) or Myc-perilipin (middle panels) and DAPI to label nuclei. The direct interaction between seipin and perilipin is indicated by the presence of YFP signal. Identically transfected cells were used to co-immunostain for FLAG-seipin-YFPn and Myc-perilipin-YFPc (bottom panels). Note that these cells were not temperature shifted to prevent formation of YFP, which would confound the Alexa Fluor 488 fluorescence used to detect the FLAG epitope. Top and middle panels, individual images are shown in grayscale and merged images show overlay of YFP (yellow) and FLAG-seipin or Myc-perilipin (red). Bottom panels, individual images are shown in grayscale and merged image shows overlay FLAG-seipin (green) and Myc-perilipin (red), inset boxes show zoomed images. Scale bars, 10 μm. (E) AFM analysis of the interaction of perilipin with seipin. FLAG-perilipin and seipin-Myc were co-expressed in tsA 201 cells and proteins were isolated using anti-Myc immunoaffinity chromatography. AFM images of isolated seipin dodecamers (large particles) singly (upper panels) or doubly (lower panels) decorated by smaller perilipin particles. Scale bar, 25 nm; height scale, 0–2 nm. Histograms show the frequency distribution of volumes of seipin particles bound to perilipin (n = 100) and of perilipin particles bound to seipin particles (n = 100). The curve indicates the fitted Gaussian function. The peak of the distribution (±SEM) is indicated. (F) HEK293 cells were transfected with FLAG-perilipin in the absence or presence of either wild-type Myc-seipin (WT) or mutants lacking the N terminus (ΔNT), first transmembrane domain (ΔTM1), ER luminal loop region (Δloop), second transmembrane domain (ΔTM2), or the C terminus (ΔCT). Lysates or anti-FLAG immunoprecipitates were immunoblotted for FLAG, Myc and the ER membrane protein calnexin. Quantification of the interaction of mutant vs. wild-type seipin from replicate experiments is shown in the lower panel. Data are means ± SEM (n = 3). ** indicates p < 0.01 versus co-immunoprecipitation with wild-type seipin.
Figure 4
Figure 4
Genetic interaction between AGPAT2 and CEBPA. (A) 20× brightfield and fluorescence (488 nm, DAPI stained) images of SGBS cells exposed to gene targeting and non-targeting CRISPR/CAS9 constructs and subsequently differentiated. Decreased lipid accumulation is observed with AGPAT2, CEBPA, or PPARG ablation. (B) (upper) The AGPAT2 gene structure is shown (hg19) with overlaid tracks showing the genomic positions of C/EBPa ChIP-Seq peaks in differentiated SGBS cells (Galhardo et al., 2014). The genomic position of high-scoring C/EBPa consensus motifs is also shown alongside a selected control region in the first intron (Int1C). (lower) Expanded base pair resolution view of three putative C/EBPa binding sites identified on the basis of overlapping of CHIP-seq (pink boxes) and consensus motif (blue boxes) data. For each site identified site S1, S2 and W the positions of the predicted cut site of selected CRISPR/CAS9 constructs is shown. (C) Dosed overexpression of CEBPA in undifferentiated SGBS cells using a doxycyline-inducible transgene with assessment of AGPAT2 gene expression. RT-qPCR fold-change data are shown demonstrating a dose response for AGPAT2 induction in response to CEBPA over-expression as compared to GFP overexpression. (D) FACS sorting of differentiating SGBS cells according to AGPAT2 gene expression. SGBS cells were treated with CRISPR constructs targeting putative C/EBPa binding sites or a control region in the first intron, differentiated, and stained for AGPAT2 expression. Histograms of AGPAT2 gene expression are shown for CRISPR-treated populations as well as undifferentiated cells. In differentiated cells a second peak of increased AGPAT2 gene expression is observed and is attenuated by treatment of CRISPR constructs targeting C/EBPa binding sites. Grey boxes denote the sorting gates (comprising 6.5–8.5% of the total distribution) of low and high AGPAT2 expressing cells collected for genomic analysis. (E) Indel quantification at the S1 C/EBPa binding site of SGBS adipocytes sorted by AGPAT2 expression. SGBS cells were treated with S1 site targeting CRISPR constructs as shown in D) with 70,000 cells shotgun from the low and high ends of the AGPAT2 expression distribution. Listed are the ten most frequent alleles collectively comprising 60 and 68 percent of all sequenced alleles. Large indels are enriched in treated cells expressing low levels of AGPAT2. (F) Indel quantification at the intron 1 control, S1, or S2 C/EBPa binding sites in SGBS adipocytes sorted by AGPAT2 expression. SGBS cells were treated with control, S1, or S2 site targeting CRISPR constructs as shown in D) with 70,000 cells shotgun from the low and high ends of the AGPAT2 expression distribution. The stacked barplots show the relative frequency and type of allele at the sequenced site corresponding to each targeting construct. An increase in proportion of large indels can be seen in the low AGPAT2 expression bin in adipocytes treated with S1 or S2 targeting constructs.
None
figs1

References

    1. Shalem O., Sanjana N.E., Zhang F. High-throughput functional genomics using CRISPR-Cas9. Nature Reviews Genetics. 2015;16(5):299–311. - PMC - PubMed
    1. Visscher P.M., Wray N.R., Zhang Q., Sklar P., McCarthy M.I., Brown M.A. 10 Years of GWAS discovery: biology, function, and translation. The American Journal of Human Genetics. 2017;101(1):5–22. - PMC - PubMed
    1. Lamb J., Crawford E.D., Peck D., Modell J.W., Blat I.C., Wrobel M.J. The connectivity map: using gene-expression signatures to connect small molecules, genes, and disease. Science. 2006;313(5795):1929–1935. - PubMed
    1. Caicedo J.C., Singh S., Carpenter A.E. Applications in image-based profiling of perturbations. Current Opinion in Biotechnology. 2016;39:134–142. - PubMed
    1. Meijering E., Carpenter A.E., Peng H., Hamprecht F.A., Olivo-Marin J.-C. Imagining the future of bioimage analysis. Nature Biotechnology. 2016;34(12):1250–1255. - PubMed

Publication types

MeSH terms