. 2019 Apr 2;10(2):e00204-19.
doi: 10.1128/mBio.00204-19.

Human Influenza A Virus Hemagglutinin Glycan Evolution Follows a Temporal Pattern to a Glycan Limit

Affiliations

Human Influenza A Virus Hemagglutinin Glycan Evolution Follows a Temporal Pattern to a Glycan Limit

Meghan O Altman et al. mBio. .

Abstract

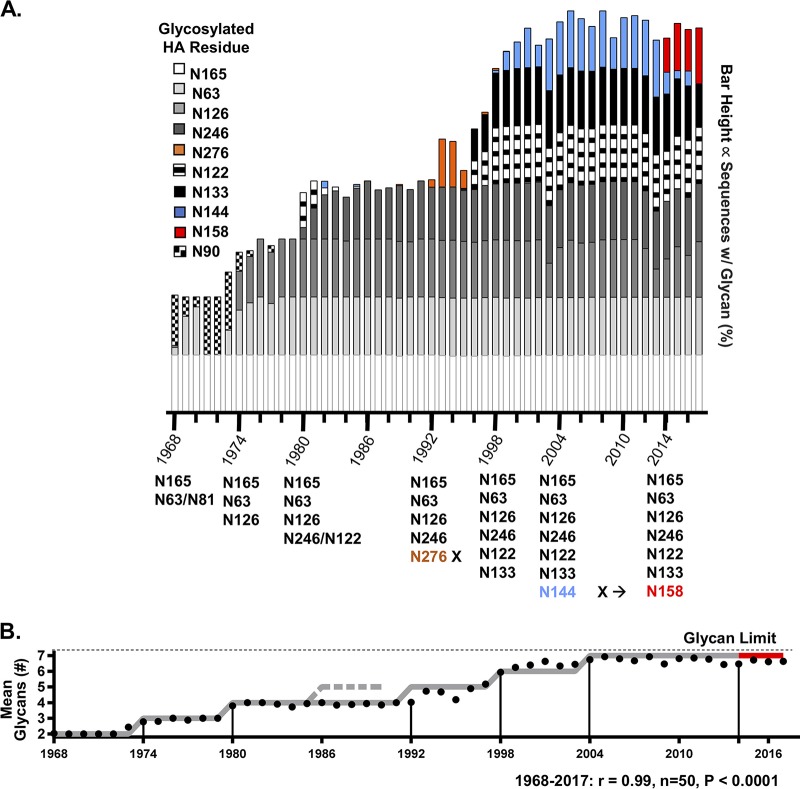
Human antibody-based immunity to influenza A virus is limited by antigenic drift resulting from amino acid substitutions in the hemagglutinin (HA) head domain. Glycan addition can cause large antigenic changes but is limited by fitness costs to viral replication. Here, we report that glycans are added to H1 and H3 HAs at discrete 5-to-7-year intervals, until they reach a functional glycan limit, after which glycans are swapped at approximately 2-fold-longer intervals. Consistent with this pattern, 2009 pandemic H1N1 added a glycan at residue N162 over the 2015-2016 season, an addition that required two epistatic HA head mutations for complete glycosylation. These strains rapidly replaced H1N1 strains globally, by 2017 dominating H3N2 and influenza B virus strains for the season. The pattern of glycan modulation that we outline should aid efforts for tracing the epidemic potential of evolving human IAV strains.IMPORTANCE Frequent mutation of its major antibody target, the glycoprotein hemagglutinin, ensures that the influenza virus is perennially both a rapidly emerging virus and a major threat to public health. One type of mutation escapes immunity by adding a glycan onto an area of hemagglutinin that many antibodies recognize. This study revealed that these glycan changes follow a simple temporal pattern. Every 5 to 7 years, hemagglutinin adds a new glycan, up to a limit. After this limit is reached, no net additions of glycans occur. Instead, glycans are swapped or lost at longer intervals. Eventually, a pandemic replaces the terminally glycosylated hemagglutinin with a minimally glycosylated one from the animal reservoir, restarting the cycle. This pattern suggests the following: (i) some hemagglutinins are evolved for this decades-long process, which is both defined by and limited by successive glycan addition; and (ii) hemagglutinin's antibody dominance and its capacity for mutations are highly adapted features that allow influenza to outpace our antibody-based immunity.

Keywords: glycosylation; hemagglutinin; immune evasion; influenza; viral evolution.


Figures

FIG 1
FIG 1
Quantitative survey of HA glycan numbers in IAV. (A) Relative HA sizes, measured by migration rate through a gel, correlate with predicted numbers of head glycans. H1N1s (triangles) add 3.3 ± 0.2 kDa per glycan (or 13.1 kDa in total) while increasing from 1 to 5 glycans. H3N2s (HA1; circles) add 2.5 ± 0.2 kDa per glycan (or 12.5 kDa in total) while increasing from 2 to 7 glycans. Each point represents the mean HA size for one virus. Error bars represent standard deviations of the means. (B) HA sizes over time for H1N1s (triangles) and H3N2s (HA1; circles) reveal regular glycan addition. Glycan outliers and strains not included in analysis (open triangles) are addressed in Materials and Methods. Strains are color-coded to match glycan numbers (Fig. S3). A glycan is added on average every 5.4 years for sH1N1 and every 8.1 years for H3N2. The strain most closely related to the sH1N1 virus reintroduced in 1977, A/Fort Leonard Wood/1951, is boxed and labeled in blue. The pH1N1 strain, A/California/07/2009, is boxed and labeled in black. Data representing the Pearson coefficient of correlation (r) and its P value are shown on both graphs. Error bars represent standard errors of the means of data from n = 3 to 5 blots.
FIG 2
FIG 2
H1 glycan evolution, 1918 to 2017. (A) Stacked bars correspond to the percentages of all human H1N1 sequences from a given year containing a glycan listed in the legend. Dates of glycan transition are indicated on the timeline at the bottom, along with the glycosylated residues. Years with no data were left blank. Sequence counts for each year are shown in Fig. S4A. Pandemics are denoted by yellow lines. (B) Mean predicted numbers of glycans among all sequences from each year are shown as black circles, which are displayed atop the idealized pattern (gray line; the light blue line indicates glycan swap from sequences containing N127/N155 to sequences containing N125/N54). Black vertical lines denote 11-year intervals after the glycan limit was reached or 6-year intervals during glycan addition. Data representing Pearson’s coefficient of correlation (r) with sample number (n) and P value, from two-tailed Student's t test comparing the pattern versus the sequence data are shown at the bottom.
FIG 3
FIG 3
H3 glycan evolution, 1968 to 2017. (A) Stacked bars correspond to the percentages of all human H3N2 sequences from a given year containing a glycan listed in the legend. Dates of glycan transition are indicated on the timeline at the bottom along with the glycosylated residues. Sequence counts for each year are shown in Fig. S4B. Mean predicted numbers of glycans among all sequences from each year are shown as black circles, which are displayed atop the idealized pattern (gray line; the red line indicates glycan transition from sequences containing N144 to sequences containing N158). The dashed gray line indicates when N276 would have been added if it had followed the pattern. Black vertical lines denote 11-year intervals after glycan limit was reached or 6-year intervals during glycan addition. Data representing Pearson’s coefficient of correlation (r) with sample number (n) and P value from two-tailed Student's t test comparing the pattern versus the sequence data are shown at the bottom.
FIG 4
FIG 4
Quantitative analysis of glycan eras. (A) The duration (in years) of each glycan era corresponds to the interval when >10%, >50%, or >80% of sequences had the new glycan arrangement. The data shown for the duration of the glycan era correspond to the range of these three dates. (B) The durations of glycan eras ended by glycan addition were, on average, half as long as those seen after the glycan limit was reached (Student’s two-tailed t test, P = 0.0079). Eras ended by pandemic replacement are denoted by open circles.
FIG 5
FIG 5
pH1N1 glycan addition predicted from gel migration data. (A) Frequency of human pH1N1 sequences in FluDB determined by the number of predicted glycans in each calendar year. The number of sequences represented by each bar is shown above the bar. Until January 2015, >90% of sequences had 1 glycan (black). Starting in 2015, strains with 2 glycans swept the globe (red). (B) Frequency of individual residues glycosylated in human pH1N1 sequences. N87 predominates throughout (>95%, black). N162 (red) and N136 (blue) appeared at low frequencies until 2015, when strains having both N162 and N87 dominated. N162 strains were found in every year. Rarely, in addition to N87, a residue other than N162 or N136 was found to have a potential glycosylation site (gray). Unlike N162, a single mutation with N136 alone is sufficient for glycosylation (14). (C) HA Western blots of A/California/07/2009 mutants with permutations of N162, K163Q, and I216T with and without PNGase treatment to remove glycans. The single mutant with N162 alone did not shift in size, indicating that it was not detectably glycosylated. While a portion of the double mutant N162/K163Q shifted, a complete shift, indicating majority glycosylation, was seen only with the triple mutant N162/K163Q/I216T.
FIG 6
FIG 6
HA model highlighting key HA residues. Complete A/Michigan/45/2015 HA with an attached N162 glycan, embedded in a lipid bilayer, is shown from the side (left) and top (right). Three residues defining the N162 glycosite have undergone recent mutations, and their surfaces are shown in pink as follows: S162N, 2016–2017; K163Q, 2013–2014; and S164T, 2017–2018. The original I216 mutation (cyan) the and compensatory T216 mutation (magenta) stick side chains are overlaid across the monomer from the glycan. The surface of a slightly earlier antigenic site mutation, S84N, is indicated in green. All additional glycosylated Asn residues on HA are shown in pink. The inset shows a magnified view of the mutated residues with ∼9 Å of distance between the Thr hydroxyl group and the nearest GlcNAc hydroxyl group.
FIG 7
FIG 7
Global emergence of N162/I216T strains. (A) Proportions of all globally available H1 sequences from pH1N1 viruses collected in 2009 to 2017 from the GIASAID database with the N162/I216T substitutions are indicated for 12 geographical regions over time (in Africa, Egypt, Cameroon, and Ethiopia; in Central America, Costa Rica; in Central Asia, Kazakhstan and Kyrgyzstan; in East Asia, Japan, China, Hong Kong, Taiwan, and South Korea; in Europe, Iceland, Austria, Netherlands, Germany, Russia, Denmark, Norway, United Kingdom, Ukraine, Greece, Sweden, and Belgium; in the Middle East, Iran, Oman, Bahrain, Jordan, Turkey, Afghanistan, and Israel; in North America, the United States and Canada; in Oceania, Australia; in the Pacific Islands, Hawaii; in South America, Brazil; in South Asia, India, Nepal, Bangladesh, and Pakistan; and in Southeast Asia, Singapore, Philippines, and Cambodia). The 95% HPD intervals for mean time to the most recent common ancestor (tMRCA) are indicated by vertical blue or gray shadows. (B) The posterior probability support for the geographical origin of the major clade of N162/I216T and S84N viruses is indicated by the shade of the country (light blue = low posterior probability, dark blue = high posterior probability), inferred from the MCC tree. This figure is reproduced with separated proportions of sequences panels in File S11 (http://downloads.misms.net/Publications/Glycosylation_mBio/index.html).

References

    1. WHO. 2003. Influenza fact sheet no. 211. http://www.who.int/mediacentre/factsheets/2003/fs211/en/. Accessed 21 June 2018.
    1. Couch RB, Kasel JA. 1983. Immunity to influenza in man. Annu Rev Microbiol 37:529–549. doi: 10.1146/annurev.mi.37.100183.002525. - DOI - PubMed
    1. CDC. 2017. Vaccine effectiveness-how well does the flu vaccine work? https://www.cdc.gov/flu/about/qa/vaccineeffect.htm. Accessed 21 June 2018.
    1. Keil W, Geyer R, Dabrowski J, Dabrowski U, Niemann H, Stirm S, Klenk HD. 1985. Carbohydrates of influenza virus. Structural elucidation of the individual glycans of the FPV hemagglutinin by two-dimensional 1H n.m.r. and methylation analysis. EMBO J 4:2711–2720. doi: 10.1002/j.1460-2075.1985.tb03991.x. - DOI - PMC - PubMed
    1. Khatri K, Klein JA, White MR, Grant OC, Leymarie N, Woods RJ, Hartshorn KL, Zaia J. 2016. Integrated omics and computational glycobiology reveal structural basis for influenza A virus glycan microheterogeneity and host interactions. Mol Cell Proteomics 15:1895–1912. doi: 10.1074/mcp.M116.058016. - DOI - PMC - PubMed

Publication types

MeSH terms

Substances

LinkOut - more resources