. 2019 Apr 2;10(1):1489.
doi: 10.1038/s41467-019-09373-w.

Whole genome sequencing of canids reveals genomic regions under selection and variants influencing morphology

Affiliations

Whole genome sequencing of canids reveals genomic regions under selection and variants influencing morphology

Jocelyn Plassais et al. Nat Commun. .

Abstract

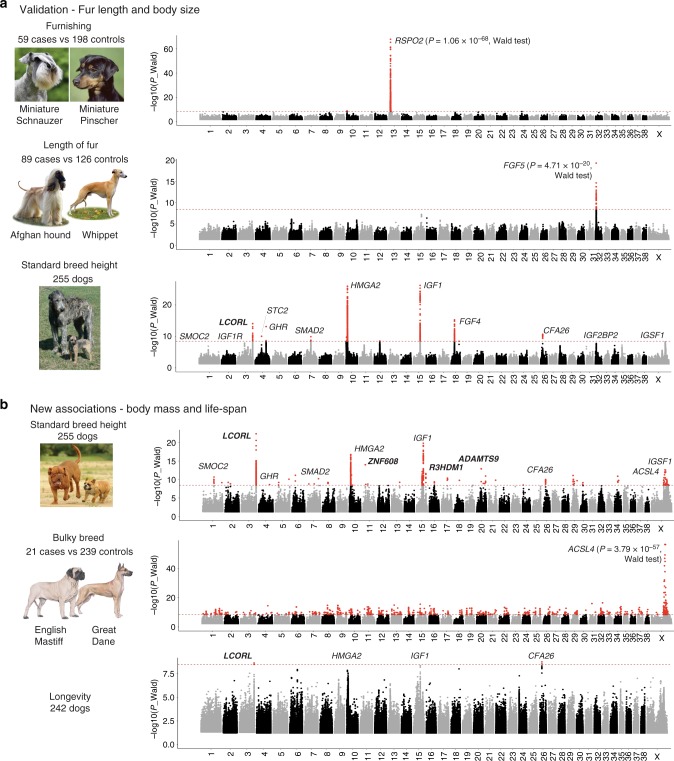
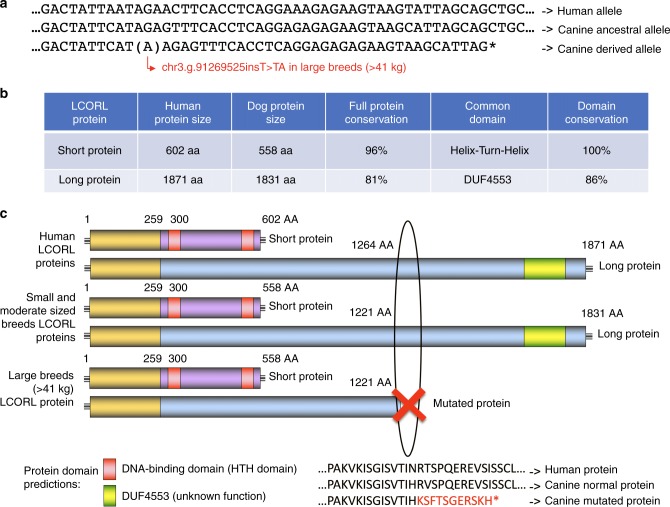
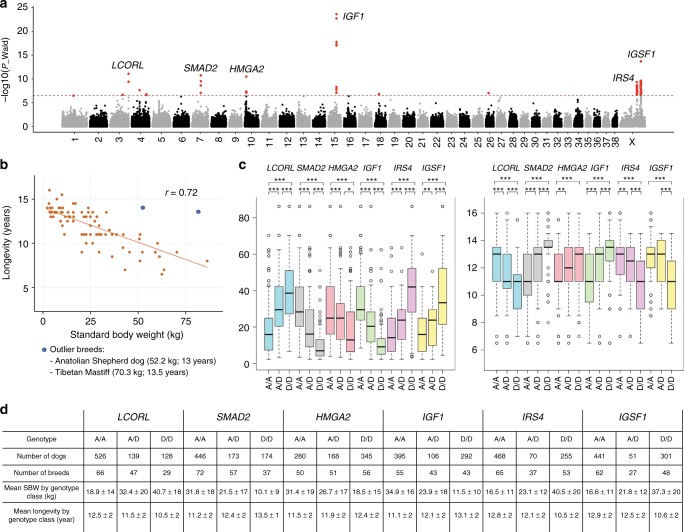
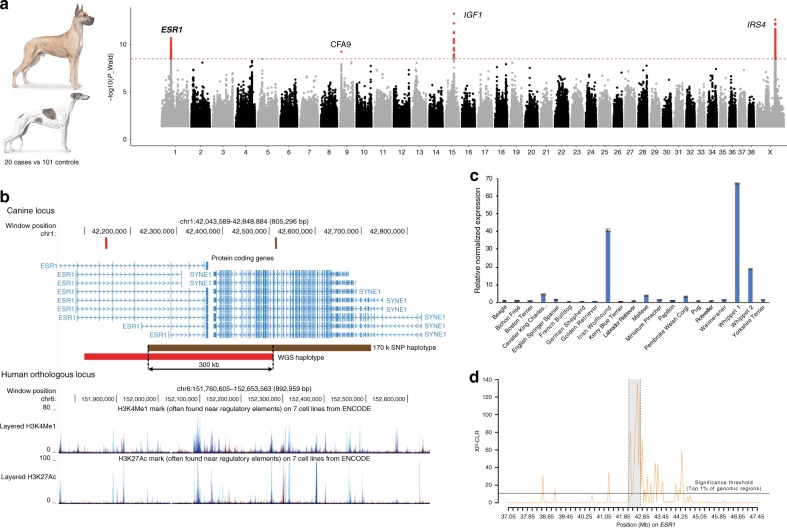
Domestic dog breeds are characterized by an unrivaled diversity of morphologic traits and breed-associated behaviors resulting from human selective pressures. To identify the genetic underpinnings of such traits, we analyze 722 canine whole genome sequences (WGS), documenting over 91 million single nucleotide and small indels, creating a large catalog of genomic variation for a companion animal species. We undertake both selective sweep analyses and genome wide association studies (GWAS) inclusive of over 144 modern breeds, 54 wild canids and a hundred village dogs. Our results identify variants of strong impact associated with 16 phenotypes, including body weight variation which, when combined with existing data, explain greater than 90% of body size variation in dogs. We thus demonstrate that GWAS and selection scans performed with WGS are powerful complementary methods for expanding the utility of companion animal systems for the study of mammalian growth and biology.


Conflict of interest statement

The authors declare no competing interests.

Figures

Fig. 1
Fig. 1
GWAS results for morphological traits in dogs using the canine 722 genome catalog. Manhattan plots showing statistical significance (−log10 scale) for the 30,000 most associated biallelic variants for each canine autosome, and all variants for the X chromosome (X-axis). a Validation of this WGS-GWAS approach using known examples in dogs: presence or absence of moustache and eyebrows, length of fur, and height as a multigenic trait. b Associations identified using body mass including the bulky phenotype and life span. The red line represents the Bonferroni corrected significance threshold (−log10(P) ≃8.46) and variants passing this threshold are colored in red. Candidate genes identified in this study are in bold
Fig. 2
Fig. 2
Identification of LCORL mutation in large breeds and comparison with human. a Comparison of genomic sequences between human and the two canine alleles. A single nucleotide insertion is observed in large breeds (>41 kg). b Conservation of the two main LCORL proteins and their predicted functional domain using SIM and LALNVIEW. c Schematic representations of LCORL proteins, highlighting the effect of the canine mutation (STOP codon after amino acid 1221 leads to a loss of 610 aa). The common part shared by all forms is colored in yellow. Source data are provided as a Source Data file
Fig. 3
Fig. 3
Body mass and longevity analyses using 746 dogs genotyped on 170k SNP markers. a Manhattan plot of the multivariate GWAS for standard breed weight (SBW) and life span corrected by sex, using 746 dogs genotyped on Illumina HD SNP array. The −log10 P values for each SNP are plotted on the y-axis versus each canine autosome and the X-chromosome on the x-axis. The red line represents the Bonferroni corrected significance threshold (−log10(P) = 6.48) and SNPs passing this threshold are colored in red. b Negative correlation between SBW and longevity. In blue, large breed outliers: Anatolian Shepherd Dogs (52.2 kg; 13 years) and Tibetan Mastiff (70.3 kg; 13.5 years) c SBW and longevity (y-axis) of each breed (without outliers) are plotted by genotype at each marker (x-axis). The homozygous D/D alleles have generally a stronger effect on the distribution of SBWs (or longevity) for a given genotype/marker combination (the median and first and third quartiles are indicated by the box-plots). Statistics for each genotype/marker combination are summarized in (d). P values estimated by Mann–Whitney–Wilcoxon tests (*P < 0.05; **P < 0.01; ***P < 0.001). SBWs and longevity of genotype classes are reported as mean ± SD. Source data are provided as a Source Data file
Fig. 4
Fig. 4
ESR1 and the long leg phenotype in dogs. a Manhattan plots showing statistical significance (−log10 scale) for the 30,000 most associated biallelic variants for each canine autosome, and all variants for the X chromosome (X-axis) for the long-leg phenotype observed in Sighthounds, Great Dane, and Great Pyrenees. We distinguish four peaks: one peak pinpointing ESR1 gene on chromosome 1, one locus on CFA9 without any candidate genes in the interval, and IGF1 (CFA15) and IRS4 (CFAX) previously associated with height variation in dogs. Images to the left are Great Dane (top) and Greyhound (bottom). b UCSC genome browser showing the ESR1 locus in dog (top) and human (bottom). Vertical bars correspond to the most associated variants identified with the 722 genomes (in red), and the 855 dogs genotyped on 170k SNP array (in brown), and horizontal bars represent the homozygous haplotype observed. The bottom panel represents the human orthologous locus with tracks corresponding to the H3K4me1 and H3K27ac chromatin signals annotated by the ENCODE project. c Expression level of ESR1 in a panel of 20 breeds, showing high expression in the Sighthounds, Irish Wolfhound and Whippet, in comparison to six different breeds with average leg length. Y-axis represents the relative normalized expression. d XP-CLR plot on ESR1 locus comparing Sighthounds (long legs breeds) with normal-sized legs breeds. We detected a significant selection signature located on ESR1 locus (in grey). Horizontal lines represent the empirical top 1% of genomic regions. Source data are provided as a Source Data file
Fig. 5
Fig. 5
Ear morphology in dogs. a Manhattan plots showing one significant signal on the CFA10 for the drops ears phenotype and another one on chromosome 12 for the large and round ears. b Characteristic breeds representing four different ear shapes observed in dogs: Normal (1,3), large and round (2,4), prick (1,2) or drop (3,4). c UCSC genome browser showing the position on the canine genome (Canfam3.1) of the mutated lincRNA (in red) associated with the drop ears. d Combination of alleles at both loci create four phenotypes. Plus (+) and minus signs (−) indicate the presence or absence of variant (non-ancestral) genotype

References

    1. Boyko AR, et al. A simple genetic architecture underlies morphological variation in dogs. PLoS Biol. 2010;8:e1000451. doi: 10.1371/journal.pbio.1000451. - DOI - PMC - PubMed
    1. vonHoldt BM, et al. Genome-wide SNP and haplotype analyses reveal a rich history underlying dog domestication. Nature. 2010;464:898–902. doi: 10.1038/nature08837. - DOI - PMC - PubMed
    1. Ostrander EA, Wayne RK, Freedman AH, Davis BW. Demographic history, selection and functional diversity of the canine genome. Nat. Rev. Genet. 2017;18:705–720. doi: 10.1038/nrg.2017.67. - DOI - PubMed
    1. Parker HG, et al. Genomic analyses reveal the influence of geographic origin, migration, and hybridization on modern dog breed development. Cell Rep. 2017;19:697–708. doi: 10.1016/j.celrep.2017.03.079. - DOI - PMC - PubMed
    1. American Kennel Club. The Complete Dog Book 20th edn (Ballantine Books, New York, NY, 2006).

Publication types