

Tanycyte-Independent Control of Hypothalamic Leptin Signaling
- PMID: 30941008
- PMCID: PMC6433882
- DOI: 10.3389/fnins.2019.00240
Tanycyte-Independent Control of Hypothalamic Leptin Signaling
Abstract
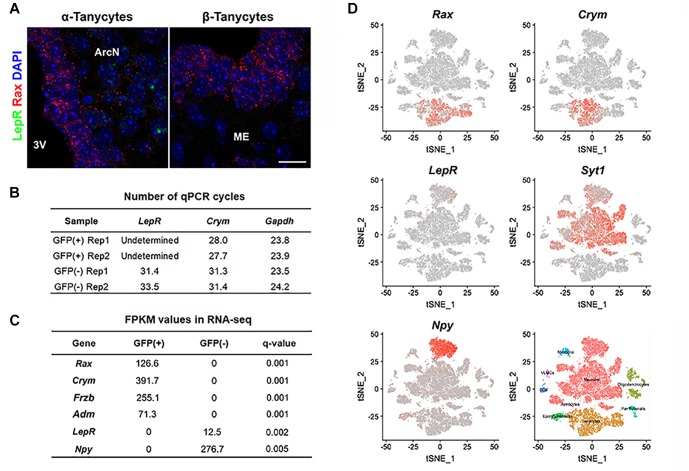
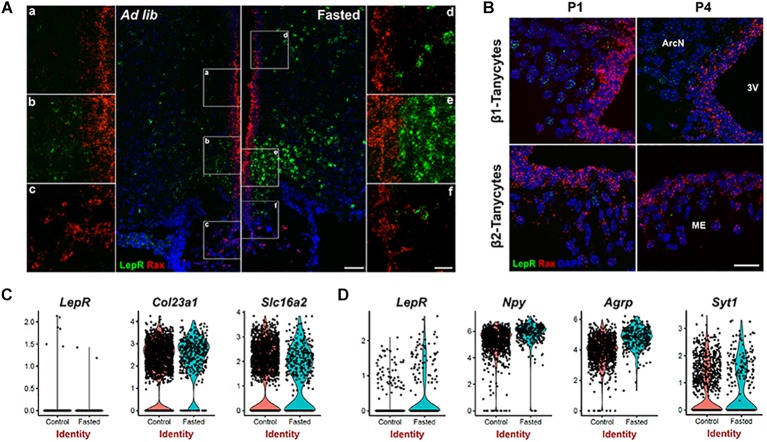
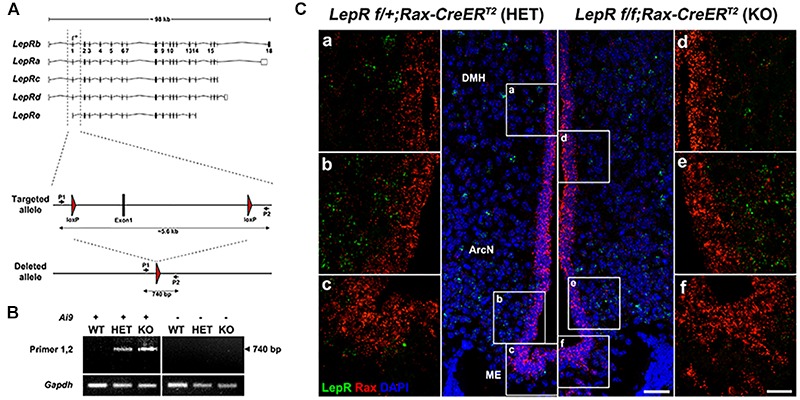
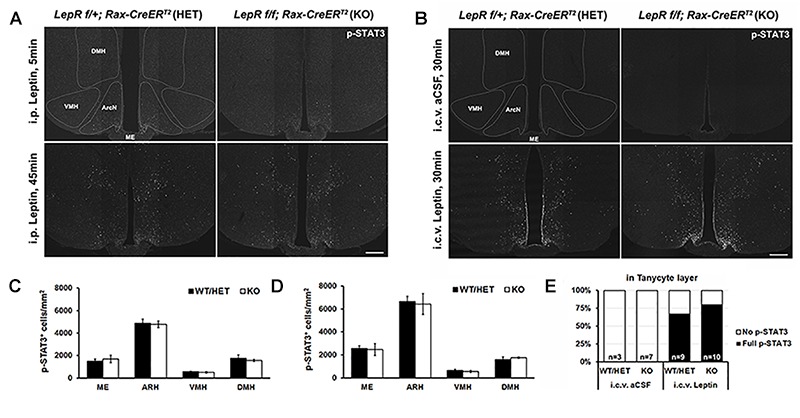
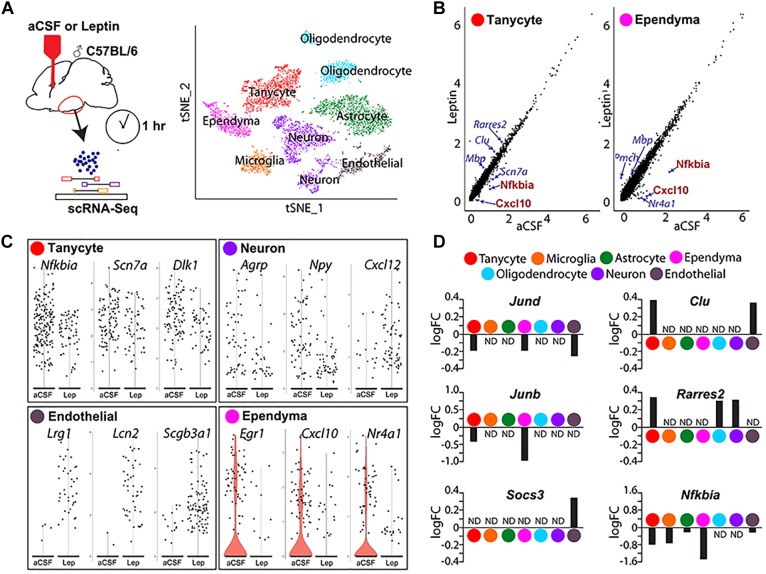
Leptin is secreted by adipocytes to regulate appetite and body weight. Recent studies have reported that tanycytes actively transport circulating leptin across the brain barrier into the hypothalamus, and are required for normal levels of hypothalamic leptin signaling. However, direct evidence for leptin receptor (LepR) expression is lacking, and the effect of tanycyte-specific deletion of LepR has not been investigated. In this study, we analyze the expression and function of the tanycytic LepR in mice. Using single-molecule fluorescent in situ hybridization (smfISH), RT-qPCR, single-cell RNA sequencing (scRNA-Seq), and selective deletion of the LepR in tanycytes, we are unable to detect expression of LepR in the tanycytes. Tanycyte-specific deletion of LepR likewise did not affect leptin-induced pSTAT3 expression in hypothalamic neurons, regardless of whether leptin was delivered by intraperitoneal or intracerebroventricular injection. Finally, we use activity-regulated scRNA-Seq (act-Seq) to comprehensively profile leptin-induced changes in gene expression in all cell types in mediobasal hypothalamus. Clear evidence for leptin signaling is only seen in endothelial cells and subsets of neurons, although virtually all cell types show leptin-induced changes in gene expression. We thus conclude that LepR expression in tanycytes is either absent or undetectably low, that tanycytes do not directly regulate hypothalamic leptin signaling through a LepR-dependent mechanism, and that leptin regulates gene expression in diverse hypothalamic cell types through both direct and indirect mechanisms.
Keywords: hypothalamus; leptin; metabolism and obesity; radial glia; single cell RNA sequencing; tanycyte.
Figures
Similar articles
-
Hypothalamic tanycytes are an ERK-gated conduit for leptin into the brain.Cell Metab. 2014 Feb 4;19(2):293-301. doi: 10.1016/j.cmet.2013.12.015. Cell Metab. 2014. PMID: 24506870 Free PMC article.
-
Loss of Function of the Neural Cell Adhesion Molecule NrCAM Regulates Differentiation, Proliferation and Neurogenesis in Early Postnatal Hypothalamic Tanycytes.Front Neurosci. 2022 Apr 7;16:832961. doi: 10.3389/fnins.2022.832961. eCollection 2022. Front Neurosci. 2022. PMID: 35464310 Free PMC article.
-
Tanycyte ablation in the arcuate nucleus and median eminence increases obesity susceptibility by increasing body fat content in male mice.Glia. 2020 Oct;68(10):1987-2000. doi: 10.1002/glia.23817. Epub 2020 Mar 16. Glia. 2020. PMID: 32173924 Free PMC article.
-
Hypothalamic tanycytes-masters and servants of metabolic, neuroendocrine, and neurogenic functions.Front Neurosci. 2015 Oct 29;9:387. doi: 10.3389/fnins.2015.00387. eCollection 2015. Front Neurosci. 2015. PMID: 26578855 Free PMC article. Review.
-
The Versatile Tanycyte: A Hypothalamic Integrator of Reproduction and Energy Metabolism.Endocr Rev. 2018 Jun 1;39(3):333-368. doi: 10.1210/er.2017-00235. Endocr Rev. 2018. PMID: 29351662 Review.
Cited by
-
Examining the Potential Applicability of Orexigenic and Anorexigenic Peptides in Veterinary Medicine for the Management of Obesity in Companion Animals.Curr Issues Mol Biol. 2024 Jul 1;46(7):6725-6745. doi: 10.3390/cimb46070401. Curr Issues Mol Biol. 2024. PMID: 39057043 Free PMC article. Review.
-
Angiopoietin-Like Growth Factor Involved in Leptin Signaling in the Hypothalamus.Int J Mol Sci. 2021 Mar 26;22(7):3443. doi: 10.3390/ijms22073443. Int J Mol Sci. 2021. PMID: 33810547 Free PMC article.
-
Recent Advances in the Knowledge of the Mechanisms of Leptin Physiology and Actions in Neurological and Metabolic Pathologies.Int J Mol Sci. 2023 Jan 11;24(2):1422. doi: 10.3390/ijms24021422. Int J Mol Sci. 2023. PMID: 36674935 Free PMC article. Review.
-
Tissue-Specific Effects of Leptin on Glucose and Lipid Metabolism.Endocr Rev. 2021 Jan 28;42(1):1-28. doi: 10.1210/endrev/bnaa027. Endocr Rev. 2021. PMID: 33150398 Free PMC article. Review.
-
Leptin Signaling in Obesity and Colorectal Cancer.Int J Mol Sci. 2022 Apr 24;23(9):4713. doi: 10.3390/ijms23094713. Int J Mol Sci. 2022. PMID: 35563103 Free PMC article. Review.
References
-
- Baskin D. G., Seeley R. J., Kuijper J. L., Lok S., Weigle D. S., Erickson J. C., et al. (1998). Increased expression of mRNA for the long form of the leptin receptor in the hypothalamus is associated with leptin hypersensitivity and fasting. Diabetes Metab. Res. Rev. 47 538–543. 10.2337/diabetes.47.4.538 - DOI - PubMed
Grants and funding
LinkOut - more resources
Full Text Sources
Molecular Biology Databases
Miscellaneous