. 2019 Mar 19:10:217.
doi: 10.3389/fpls.2019.00217. eCollection 2019.

Heterologous Expression of Serine Hydroxymethyltransferase-3 From Rice Confers Tolerance to Salinity Stress in E. coli and Arabidopsis

Affiliations

Heterologous Expression of Serine Hydroxymethyltransferase-3 From Rice Confers Tolerance to Salinity Stress in E. coli and Arabidopsis

Pragya Mishra et al. Front Plant Sci. .

Abstract

Among abiotic stresses, salt stress adversely affects growth and development in rice. Contrasting salt tolerant (CSR27), and salt sensitive (MI48) rice varieties provided information on an array of genes that may contribute for salt tolerance of rice. Earlier studies on transcriptome and proteome profiling led to the identification of salt stress-induced serine hydroxymethyltransferase-3 (SHMT3) gene. In the present study, the SHMT3 gene was isolated from salt-tolerant (CSR27) rice. OsSHMT3 exhibited salinity-stress induced accentuated and differential expression levels in different tissues of rice. OsSHMT3 was overexpressed in Escherichia coli and assayed for enzymatic activity and modeling protein structure. Further, Arabidopsis transgenic plants overexpressing OsSHMT3 exhibited tolerance toward salt stress. Comparative analyses of OsSHMT3 vis a vis wild type by ionomic, transcriptomic, and metabolic profiling, protein expression and analysis of various traits revealed a pivotal role of OsSHMT3 in conferring tolerance toward salt stress. The gene can further be used in developing gene-based markers for salt stress to be employed in marker assisted breeding programs.

Highlights: - The study provides information on mechanistic details of serine hydroxymethyl transferase gene for its salt tolerance in rice.

Keywords: Arabidopsis; aquaporins; glycine; rice; salinity; serine.


Figures

FIGURE 1
FIGURE 1
Effect of salt stress on the relative expression levels of OsSHMTs in contrasting sensitive and tolerant rice cultivars. Seedlings (14-day-old) of MI48 and CSR27 were subjected to 150 mM NaCl stress for different time intervals. Real-time PCR analyses were carried out for determining the relative expression levels in the shoot and root of (A) OsSHMT 1–5 after 24 h and (B) OsSHMT3 at different time points. Data (n = 9) represented values that were generated from three independent biological replicates with 3 technical replicate each. Significant difference (one-way ANOVA) between MI48 and CSR27 is indicated with an asterisk (P < 0.05).
FIGURE 2
FIGURE 2
Properties of OsSHMT enzyme. (A) Purification of recombinant OsSHMT. Eluted fractions from Ni-NTA column were analyzed on 10% (w/v) SDS–PAGE. Lanes M: marker; 1: total protein of induced sample; 2: sonicated pellet; 3: sonicated supernatant; 4: flow through; 5–9: elution 1–5 (B) Purified protein (left panel) and its Western blot analysis (right panel) showing the expression of OsSHMT3 using anti-6-His (6X-His tag) secondary antibody (C) Enzyme activity of OsSHMT3 in the presence of tetrahydrofolate (THF) and L-serine (D) THF-dependent per cent relative enzymatic activity of the purified OsSHMT3 was assayed in the presence of different concentrations of NaCl and glycine betaine (GB). The enzyme activity measured at 0 mM NaCl was taken as 100%. (E) 3D structure of OsSHMT3 protein. The modeling was done using modeler software with X-ray crystallographically resolved homologous structure available on PDB database.
FIGURE 3
FIGURE 3
Analysis of OsSHMT3 overexpressing Escherichia coli for salt stress tolerance. E. coli (BL21) cells grown in Luria Broth (LB) medium were subjected to salinity stress (100–500 mM NaCl) and assayed for the concentrations of (A) glycine betaine, (B) choline, (C) glycine, (D) serine, and (E) methionine were quantified. (F) E. coli (BL21) cells were grown in LB medium and the effect of different concentrations of NaCl (100–700 mM NaCl) on their temporal growth profile was assayed at absorbance 620 nm. Values (n = 9) are mean ± SE and different letters on the histograms indicate that the values differ significantly (one-way ANOVA; P < 0.05).
FIGURE 4
FIGURE 4
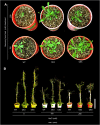
Effect of salt stress on OsSHMT3 overexpressing Arabidopsis. (A) Recovery of wild-type (WT) and OsSHMT3 overexpressing Arabidopsis (OE3 and OE5) after NaCl stress (150 and 200 mM) and their subsequent transfer to the normal condition for 7 days each. (B) WT, OE3 and OE5 were grown for 1 month (up to maturity) in the nutrient solution supplemented with 0 mM (control), 150 and 200 mM NaCl. The experiments were carried out in 3 replicates.
FIGURE 5
FIGURE 5
Effects of OsSHMT3 overexpression in Arabidopsis on morphophysiological, and molecular traits. wild-type and/or Arabidopsis overexpressing OsSHMT3 (OE3 and OE5) were subjected to NaCl stress and/ or subsequently transferred to the recovery medium for documenting (A) dry weight and (B) plant height, were calculated relative to the wild type (C) OsSHMT3 was used as primary antibody to determine the protein expression of OsSHMT3 in different tissues, (D) chlorophyll content, (E) anthocyanin content, (F) photosynthetic yield, (G) ETR, and (H) RWC. Values (n = 9) are mean ± SE and different letters on the histograms indicate that the values differ significantly (P < 0.05). All the data were subjected to two-way ANOVA and significant differences were recorded for within the genotypes and also genotype × environment (salt stress) interactions.
FIGURE 6
FIGURE 6
Concentrations of Na+, K+ in different tissues of the NaCl stressed Arabidopsis overexpressing OsSHMT3. The wild-type, OE3 and OE5 seedlings (14-day-old) were subjected to NaCl stress (100 mM) for 1 week, and different tissues (root, stem and leaf) were harvested for determining the concentration of (A) Na+, and (B) K+ Values (n = 9) are mean ± SE and different letters on the histograms indicate that the values differ significantly (P < 0.05). All the data were subjected to two-way ANOVA and significant differences were recorded for within the genotypes and also genotype × environment (salt stress) interactions.
FIGURE 7
FIGURE 7
Effect of salt stress on the gene expression profiling of wild-type and Arabidopsis overexpressing OsSHMT3. Seedlings (14-day-old), subjected to 100 mM NaCl stress for 24 h, were used for RNA extraction. Venn diagram showing the genes in wild-type and OE5 that are (A) up-regulated, and (B) down-regulated. (C) Seedlings (14-day-old) of the wild-type, OE3 and OE5 were subjected to NaCl (100 mM) stress for 24 h, and the whole seedlings were used for assaying the relative expression of the salt stress responsive genes. Actin was used as an internal control. Values (n = 9) are mean ± SE and different letters on the histograms indicate that the values differ significantly (two-way ANOVA; P < 0.05).

References

    1. Altschul S. F., Madden T. L., Schaffer A. A., Zhang J., Zhang Z., Miller W., et al. (1997). Gapped BLAST and PSI-BLAST: a new generation of protein database search programs. Nucleic Acids Res. 25 3389–3402. - PMC - PubMed
    1. Arzani A., Ashraf M. (2016). Smart engineering of genetic resources for enhanced salinity tolerance in crop plants. Crit. Rev. Plant Sci. 35 146–189. 10.1080/07352689 - DOI
    1. Bahieldin A., Atef A., Edris S., Gadalla N. O., Ali H. M. (2016). Ethylene responsive transcription factor ERF109 retards PCD and improves salt tolerance in plant. BMC Plant Biol. 16:216. 10.1186/s12870-016-0908-z - DOI - PMC - PubMed
    1. Barragan V., Leidi E. O., Andres Z., Rubio L., De Luca A. (2012). Ion exchangers NHX1 and NHX2 mediate active potassium uptake into vacuoles to regulate cell turgor and stomatal function in Arabidopsis. Plant Cell 24 1127–1142. 10.1105/tpc.111.095273 - DOI - PMC - PubMed
    1. Benkert P., Biasini M., Schwede T. (2011). Toward the estimation of the absolute quality of individual protein structure models. Bioinformatics 27 343–350. 10.1093/bioinformatics/btq662 - DOI - PMC - PubMed