

Differential Artery-Vein Analysis Improves the Performance of OCTA Staging of Sickle Cell Retinopathy
- PMID: 30941261
- PMCID: PMC6438106
- DOI: 10.1167/tvst.8.2.3
Differential Artery-Vein Analysis Improves the Performance of OCTA Staging of Sickle Cell Retinopathy
Erratum in
-
Erratum.Transl Vis Sci Technol. 2019 May 2;8(3):9. doi: 10.1167/tvst.8.3.9. eCollection 2019 May. Transl Vis Sci Technol. 2019. PMID: 31110910 Free PMC article.
Abstract
Purpose: We test if differential artery-vein analysis can increase the performance of optical coherence tomography angiography (OCTA) detection and classification of sickle cell retinopathy (SCR).
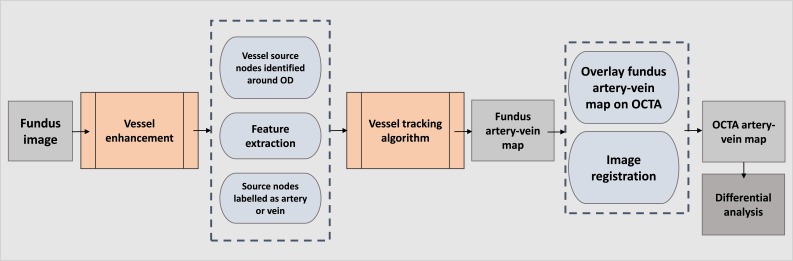
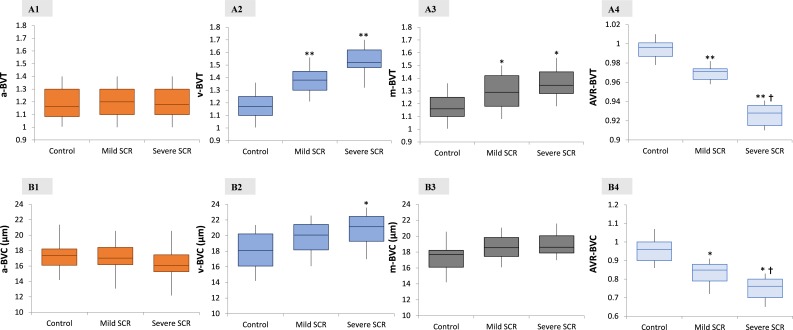
Method: This observational case series was conducted in a tertiary-retina practice. Color fundus and OCTA images were collected from 20 control and 48 SCR subjects. Fundus data were collected from fundus imaging devices, and SD-OCT and corresponding OCTA data were acquired using a spectral-domain OCT (SD-OCT) angiography system. For each patient, color fundus image-guided artery-vein classification was conducted in the OCTA image. Traditional mean blood vessel tortuosity (m-BVT) and mean blood vessel caliber (m-BVC) in OCTA images were quantified for control and SCR groups. Artery BVC (a-BVC), vein BVC (v-BVC), artery BVT (a-BVT), and vein BVT (v-BVT) were calculated; and then the artery-vein ratio of BVC (AVR-BVC) and artery-vein ratio of BVT (AVR-BVT) were quantified for comparative analysis.
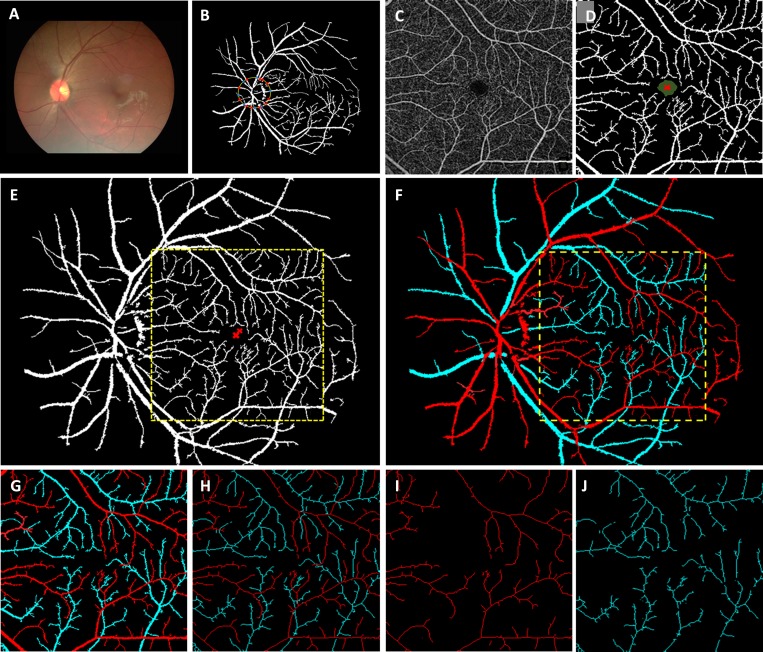
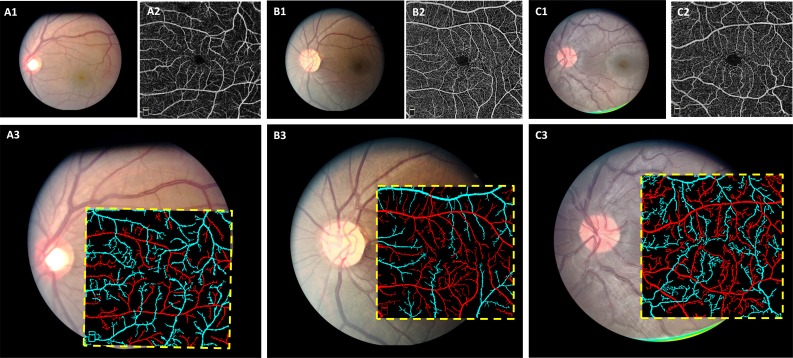
Results: We evaluated 40 control and 85 SCR images in this study. The color fundus image-guided artery-vein classification had 97.02% accuracy for differentiating arteries and veins in OCTA. Differential artery-vein analysis provided significant improvement (P < 0.05) in detecting and classifying SCR stages compared to traditional mean blood vessel analysis. AVR-BVT and AVR-BVC showed significant (P < 0.001) correlation with SCR severity.
Conclusions: Differential artery-vein analysis can significantly improve the performance of OCTA detection and classification of SCR. AVR-BVT is the most sensitive feature that can classify control and mild SCR.
Translational relevance: SCR and other retinovascular diseases result in changes to the caliber and tortuosity appearance of arteries and veins separately. Differential artery-vein analysis can improve the performance of SCR detection and stage classification.
Keywords: optical coherence tomography; quantitative image analysis; retina; retinal vasculature; sicke cell retinopathy.
Figures
References
-
- American Society of Hematology. State of Sickle Cell Disease, 2016 report
Grants and funding
LinkOut - more resources
Full Text Sources
