. 2019 Apr;127(4):46001.
doi: 10.1289/EHP4386.

Environmental Chemicals and Autism: A Scoping Review of the Human and Animal Research

Affiliations

Environmental Chemicals and Autism: A Scoping Review of the Human and Animal Research

Katherine E Pelch et al. Environ Health Perspect. 2019 Apr.

Abstract

Background: Estimates of autism prevalence have increased dramatically over the past two decades. Evidence suggests environmental factors may contribute to the etiology of the disorder.

Objectives: This scoping review aimed to identify and categorize primary research and reviews on the association between prenatal and early postnatal exposure to environmental chemicals and the development of autism in epidemiological studies and rodent models of autism.

Methods: PubMed was searched through 8 February 2018. Included studies assessed exposure to environmental chemicals prior to 2 months of age in humans or 14 d in rodents. Rodent studies were considered relevant if they included at least one measurement of reciprocal social communicative behavior or repetitive and stereotyped behavior. Study details are presented in interactive displays using Tableau Public.

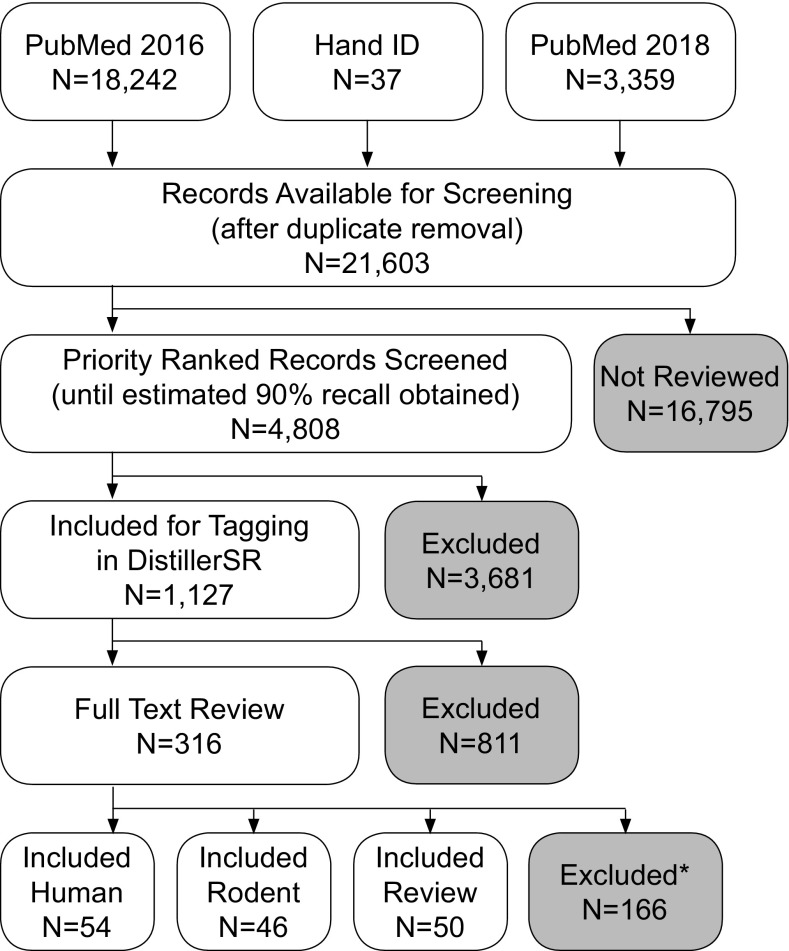
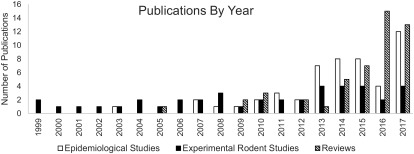
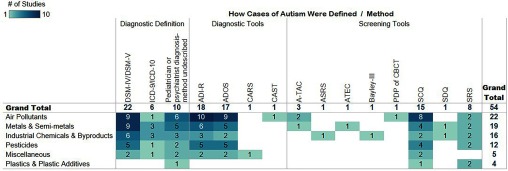
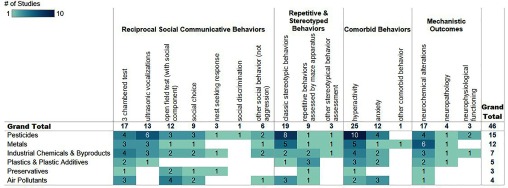
Results: The search returned 21,603 unique studies, of which 54 epidemiological studies, 46 experimental rodent studies, and 50 reviews were deemed relevant, covering 152 chemical exposures. The most frequently studied exposures in humans were particulate matter ([Formula: see text]), mercury ([Formula: see text]), nonspecific air pollution ([Formula: see text]), and lead ([Formula: see text]). In rodent studies, the most frequently studied exposures were chlorpyrifos ([Formula: see text]), mercury ([Formula: see text]), and lead ([Formula: see text]).

Discussion: Although research is growing rapidly, wide variability exists in study design and conduct, exposures investigated, and outcomes assessed. Conclusions focus on recommendations to guide development of best practices in epidemiology and toxicology, including greater harmonization across these fields of research to more quickly and efficiently identify chemicals of concern. In particular, we recommend chlorpyrifos, lead, and polychlorinated biphenyls (PCBs) be systematically reviewed in order to assess their relationship with the development of autism. There is a pressing need to move forward quickly and efficiently to understand environmental influences on autism in order to answer current regulatory questions and inform treatment and prevention efforts. https://doi.org/10.1289/EHP4386.


Figures

Figure 2 is a flowchart describing the number of studies included and/or excluded at each stage of review. The flowchart shows that of 21,638 studies obtained, 54 human, 46 rodent, and 50 reviews were included.
Figure 1.
Flowchart of studies through the review process. This describes the number of studies evaluated at each step of the review process. “Hand ID” are the studies identified by scanning reference lists of included studies. Priority-ranked studies were screened at the title and abstract level in Sciome Workbench for Interactive computer-Facilitated Text-mining (SWIFT) Active Screener. Studies were excluded if they did not pertain to prenatal or very early life exposures and autism in humans or rodent models. At the full-text level, studies were excluded if there was not exposure to environmental chemicals prior to 2 months of age in humans or 14 d in rodents. *Note: Reasons for exclusion at the full-text level can be found in Excel Table S2.
Figure 2 is a bar graph showing publications by year. It plots number of publications (y-axis) ranging between 0 and 16 across the years 1999 to 2017 (x-axis) for epidemiological studies, experimental rodent studies, and reviews.
Figure 2.
Number of studies published by year and type (1999–2017). The number of studies in each evidence stream are shown by year of publication. Note: Five experimental rodent studies published before 1999 are not shown in this figure. One paper was published in each of the following years: 1974, 1979, 1984, 1985, and 1995.
Figure 3 is a tabular representation of a heat map, showing how cases of autism were defined. It has five columns, namely, Number of studies (1 to 10), diagnostic definition, diagnostic tools, screening tools, and grand total. The first column has a row reading Grand total followed by the following six conditions that the study is based on: air pollutants, metals and semi-metals, industrial chemicals and byproducts, pesticides, miscellaneous, and plastics and plastic additives. The last column mentions the grand total of the effects of all the conditions as 54.
Figure 3.
Heat map of included epidemiological studies by exposure (in rows) and how autism was determined within the study (in columns). Numbers within cells indicate the number of studies for a given exposure and method of autism determination. Empty cells indicate a lack of studies. An interactive version of this figure is available at https://public.tableau.com/profile/the.endocrine.disruption.exchange#!/vizhome/Fig3_Enviornmentalchemicalsandautism-epidemiologicaldata/Interactive. For clarity, the different methods of autism determination were collapsed into the following broad categories: used specific diagnostic tools, used specific screening tools, and/or stated that children met either the DSM or ICD criteria. It should be noted that diagnostic tools and screening tools are used by practitioners to reach a DSM or ICD diagnosis, but stating that a DSM or ICD diagnosis was given does not indicate which specific tools were used to reach that conclusion. The 142 specific exposures assessed in the included studies were also collapsed into six broad categories for improved clarity. The categories for types of exposures can be fully expanded in the interactive version of the figure. Additional study information can be found in the interactive Figure S1 and in Excel Table S3. Note: A-TAC: autism tics, ADHD, and other comorbidities inventory; ADIR-R, Autism Diagnostic Interview–Revised; ADOS, Autism Diagnostic Observation Schedules; ASRS, Autism Spectrum Rating Scales; ATEC, Autism Treatment Evaluation Checklist; CARS, Childhood Autism Rating Scale; CAST, Childhood Autism Spectrum Test; DSM, Diagnostic and Statistical Manual of Mental Disorders; ICD, International Statistical Classification of Diseases and Related Health Problems; PDP of CBCT, Pervasive Developmental Problems subscale of the Child Behavior Checklist for Toddlers; SCQ, Social Communication Questionnaire; SDQ, Strengths and Difficulties Questionnaire; SRS, Social Responsiveness Scale.
Figure 4 is a scatterplot showing studies carried out in places both in the USA and outside of the USA. It plots sample size (log scale) (y-axis) ranging between 1 to 100,000 across the five study designs (x-axis).
Figure 4.
Sample size by epidemiological study type. Epidemiological studies are displayed in the scatterplot based on their study design on the x-axis (case–control, nested case–control, population-based case–control, cohort, or prospective cohort) and on the number of study participants on the y-axis (log scale). Studies conducted in the United States are shown as blue circles. Studies conducted outside of the United States are shown as light-teal triangles.
Figure 5 is a tabular representation of a heat map, with six columns, namely, Number of studies (1 to 10), reciprocal social communicative behaviors; repetitive and stereotyped behaviors; comorbid behaviors; mechanistic outcomes; and grand total. The first column has a row reading grand total followed by the following six conditions that the study is based on: pesticides, metals, industrial chemicals and byproducts, plastics and plastic additives, preservatives, and air pollutants. The last column mentions the grand total of the effects of all the conditions as 46.
Figure 5.
Heat map of included rodent studies by exposure (in rows) and types of rodent outcomes (in columns). Numbers within cells indicate the number of studies for a given exposure and outcome. Empty cells indicate a lack of studies. An interactive version of this figure is available at https://public.tableau.com/profile/the.endocrine.disruption.exchange#!/vizhome/SupplementalFigure2_Environmentalchemicalsandautism-rodentdata/Interactive. For clarity, the different outcomes have been collapsed to the four types of outcomes that were captured in this report. Additional study information can be found in the interactive Figure S2 and in Excel Table S4.

Comment in

References

    1. American Psychiatric Association. 1994. Diagnostic and Statistical Manual of Mental Disorders. 4th ed Arlington, VA:American Psychiatric Publishing, Inc.
    1. American Psychiatric Association. 2013. Diagnostic and Statistical Manual of Mental Disorders. 5th ed Washington, DC:American Psychiatric Association.
    1. Arcury TA, Grzywacz JG, Isom S, Whalley LE, Vallejos QM, Chen H, et al. . 2009. Seasonal variation in the measurement of urinary pesticide metabolites among Latino farmworkers in eastern North Carolina. Int J Occup Environ Health 15(4):339–350, PMID: 19886344, 10.1179/oeh.2009.15.4.339. - DOI - PMC - PubMed
    1. Autism and Developmental Disabilities Monitoring Network Surveillance. 2007. Prevalence of autism spectrum disorders–autism and developmental disabilities monitoring network, 14 sites, United States, 2002. MMWR Surveill Summ 56(1):12–28, PMID: 17287715 https://www.cdc.gov/mmwr/preview/mmwrhtml/ss5601a2.htm. - PubMed
    1. Baio J, Wiggins L, Christensen DL, Maenner MJ, Daniels J, Warren Z, et al. . 2018. Prevalence of autism spectrum disorder among children aged 8 years - autism and developmental disabilities monitoring network, 11 sites, United States, 2014. MMWR Surveill Summ 67(6):1–23, PMID: 29701730, 10.15585/mmwr.ss6706a1. - DOI - PMC - PubMed

Publication types

Substances

LinkOut - more resources