. 2019 Apr 1;8(4):giz021.
doi: 10.1093/gigascience/giz021.

TranscriptAchilles: a genome-wide platform to predict isoform biomarkers of gene essentiality in cancer

Affiliations

TranscriptAchilles: a genome-wide platform to predict isoform biomarkers of gene essentiality in cancer

Fernando Carazo et al. Gigascience. .

Abstract

Background: Aberrant alternative splicing plays a key role in cancer development. In recent years, alternative splicing has been used as a prognosis biomarker, a therapy response biomarker, and even as a therapeutic target. Next-generation RNA sequencing has an unprecedented potential to measure the transcriptome. However, due to the complexity of dealing with isoforms, the scientific community has not sufficiently exploited this valuable resource in precision medicine.

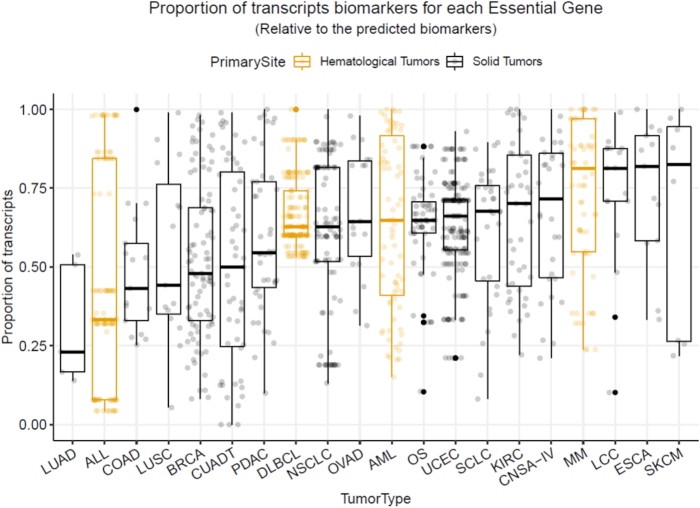
Findings: We present TranscriptAchilles, the first large-scale tool to predict transcript biomarkers associated with gene essentiality in cancer. This application integrates 412 loss-of-function RNA interference screens of >17,000 genes, together with their corresponding whole-transcriptome expression profiling. Using this tool, we have studied which are the cancer subtypes for which alternative splicing plays a significant role to state gene essentiality. In addition, we include a case study of renal cell carcinoma that shows the biological soundness of the results. The databases, the source code, and a guide to build the platform within a Docker container are available at GitLab. The application is also available online.

Conclusions: TranscriptAchilles provides a user-friendly web interface to identify transcript or gene biomarkers of gene essentiality, which could be used as a starting point for a drug development project. This approach opens a wide range of translational applications in cancer.

Keywords: RNA-sequencing; RNAi screen; alternative splicing; biomarker; cancer; gene essentiality; precision medicine; transcriptomics; web tool.


Figures

Figure 1:
Figure 1:
Screenshots of the 3 main tabs of TranscriptAchilles. (1) Selection of cell lines. Both primary site and subtypes can be selected. Two histograms summarize the number of all (up) and selected (down) cell lines. (2) Find Essential Genes. This functionality finds genes whose inhibition reduces the proliferation of the selected cohort. The returned genes are essential, specific, and expressed in the selected cell lines. All the parameters can be tuned with the sliders. A ranking of essential genes and a box plot of essentiality (DEMETER score) for the selected cohort (left) and the rest of cell lines (right) are shown. The red dotted line marks the default essentiality score of –2 dividing the samples into resistant (up) and sensitive (down) to the KD. In this case, the essential gene selected in the ranking table is ITGAV. (3) Predict biomarkers (both transcripts and genes) for the essential genes selected by the user. This analysis can be run for every essential gene in the other tab. The ranking of biomarkers has the following columns: Gene_Ess: essential gene; Gene_bmkr and Transcript_bmkr: gene/transcript expression biomarker; tr: number of transcripts of the corresponding gene; logFC: log2 Fold change of expression; Lfdr: local false discovery rate; Group_bmkr: indicates whether the best biomarker is a gene or a transcript. See legend of Fig. 2 for a more detailed explanation of the plots.
Figure 2:
Figure 2:
Percentage of transcripts predicted to be biomarkers of essential genes in 20 tumor types. Each essential gene has different biomarkers: some of them are genes and others are transcripts. Each point of the box plots represents the proportion of transcript biomarkers for an essential gene for a given tumor type. ALL: acute lymphoblastic leukemia; AML: acute myeloid leukemia; BRCA: breast ductal carcinoma; CNSA-IV: central nervous system astrocytoma grade IV; COAD: colon adenocarcinoma; CUADT: upper aerodigestive tract squamous cell carcinoma; DLBCL: diffuse large B-cell lymphoma; ESCA: esophagus squamous cell carcinoma; KIRC: kidney renal clear cell carcinoma; LCC: lung large cell carcinoma; LUAD: lung adenocarcinoma; LUSC: lung squamous cell carcinoma; MM: multiple myeloma; NSCLC: non–small cell lung carcinoma; OS: osteosarcoma; OVAD: ovary adenocarcinoma; PDAC: pancreas ductal carcinoma; SCLC: small cell lung carcinoma; SKCM: skin carcinoma; UCEC: endometrium adenocarcinoma.
Figure 3:
Figure 3:
Proportion of transcript biotypes of biomarkers in 20 tumor types vs in general. Acronyms are included in Fig. 3 caption. General_biotype shows the proportion of each specific biotype in the reference transcriptome (Gencode 24). Protein-coding transcripts are overrepresented as biomarkers for all tumor types. lincRNA: long intergenic noncoding RNA.
Figure 4:
Figure 4:
Output of TranscriptAchilles in renal carcinoma cell lines (n = 14). HSP90AA1-005 is a transcript biomarker of essentiality of IRAK1. (A) Scatterplot of IRAK1 essentiality and HSP90AA1-005 log2-expression. Each dot represents a single cell line. The dotted black line marks the –2 essentiality threshold. (B) Essentiality of IRAK1. Samples are sorted by their essentiality (more negative implies IRAK1 is more essential). Samples in panels B and C are sorted in the same order. The x-axes are shared by both panels. The black line marks the default essentiality score of –2 dividing the samples into resistant and sensitive to IRAK1 KD. (C) log2-expression of gene HSP90AA1 (black line) and its transcripts. The dotted black line divides cell lines into resistant (left side) and sensitive (right side). The best biomarker (HSP90AA1-005) is shown in pink. In this case, transcript expression provides better essentiality markers than gene expression. (D) Receiver operating characteristic (ROC) curve of the selected biomarker. Here the AUC is 1, but this is not generally the case.
Figure 5:
Figure 5:
TranscriptAchilles’ workflow. Database icons represent CCLE and Project Achilles data. A total of 412 samples were matched between them. Step boxes represent algorithmic analysis, for both preprocessing (grey) and mathematical modeling (red). Green boxes represent applications of TranscriptAchilles. CL: cell line.
Figure 6:
Figure 6:
(A) Histogram of P-values of all tests (both genes and transcripts) taken together. The local FDR and the formula image (the proportion of true null hypotheses) values are shown. (B) Histogram of P-values after splitting by the covariates. The complete histogram in panel A gathers all the histograms in panel B. The covariates are, by rows: the KD genes; and, by columns: whether the biomarker is a gene or a transcript. In KD gene 1, transcripts are better biomarkers than genes (formula image), and vice versa in KD gene n (formula image).

References

    1. Nilsen TW, Graveley BR. Expansion of the eukaryotic proteome by alternative splicing. Nature. 2010;463:457–63. - PMC - PubMed
    1. Park E, Pan Z, Zhang Z, et al. .. The expanding landscape of alternative splicing variation in human populations. Am J Hum Genet. 2018;102(1):11–26. - PMC - PubMed
    1. Sebestyén E, Singh B, Miñana B, et al. .. Large-scale analysis of genome and transcriptome alterations in multiple tumors unveils novel cancer-relevant splicing networks. Genome Res. 2016;26:732–44. - PMC - PubMed
    1. Sveen A, Kilpinen S, Ruusulehto A, et al. .. Aberrant RNA splicing in cancer; expression changes and driver mutations of splicing factor genes. Oncogene. 2015;35:1–15. - PubMed
    1. Ladomery M. Aberrant alternative splicing is another hallmark of cancer. Int J Cell Biol. 2013;2013:463786. - PMC - PubMed

Publication types