

Genetic disruption of Npr1 depletes regulatory T cells and provokes high levels of proinflammatory cytokines and fibrosis in the kidneys of female mutant mice
- PMID: 30943067
- PMCID: PMC6620590
- DOI: 10.1152/ajprenal.00621.2018
Genetic disruption of Npr1 depletes regulatory T cells and provokes high levels of proinflammatory cytokines and fibrosis in the kidneys of female mutant mice
Abstract
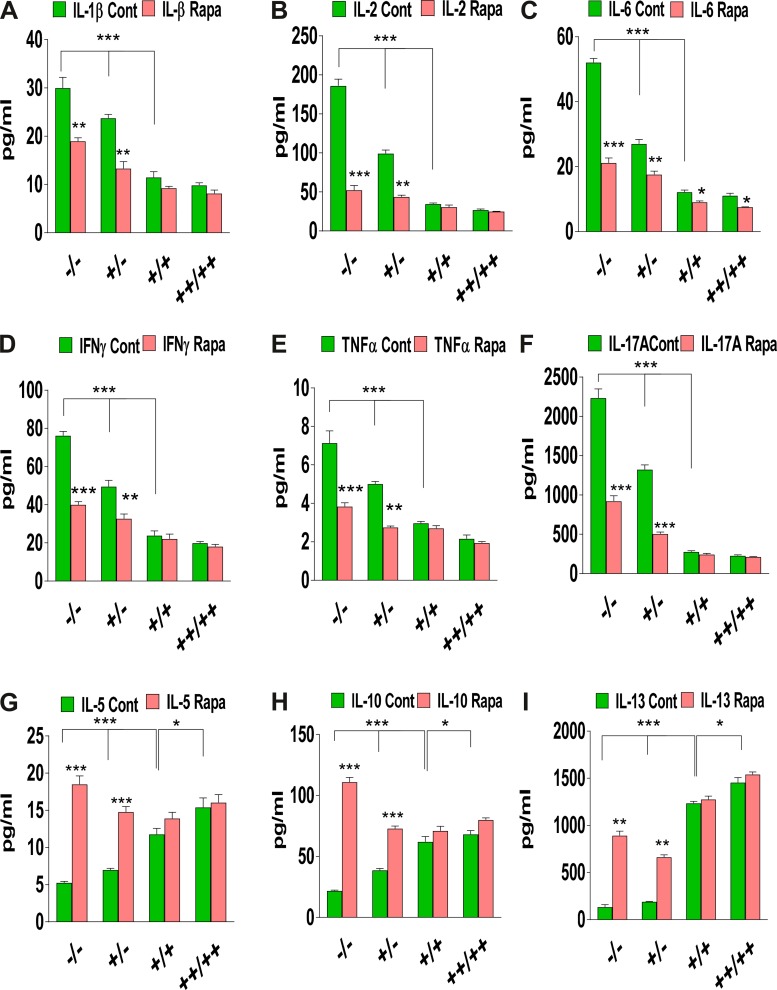
The present study was designed to determine the effects of gene knockout of guanylyl cyclase/natriuretic peptide receptor-A (GC-A/NPRA) on immunogenic responses affecting kidney function and blood pressure (BP) in Npr1 (coding for GC-A/NPRA)-null mutant mice. We used female Npr1 gene-disrupted (Npr1-/-, 0 copy), heterozygous (Npr1+/-, 1 copy), wild-type (Npr1+/+, 2 copy), and gene-duplicated (Npr1++/++, 4 copy) mice. Expression levels of Toll-like receptor (TLR)2/TLR4 mRNA were increased 4- to 5-fold in 1-copy mice and 6- to 10-fold in 0-copy mice; protein levels were increased 2.5- to 3-fold in 1-copy mice and 4- to 5-fold in 0-copy mice. Expression of proinflammatory cytokines and BP was significantly elevated in 1-copy and 0-copy mice compared with 2-copy and 4-copy mice. In addition, 0-copy and 1-copy mice exhibited drastic reductions in regulatory T cells (Tregs). After rapamycin treatment, Tregs were increased by 17% (P < 0.001) in 0-copy mice and 8% (P < 0.001) in 1-copy mice. Renal mRNA and protein levels of TLR2 and TLR4 were decreased by 70% in 0-copy mice and 50% in 1-copy mice. There were significantly higher levels of Tregs and very low levels of TLR2/TLR4 expression in 4-copy mice (P < 0.001). These findings indicate that the disruption of Npr1 in female mice triggers renal immunogenic pathways, which transactivate the expression of proinflammatory cytokines and renal fibrosis with elevated BP in mutant animals. The data suggest that rapamycin treatment attenuates proinflammatory cytokine expression, dramatically increases anti-inflammatory cytokines, and substantially reduces BP and renal fibrosis in mutant animals.
Keywords: cytokines; fibrosis; gene targeting; guanylyl cyclase receptor; natriuretic peptides; rapamycin; regulatory T cells.
Conflict of interest statement
No conflicts of interest, financial or otherwise, are declared by the author(s).
Figures


Similar articles
-
Genetic disruption of guanylyl cyclase/natriuretic peptide receptor-A upregulates renal (pro) renin receptor expression in Npr1 null mutant mice.Peptides. 2019 Apr;114:17-28. doi: 10.1016/j.peptides.2019.03.001. Epub 2019 Apr 6. Peptides. 2019. PMID: 30965084 Free PMC article.
-
Targeted disruption of guanylyl cyclase-A/natriuretic peptide receptor-A gene provokes renal fibrosis and remodeling in null mutant mice: role of proinflammatory cytokines.Endocrinology. 2010 Dec;151(12):5841-50. doi: 10.1210/en.2010-0655. Epub 2010 Sep 29. Endocrinology. 2010. PMID: 20881240 Free PMC article.
-
Inhibition of HDAC enhances STAT acetylation, blocks NF-κB, and suppresses the renal inflammation and fibrosis in Npr1 haplotype male mice.Am J Physiol Renal Physiol. 2017 Sep 1;313(3):F781-F795. doi: 10.1152/ajprenal.00166.2017. Epub 2017 May 31. Am J Physiol Renal Physiol. 2017. PMID: 28566502 Free PMC article.
-
Regulation of cardiac angiotensin-converting enzyme and angiotensin AT1 receptor gene expression in Npr1 gene-disrupted mice.Clin Exp Pharmacol Physiol. 2010 Feb;37(2):e70-7. doi: 10.1111/j.1440-1681.2009.05315.x. Epub 2009 Oct 16. Clin Exp Pharmacol Physiol. 2010. PMID: 19843097 Free PMC article. Review.
-
Molecular and genetic aspects of guanylyl cyclase natriuretic peptide receptor-A in regulation of blood pressure and renal function.Physiol Genomics. 2018 Nov 1;50(11):913-928. doi: 10.1152/physiolgenomics.00083.2018. Epub 2018 Aug 31. Physiol Genomics. 2018. PMID: 30169131 Free PMC article. Review.
Cited by
-
Podocyte cell-specific Npr1 is required for blood pressure and renal homeostasis in male and female mice: role of sex-specific differences.Physiol Genomics. 2024 Oct 1;56(10):672-690. doi: 10.1152/physiolgenomics.00137.2023. Epub 2024 Aug 5. Physiol Genomics. 2024. PMID: 39101921 Free PMC article.
-
Molecular Signaling Mechanisms and Function of Natriuretic Peptide Receptor-A in the Pathophysiology of Cardiovascular Homeostasis.Front Physiol. 2021 Aug 19;12:693099. doi: 10.3389/fphys.2021.693099. eCollection 2021. Front Physiol. 2021. PMID: 34489721 Free PMC article. Review.
-
Investigating the role of NPR1 in dilated cardiomyopathy and its potential as a therapeutic target for glucocorticoid therapy.Front Pharmacol. 2023 Nov 7;14:1290253. doi: 10.3389/fphar.2023.1290253. eCollection 2023. Front Pharmacol. 2023. PMID: 38026943 Free PMC article.
-
Localization of natriuretic peptide receptors A, B, and C in healthy and diseased mouse kidneys.Pflugers Arch. 2023 Mar;475(3):343-360. doi: 10.1007/s00424-022-02774-9. Epub 2022 Dec 8. Pflugers Arch. 2023. PMID: 36480070 Free PMC article.
-
Splenocyte transfer from hypertensive donors eliminates premenopausal female protection from ANG II-induced hypertension.Am J Physiol Renal Physiol. 2022 Mar 1;322(3):F245-F257. doi: 10.1152/ajprenal.00369.2021. Epub 2022 Jan 10. Am J Physiol Renal Physiol. 2022. PMID: 35001661 Free PMC article.
References
-
- Amador CA, Barrientos V, Peña J, Herrada AA, González M, Valdés S, Carrasco L, Alzamora R, Figueroa F, Kalergis AM, Michea L. Spironolactone decreases DOCA-salt-induced organ damage by blocking the activation of T helper 17 and the downregulation of regulatory T lymphocytes. Hypertension 63: 797–803, 2014. doi:10.1161/HYPERTENSIONAHA.113.02883. - DOI - PubMed
-
- Anand-Srivastava MB, Trachte GJ. Atrial natriuretic factor receptors and signal transduction mechanisms. Pharmacol Rev 45: 455–497, 1993. - PubMed
-
- Ba D, Takeichi N, Kodama T, Kobayashi H. Restoration of T cell depression and suppression of blood pressure in spontaneously hypertensive rats (SHR) by thymus grafts or thymus extracts. J Immunol 128: 1211–1216, 1982. - PubMed
Publication types
MeSH terms
Substances
Grants and funding
LinkOut - more resources
Full Text Sources
Other Literature Sources
Molecular Biology Databases
Miscellaneous