. 2019 Apr 2;27(1):238-254.e6.
doi: 10.1016/j.celrep.2019.03.009.

The Hematopoietic Oxidase NOX2 Regulates Self-Renewal of Leukemic Stem Cells

Affiliations

The Hematopoietic Oxidase NOX2 Regulates Self-Renewal of Leukemic Stem Cells

Biniam Adane et al. Cell Rep. .

Abstract

The NADPH-dependent oxidase NOX2 is an important effector of immune cell function, and its activity has been linked to oncogenic signaling. Here, we describe a role for NOX2 in leukemia-initiating stem cell populations (LSCs). In a murine model of leukemia, suppression of NOX2 impaired core metabolism, attenuated disease development, and depleted functionally defined LSCs. Transcriptional analysis of purified LSCs revealed that deficiency of NOX2 collapses the self-renewal program and activates inflammatory and myeloid-differentiation-associated programs. Downstream of NOX2, we identified the forkhead transcription factor FOXC1 as a mediator of the phenotype. Notably, suppression of NOX2 or FOXC1 led to marked differentiation of leukemic blasts. In xenotransplantation models of primary human myeloid leukemia, suppression of either NOX2 or FOXC1 significantly attenuated disease development. Collectively, these findings position NOX2 as a critical regulator of malignant hematopoiesis and highlight the clinical potential of inhibiting NOX2 as a means to target LSCs.

Keywords: CEBPε; FOXC1; NF-κB; NOX2; ROS; acute myeloid leukemia; differentiation; fatty acid oxidation; glycolysis; leukemia stem cells; p22Phox; self-renewal.


Conflict of interest statement

DECLARATION OF INTERESTS

The authors declare no competing interests.

Figures
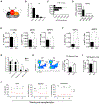
Figure 1.
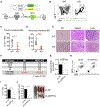
Figure 1.. NOX2 Is Expressed in HSPCs, and Its Deficiency Compromises Steady-State and Regenerative Hematopoiesis
(A) Schematics showing the subunits making up the canonical NADPH oxidase 2 complex. (B) mRNA expression of all 4 murine paralogs of NADPH oxidase genes in purified LSK cells. (C) mRNA expression levels of NOX2 in primitive hematopoietic cells. Data are mined from previously reported RNA-seq results (Cabezas-Wallscheid et al., 2014) (D) mRNA expression of all 4 murine paralogs of NADPH oxidase genes in MPP3 cells. (E) Frequency of LT-HSCs, MPP1, and MPP4 cells in total live BM from age- and sex-matched WT and NOX2 KO mice. n = 8, two independent experiments. (F) Frequency of MPP2 and MPP3 cells in total live BM from age- and sex-matched WT and NOX2 KO mice. n = 8, two independent experiments. (G) Differential cell count on the peripheral blood (PB) of age- and sex-matched WT and NOX2 KO mice. n = 5, representative of 3 independent experiments. (H) Representative flow cytometric plot showing the composition of PB (left) and the frequency of Gr1/CD11b+ myeloid cells in total CD45+ live BM from age- and sex-matched WT and NOX2 KO mice (right). n = 5. (I) Frequency of Gr1/CD11b+ myeloid cells in total CD45+ live BM from age- and sex-matched WT and NOX2 KO mice. n = 5. (J) Competitive transplantation of 500,000 whole BM cells from WT and NOX2 KO mice into irradiated WT recipients. The contribution of donor and competitor cells in PB is shown. Bars represent mean ± SD. *p < 0.05; **p < 0.01; ***p < 0.001; ****p < 0.0001; ns, not significant, unpaired Student’s t test.
Figure 2.
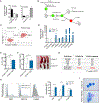
Figure 2.. Deficiency of the NOX2 Complex Attenuates Leukemogenesis In Vivo
(A) Schematics showing retroviral oncogenesis model used to generate murine leukemia. (B) Representative flow cytometric plot showing frequency of leukemic cells in the BM of recipients of primary WT and NOX2 KO leukemia. (C) Frequency of leukemic cells in the BM of primary recipients of leukemic cells. n = 9. (D) Frequency of leukemic cells in the BM of secondary recipients. WT, n = 11; KO, n = 12. (E) Cytospin preparation of PB (left) and H&E staining of sections of spleen (middle) and liver (right) from secondary recipients of WT and NOX2 KO leukemia. Arrows show splenic nodules that are relatively better preserved in KO leukemias. Additional supporting data are presented in Figures S2E and S2F. Scale bars represent 50 μm for PB and 200 μm for spleen and liver. (F) Limiting dilution analysis showing the frequency of leukemia-initiating stem cell populations from secondary WT or NOX2 KO leukemic cells. (G) shRNA-mediated suppression of mRNA expression of the p22Phox subunit of NOX2. (H) Representative flow cytometric plot showing BM disease burden of leukemic cells in recipients of non-targeting shRNA (shNT) and shp22Phox leukemic cells. (I) Frequency of leukemic cells in the BM of recipients of shNT and shp22Phox leukemic cells. n = 10. (J) The weight of spleen extracted from recipients of shNT or shp22Phox leukemia cells (left) and representative images (right). Bars represent mean ± SD. *p < 0.05; **p < 0.01; ***p < 0.001; ****p < 0.0001; ns, not significant, unpaired Student’s t test.
Figure 3.
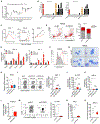
Figure 3.. Suppression of NOX2 Reduces Basal ROS and Impairs Core Metabolism
(A) Representative histogram showing the fluorescence of CellROX within the leukemia-initiating stem cell population (LSC) compartment of leukemic cells (left) and mean fluorescence intensity of CellROX (right). n = 10. (B) Mean fluorescence intensity of CellROX in the lineage-positive compartment of leukemic cells. n = 10. (C) Mean fluorescence intensity of CellROX of the GFP/YFP− (GY−) non-leukemic cells co-inhabiting the bone marrow with eitherWT or NOX2 KO leukemia. n = 10. (D) Relative rate of oxygen consumption in WT and NOX2 KO secondary leukemia cells. (E) Maximal respiration rate of WT and NOX2 KO leukemia cells. (F) Extracellular acidification rates (proxy for glycolytic potential) of WT and NOX2 KO leukemic cells. (D–F) n = 5 technical replicates, representative of 2 independent experiments. (G) Heatmap showing the relative abundance of the most significantly altered metabolites detected in WT and NOX2 KO leukemia cells via mass spectrometry. n = 4 technical replicates. (H) The relative abundance of carnitine-conjugated short-chain free fatty acids from WT and NOX2 KO leukemia cells. (I) The relative rate of tritium-labeled palmitic acid oxidation in WT and NOX2 KO leukemia cells as measured by quantitating the cleavage of radioactive hydrogen via scintillation counts. n = 4 technical replicates. Bars represent mean ± SD. *p < 0.05; **p < 0.01; ***p < 0.001; ****p < 0.0001; ns, not significant, unpaired Student’s t test.
Figure 4.
Figure 4.. NOX2 KO LSCs Lose a Stem Cell-Associated Transcriptional Program and Undergo Terminal Differentiation
(A) Heatmap shows normalized fragments per kilobase of transcript per million mapped reads (FPKM) values of the most significantly dysregulated genes in WT and NOX2 KO LSCs. Log2 values of the fold change for the selected up- and downregulated genes are shown as waterfall bar graphs. (B) The expression level of the indicated genes is measured by qRT-PCR as a validation of the RNA-seq result in an independent cohort of LSCs. Bars represent mean ± SD. *p < 0.05; unpaired Student’s t test. (C) LSCs were sorted from the bone marrow of recipients of shNT and shp22Phox leukemia; n = 10. The relative expression level of several genes was determined by qRT-QPCR. (D) GSEA showing enrichment of LT-HSC program (left) and leukemia stem cell upregulated genes (right) in WT LSCs relative to NOX2 KO LSCs. NES, p value and false discovery rate (FDR) according Subramanian et al. (2005). (E) GSEA showing enrichment of differentiation program (right) and leukemia stem cell downregulated genes (left) in NOX2 KO LSCs relative to WT LSCs. (F) Representative histogram plot showing the relative expression levels of the myeloid surface antigens Gr1, CD11b, and F4/80 in BM explants of WT and NOX2 KO leukemia. (G) Images showing the morphology of WT and NOX2 KO leukemia cells analyzed via May-Grünwald-Giemsa staining. Additional images are shown in Figure S4F. Scale bars represent 10 μm. (H) Relative expression of the myeloid-differentiation-associated surface antigens Gr1, CD11b, and F4/80 in control and shp22Phox leukemia cells harvested from BM. (I) Images showing the morphology of control and p22Phox KD leukemia cells analyzed via May-Grünwald-Giemsa staining. Additional images are shown in Figure S4G.
Figure 5.
Figure 5.. NOX2 Regulates Inflammatory Signaling in Leukemic Cells
(A) GSEA showing the enrichment of NF-κB target genes in NOX2 KO LSCs. (B) GSEA showing the enrichment of components of the JAK-STAT signaling pathway in NOX2 KO LSCs. (C) GSEA showing the enrichment of components of the Toll-like receptor (TLR) signaling pathway in NOX2 KO LSCs. (A–C) NES represents the p value and FDR according to Subramanian et al. (2005). (D) Immunoblot analysis of total and phospho p65(S536), Ikbα3, and total and phospho STAT1(S727) in WT and NOX2 KO leukemia cells treated with control or 10 ng/mL TNF-α for 30 min. GAPDH was used as a loading control. (E) Immunoblot analysis of total and phospho p38 MAPK (Thr180/Tyr182) in WT and NOX2 KO leukemia cells treated with control or 10 ng/mL TNF-α for 30 min. GAPDH was used as a loading control. (F) Immunoblot analysis of total and phospho c-Jun (S73) in WT and NOX2 KO leukemia cells treated with control or 10 ng/mL TNF-α for 30 min. GAPDH was used as a loading control. (G) WT or NOX2 KO cells were cultured in vitro in the presence of increasing doses of TNF-α (left) or lipopolysaccharides (LPSs; right). Cell viability was measured 72 h later with Annexin V, DAPI staining.
Figure 6.
Figure 6.. FOXC1 Regulates Leukemogenesis Downstream of NOX2
(A) Relative mRNA expression level of FOXC1 and CEBPε in the different subpopulations of leukemic cells is shown. LSCs (Sca1+Lin−), progenitor (Sea1−Lin−). (B) Schematic showing the experimental strategy utilized to study the role of FOXC1. (C) Flow cytometric plot showing efficient activation of the CRE recombinase activity reporter td-Tomato in 4-OHT-treated CRE-ERT2-expressing leukemic cells relative to controls. (D) qRT-PCR based measurement of mRNA expression ofthe indicated genes in FOXC1 deleted leukemic cells. (E) The frequency of leukemia cells in the BM of recipients of control or FOXC1-deleted leukemia cells is shown as whiskers minimum-to-maximum plot; the line inside the box represents the mean, and the top and bottom lines represent the 75% and 25% percentiles. The lines above and below represent SD. n = 10. *p < 0.05, unpaired Student’s t test. (F) Weight of spleens (left) and a representative picture of spleens (right) harvested from leukemic mice are shown. (G) Limiting dilution analysis of control and FOXC1-deleted leukemia cells. (H) Representative histogram (left) and mean fluorescence intensity of the relative expression levels of the myeloid surface antigens Gr1, CD11b, and F4/80 in BM explants of control and FOXC1-deleted leukemia. (I) Images showing the morphology of control and FOXC1-deleted leukemia cells analyzed via May-Grünwald-Giemsa staining. Additional images are shown in Figure S6H.
Figure 7.
Figure 7.. NOX2 and FOXC1 Are Important for the Growth of Primary Human Myeloid Leukemia Cells
(A) The Cancer Genome Atlas (TCGA) database for AML was used to analyze the expression levels of several NADPH-dependent oxidases (NOX1–NOX5), accessory subunits (NCF1, NCF2, NCF4, NOXA1, NOXO1, p22Phox, RAC1, and RAC2) as well as related oxido-reductase enzymes (dual-oxidases 1,2, A2). The reads per kilobase of transcript per million mapped reads (RPKM) values for each gene in a total of 188 AMLs are shown. (B) RNA-seq analysis was performed on functionally validated leukemic stem cells isolated from human primary AMLs. The RPKM value for each gene is shown. Unpublished data are used with permission. Additional supporting data are shown in Figure S7A. (C) Equal numbers of control or shNOX2-transduced primary AML cells were cultured in vitro in the presence of 10 ng/mL of IL-3, SCF, and FL3, and the relative percent expansion is reported for each specimen. n = 3, mean ± SD. *p < 0.05; **p < 0.01. (D) Control and shNOX2 primary AML cells were purified and cultured in vitro for 12 days. Annexin V, DAPI staining was performed to evaluate the degree of apoptotic cell death. A representative flow plot (left) and quantitation of 3 technical triplicates (right) are shown. Additional data are shown in Figure S7B. (E) The relative expression level of NOX2, CEBPε, Elane, and CTSG is shown in AML specimens in which NOX2 was knocked down using shRNAs. Additional supporting data are provided in Figure S7D. (F) Histogram showing the relative expression of the myeloid surface antigen CD11b in control and NOX2 KD primary human AML cells cultured in vitro. (G) Images showing the morphology of control and NOX2 KD primary AML cells analyzed via May-Grünwald-Giemsa staining. (H) Relative level of expression of NOX2 is shown in control and shNOX2 primary AML cells used in xenograft analysis. (I) Representative flow cytometric plot showing the level of GFP+ (human leukemic cells bearing control or shNOX2) leukemic cells explanted from the BM of recipient mice (left), and quantitation of the relative normalized engraftment, defined as(% CD45+GFP+ BM at harvest/% CD45+ GFP+ BM pre-transplant) × 100 (right). Data are shown as whiskers minimum-to-maximum plot; the line inside the box represents the mean, and the top and bottom lines represent the 75% and 25% percentiles. The lines above and below represent SD. n = 9. ****p < 0.0001, unpaired Student’s t test. (J) Relative engraftment levels of a bc-CML specimen in which NOX2 is knocked down. (K) Relative engraftment levels of an AML specimen in which NOX2 is knocked down. (L) The relative level of expression of FOXC1 is shown in control and shFOXC1 primary bc-CML specimen used in xenograft analysis. (M) Similar analysis as in (I) but performed for FOXC1 knockdown xenografts of the bc-CML specimen. (N) Relative engraftment levels of control and FOXC1 KD groups in an AML specimen expressing high levels of FOXC1. (O) Relative engraftment levels of control and FOXC1 KD groups in an additional AML specimen expressing high levels of FOXC1.

References

    1. Altenhöfer S, Radermacher KA, Kleikers PW, Wingler K, and Schmidt HH (2015). Evolution of NADPH oxidase inhibitors: selectivity and mechanisms for target engagement. Antioxid. Redox Signal 23, 406–427. - PMC - PubMed
    1. Ashton JM, Balys M, Neering SJ, Hassane DC, Cowley G, Root DE, Miller PG, Ebert BL, McMurray HR, Land H, and Jordan CT (2012). Gene sets identified with oncogene cooperativity analysis regulate in vivo growth and survival of leukemia stem cells. Cell Stem Cell 11, 359–372. - PMC - PubMed
    1. Baillet A, Hograindleur MA, El Benna J, Grichine A, Berthier S, Morel F, and Paclet MH (2017). Unexpected function of the phagocyte NADPH oxidase in supporting hyperglycolysis in stimulated neutrophils: key role of 6-phosphofructo-2-kinase. FASEB J. 31, 663–673. - PubMed
    1. Cabezas-Wallscheid N, Klimmeck D, Hansson J, Lipka DB, Reyes A, Wang Q, Weichenhan D, Lier A, von Paleske L, Renders S, et al. (2014). Identification of regulatory networks in HSCs and their immediate progeny via integrated proteome, transcriptome, and DNA methylome analysis. Cell Stem Cell 15, 507–522. - PubMed
    1. Cancelas JA, Lee AW, Prabhakar R, Stringer KF, Zheng Y, and Williams DA (2005). Rac GTPases differentially integrate signals regulating hematopoietic stem cell localization. Nat. Med 11, 886–891. - PubMed

Publication types