Mus musculus deficient for secretory antibodies show delayed growth with an altered urinary metabolome
- PMID: 30943912
- PMCID: PMC6446318
- DOI: 10.1186/s10020-019-0077-2
Mus musculus deficient for secretory antibodies show delayed growth with an altered urinary metabolome
Abstract
Background: The polymeric immunoglobulin receptor (pIgR) maintains the integrity of epithelial barriers by transporting polymeric antibodies and antigens through the epithelial mucosa into the lumen. In this study, we examined the role of pIgR in maintaining gut barrier integrity, which is important for the normal development in mice.
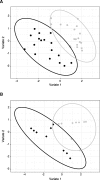
Methods: Cohorts of pIgR-/- mice and their wildtype controls were housed under Specific Pathogen Free (SPF) conditions and monitored for weight gain as an indicator of development over time. The general physiology of the gastrointestinal tract was analysed using immunohistochemistry in young (8-12 weeks of age) and aged mice (up to 18 months of age), and the observed immunopathology in pIgR-/- mice was further characterised using flow cytometry. Urinary metabolites were analysed using gas chromatography-mass spectrometry (GC-MS), which revealed changes in metabolites that correlated with age-related increase in gut permeability in pIgR-/- mice.
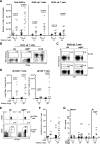
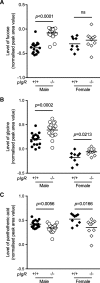
Results: We observed that pIgR-/- mice exhibited delayed growth, and this phenomenon is associated with low-grade gut inflammation that increased with ageing. The gross intraepithelial lymphocytic (IEL) infiltration characteristic of pIgR-/- mice was redefined as CD8α+αβ+ T cells, the majority of which expressed high levels of CD103 and CD69 consistent with tissue resident memory T cells (TRM). Comparison of the urinary metabolome between pIgR-/- and wild-type mice revealed key changes in urinary biomarkers fucose, glycine and Vitamin B5, suggestive of altered mucosal permeability. A significant increase in gut permeability was confirmed by analysing the site-specific uptake of sugar probes in different parts of the intestine.
Conclusion: Our data show that loss of the secretory antibody system in mice results in enhanced accumulation of inflammatory IELs in the gut, which likely reflects ongoing inflammation in reaction to gut microbiota or food antigens, leading to delayed growth in pIgR-/- mice. We demonstrate that this leads to the presence of a unique urinary metabolome profile, which may provide a biomarker for altered gut permeability.
Keywords: Gut; Inflammation; Permeability; SIgA; Tissue resident memory T cells; Urinary biomarker.
Conflict of interest statement
Ethics approval
All animal experiments were approved by The University of Melbourne Animal Ethics Committee, and were compliant with the Prevention of Cruelty to Animals Act (1986) and the National Health and Medical Research Council (NHMRC) Australian Code of Practice for the Care and Use of Animals for Scientific Purposes (1997).
Consent for publication
Not applicable.
Competing interests
The authors declare that they have no competing interests.
Publisher’s Note
Springer Nature remains neutral with regard to jurisdictional claims in published maps and institutional affiliations.
Figures


Similar articles
-
Enhanced differentiation of intraepithelial lymphocytes in the intestine of polymeric immunoglobulin receptor-deficient mice.Immunology. 2015 Sep;146(1):59-69. doi: 10.1111/imm.12480. Epub 2015 Jun 26. Immunology. 2015. PMID: 25967857 Free PMC article.
-
Secretory antibodies reduce systemic antibody responses against the gastrointestinal commensal flora.Int Immunol. 2007 Mar;19(3):257-65. doi: 10.1093/intimm/dxl142. Epub 2007 Jan 24. Int Immunol. 2007. PMID: 17255112
-
Accumulation of intestinal intraepithelial lymphocytes in association with lack of polymeric immunoglobulin receptor.Eur J Immunol. 2005 Apr;35(4):1211-9. doi: 10.1002/eji.200425627. Eur J Immunol. 2005. PMID: 15770700
-
Possible transport routes of IgM to the gut of teleost fish.Fish Shellfish Immunol. 2024 Jun;149:109583. doi: 10.1016/j.fsi.2024.109583. Epub 2024 Apr 23. Fish Shellfish Immunol. 2024. PMID: 38657879 Review.
-
The polymeric immunoglobulin receptor: bridging innate and adaptive immune responses at mucosal surfaces.Immunol Rev. 2005 Aug;206:83-99. doi: 10.1111/j.0105-2896.2005.00278.x. Immunol Rev. 2005. PMID: 16048543 Review.
Cited by
-
When secretion turns into excretion - the different roles of IgA.Front Immunol. 2022 Dec 21;13:1076312. doi: 10.3389/fimmu.2022.1076312. eCollection 2022. Front Immunol. 2022. PMID: 36618388 Free PMC article. Review.
-
EpCAM Is Essential to Maintaining the Immune Homeostasis of Intestines via Keeping the Expression of pIgR in the Intestinal Epithelium of Mice.Front Immunol. 2022 Apr 13;13:843378. doi: 10.3389/fimmu.2022.843378. eCollection 2022. Front Immunol. 2022. PMID: 35493520 Free PMC article.
References
Publication types
MeSH terms
Substances
LinkOut - more resources
Full Text Sources
Medical
Research Materials
Miscellaneous

