. 2019 May 17;294(20):8101-8122.
doi: 10.1074/jbc.RA119.007808. Epub 2019 Apr 3.

Flavonoids enhance rod opsin stability, folding, and self-association by directly binding to ligand-free opsin and modulating its conformation

Affiliations

Flavonoids enhance rod opsin stability, folding, and self-association by directly binding to ligand-free opsin and modulating its conformation

Joseph T Ortega et al. J Biol Chem. .

Abstract

Rhodopsin (Rho) is a visual G protein-coupled receptor expressed in the rod photoreceptors of the eye, where it mediates transmission of a light signal into a cell and converts this signal into a nerve impulse. More than 100 mutations in Rho are linked to various ocular impairments, including retinitis pigmentosa (RP). Accordingly, much effort has been directed toward developing ligands that target Rho and improve its folding and stability. Natural compounds may provide another viable approach to such drug discovery efforts. The dietary polyphenol compounds, ubiquitously present in fruits and vegetables, have beneficial effects in several eye diseases. However, the underlying mechanism of their activity is not fully understood. In this study, we used a combination of computational methods, biochemical and biophysical approaches, including bioluminescence resonance energy transfer, and mammalian cell expression systems to clarify the effects of four common bioactive flavonoids (quercetin, myricetin, and their mono-glycosylated forms quercetin-3-rhamnoside and myricetrin) on rod opsin stability, function, and membrane organization. We observed that by directly interacting with ligand-free opsin, flavonoids modulate its conformation, thereby causing faster entry of the retinal chromophore into its binding pocket. Moreover, flavonoids significantly increased opsin stability, most likely by introducing structural rigidity and promoting receptor self-association within the biological membranes. Of note, the binding of flavonoids to an RP-linked P23H opsin variant partially restored its normal cellular trafficking. Together, our results suggest that flavonoids could be utilized as lead compounds in the development of effective nonretinoid therapeutics for managing RP-related retinopathies.

Keywords: G protein-coupled receptor (GPCR); eye disease; flavonoid; oligomerization; opsin; photoreception; receptor; regeneration; rhodopsin; stability.


Conflict of interest statement

The authors declare that they have no conflicts of interest with the contents of this article

Figures
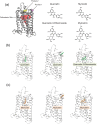
Figure 1.
Figure 1.
Bioinformatic analysis of the interaction between bovine rod opsin and the flavonoids. a, assessment of the potential flavonoid-binding sites within the bovine rod opsin structure (PDB code 3CAP) performed with the CASTp 3.0 software is shown on the left. These binding sites were co-validated using a blind docking approach. Three potential binding sites were found: 1) the orthosteric site or retinal-binding site (shown in red); 2) the external binding site between TM5, TM6, and ECL2 pocket 1 (shown in purple); and 3) the external binding site between TM2, TM3, and ECL1, pocket 2 (shown in yellow). The binding energies for each binding site calculated were as follows: 1) −9.3 kcal/mol; 2) −7.9 kcal/mol; and 3) −6.5 kcal/mol. Chemical structures of quercetin, quercetin-3-rhamnoside, myricetin, and myricetrin are shown on the right. b, molecular docking of quercetin into the orthosteric-binding pocket (left) and pocket 2 (middle), and docking of quercetin-3-rhamnoside into the orthosteric-binding pocket (right) of rod opsin. c, molecular docking of myricetin into the orthosteric-binding pocket (left) and pocket 2 (middle), and docking of myricetrin into the orthosteric-binding pocket (right) of rod opsin. Quercetin and myricetin could accommodate the retinal-binding pocket and the external binding pocket located between TM5, TM6, and EC L2, whereas their glycosylated forms quercetin-3-rhamnoside and myricetrin could accommodate only into the retinal-binding pocket.
Figure 2.
Figure 2.
Two-dimensional representation of the interactions between flavonoids and specific residues in the protein side chains. In the orthosteric-binding pocket, the flavonoid compounds form hydrogen bond interactions with the following residues: Ala-117, Thr-118, Glu-122, Glu-181, Ile-189, Tyr-191, Tyr-192, and Lys-296 and in the external pocket 1 with Thr-193, Glu-196, Tyr-191, Asn-199, Glu-201, and Gln-279. The main electrostatic interactions within the orthosteric-binding pocket involve Ala-117, Glu-181, Tyr-191, Tyr-192, Trp-265, Tyr-268, Ala-292, Pro-291, and Lys-296, and in the external pocket 1 with Pro-194, Glu-196, Glu-201, and Phe-276. The 2D representations of the low energy structures obtained from the docking simulation were visualized with the Biovia Discovery Studio Visualizer 17.2.0 software.
Figure 3.
Figure 3.
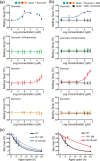
Effect of flavonoids on thermal stability of opsin and isoRho. a, opsin membranes were incubated with increasing concentrations (0.01, 0.1, 1, 10, 100, 250, and 500 μm) of quercetin, quercetin 3-rhamnoside, myricetin, or myricetrin for 1 h at room temperature. After that, the temperature of melting was determined by using a fluorescence BFC probe. Opsin membranes not incubated with flavonoids, and opsin membranes incubated with 9-cis-retinal were used as controls. The values of fluorescence were plotted as a function of temperature, and the melting temperature was calculated using Prism GraphPad 7.04 software. The derived melting temperature for each experimental condition is shown as a function of concentration. The values of the melting temperatures derived for nontreated controls (opsin and isoRho) were 55.4 ± 0.4 and 72.1 ± 1.2 °C, respectively. This experiment was repeated three times. Error bars represent standard deviation (S.D.). All values of the melting temperatures derived from these experiments and statistical significance of the effect of flavonoids are shown in Table 2. b, opsin membranes were incubated with different concentrations (1, 10, 100, 250, and 500 μm) of quercetin, quercetin-3-rhamnoside, myricetin, or myricetrin for 1 h at room temperature and then regenerated with 10 μm 9-cis-retinal (color), or isoRho was regenerated first, and then membranes were incubated with the flavonoid compounds (black). The melting temperature was determined in these samples by using a BFC fluorescence probe. These experiments were performed in triplicate. Error bars represent S.D. All values of the melting temperatures derived from these experiments and statistical significance of the effect of flavonoids are shown in Table 3. c, regeneration of isoRho from aged opsin. Opsin-containing membranes were incubated with quercetin or myricetin for 1 h on ice, solubilized with DDM, and then kept at room temperature for 2, 4, 6, or 24 h before regeneration with 10 μm 9-cis-retinal for 1 h. The percentage of regenerated isoRho was calculated. The regeneration of isoRho at time 0 h was set as 100%. NT, nontreated; 9cR, treated with 9-cis-retinal; Q-1, treated with 1 μm quercetin; Q-100, treated with 100 μm quercetin; M-1, treated with 1 μm myricetin; M-100, treated with 100 μm myricetin. These experiments were performed in triplicate. Error bars represent S.D. The statistical significance of the effect of flavonoids on the stability of aged opsin as compared with nontreated control was as follows: at 2 h for Q-1 and Q-100, p ≤ 0.001 and p = NS (not significant); for M-1 and M-100, p ≤ 0.05 and p = NS (not significant); at 4 h for Q-1 and Q-100, p ≤ 0.001 and p = NS; for M-1 and M-100, p = NS and p ≤ 0.001; at 6 h for Q-1 and Q-100, p ≤ 0.0001 and p ≤ 0.005; for M-1 and M-100, p ≤ 0.05 and p ≤ 0.001; at 24 h for Q-1 and Q-100, p = NS and p = NS, for M-1 and M-100, p = NS and p ≤ 0.0001.
Figure 4.
Figure 4.
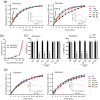
Regeneration of isoRho in the presence of flavonoids. The regeneration of isoRho was determined upon prior incubation of the opsin membranes with quercetin, quercetin 3-rhamnoside, myricetin, and myricetrin at different concentrations (1, 10, 100, 250, and 500 μm). Changes in the absorption maximum were plotted as a function of time. Saturation was reached at 20 min, and the absorption maximum at this time point was assumed to be 100%. Insets, the half-times (t½) of regeneration were plotted as a function of the flavonoid concentration. Error bars represent S.D. All values of t½ derived from these experiments and statistical significance of the effect of flavonoids are shown in Table 4.
Figure 5.
Figure 5.
Effect of flavonoids on the chromophore-binding pocket in rod opsin. The binding of flavonoids into the retinal-binding pocket of opsin was determined by quenching of the intrinsic Trp fluorescence upon addition of increasing concentrations (1, 10, 100, 250, and 500 μm) of quercetin, quercetin-3-rhamnoside, myricetin, or myricetrin, to the opsin membranes (blue). After incubation with the flavonoid compound (at each concentration), 10 μm 9-cis-retinal was added, and the Trp fluorescence was recorded (red). These measurements were performed in triplicate. Error bars represent S.D.
Figure 6.
Figure 6.
Spectral properties of flavonoid-bound isoRho and detection of flavonoids. a, UV-visible spectra of isoRho regenerated with 10 μm 9-cis-retinal after incubation of the opsin membranes with different concentrations of flavonoids and purified by 1D4 affinity chromatography are shown. b, spectral properties of flavonoid-bound opsin. UV-visible spectra of opsin samples after incubation of the opsin membranes with different concentrations of quercetin or myricetin, followed by their purification by 1D4 affinity chromatography are shown. c, detection of quercetin and myricetin in purified isoRho samples. Extracted flavonoids were separated by using reverse phase-HPLC and identified by comparison to the HPLC profile of quercetin and myricetin standards. These experiments were performed in triplicate.
Figure 7.
Figure 7.
Effect of bound flavonoids on isoRho functional properties. a, Gt activation by flavonoid-bound isoRho. Opsin membranes incubated with quercetin or myricetin at different concentrations followed by regeneration with 10 μm 9-cis-retinal were solubilized with DDM and then applied to immunoaffinity purification. Gt activation by photoactivated flavonoid-bound isoRho was recorded as an increase of the intrinsic Trp fluorescence and plotted as a function of time. The pseudo first-order kinetic rates (k) of Gt activation were derived from the function A(t) = Amax(1−expkt), where Amax is the maximal Gt fluorescence change, and A(t) is the relative fluorescence change at time t. Each measurement was repeated three times. Error bars represent S.D. All values of k derived from these experiments and statistical significance of the effect of flavonoids are shown in Table 5. b, cytotoxicity of quercetin (blue) and myricetin (red) on HEK-293S GnTI cells stably expressing WT opsin was determined by using the MTT assay. The cells were treated with flavonoid compounds at concentrations within a range of 0–1000 μm for 24 h. The results are expressed as a percentage of cytotoxic effect compared with nontreated control cells. c, effect of quercetin and myricetin on light-stimulated accumulation of cAMP in cells expressing opsin. HEK-293S GnTI cells stably expressing WT opsin were incubated with the flavonoid compounds overnight and then 9-cis-retinal 2 h before the measurement. Forskolin was added to the cells to saturate their cAMP levels followed by light illumination. Control cells, nontreated with flavonoids, or 9-cis-retinal underwent the same procedure. cAMP levels were detected as described under “Experimental procedures.” Each condition was performed in triplicate, and the experiment was repeated twice. Error bars represent S.D. Statistically significant effect of flavonoid was denoted with asterisks (***, p ≤ 0.0001). NT, nontreated; 9cR, treated with 9-cis-retinal; Q-1, treated with 1 μm quercetin; Q-100, treated with 100 μm quercetin; M-1, treated with 1 μm myricetin; M-100, treated with 100 μm myricetin. d, Meta II decay of flavonoid-bound isoRho. Opsin within membranes was incubated with quercetin, quercetin-3-rhamnoside, myricetin, or myricetrin followed by its regeneration with 10 μm 9-cis-retinal and then immunoaffinity-purified. The chromophore release (Meta II decay) of flavonoid-bound isoRho after light illumination for 15 s is shown as a change in the intrinsic Trp fluorescence at 330 nm plotted as a function of time. These experiments were performed in triplicate. Insets, the rates (τ) of regeneration plotted as a function of the flavonoid concentration. Error bars represent S.D. All values of τ derived from these experiments and statistical significance of the effect of flavonoids are shown in Table 6.
Figure 8.
Figure 8.
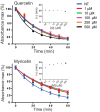
Thermal stability of isoRho regenerated after incubation of the opsin membranes with flavonoids. Thermal stability of isoRho regenerated followed by an incubation of the opsin membranes with quercetin or myricetin at different concentrations (1, 10, 100, 250, and 500 μm) was determined in the immunoaffinity-purified samples. Samples were incubated at 55 °C in the dark, and their absorbance spectra were recorded every 5 min for 60 min. The changes in the absorbance maximum were calculated as a percentage of residual pigment assuming the absorbance at the initial point as 100%. The changes were plotted as a function of time, and the half-lives (t½) of chromophore release were calculated using these plots. These measurements were performed in triplicate. Error bars represent S.D.
Figure 9.
Figure 9.
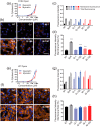
Effect of flavonoids on opsin membrane localization. a, cytotoxicity of quercetin (blue) and myricetin (red) on NIH-3T3 cells stably expressing P23H rod opsin was determined by using the MTT assay. The cells were treated with flavonoid compounds at concentrations within a range of 0–1000 μm for 24 h. The results are expressed as a percentage of cytotoxic effect compared with nontreated control cells. b, fluorescence images of the NIH-3T3 cells expressing P23H rod opsin mutant treated either with quercetin or myricetin (at a final concentration of 1 or 100 μm) or 5 μm 9-cis-retinal for 16 h. The images were taken with a high-content imaging operetta microscope at ×20 magnification. Scale bar, 50 μm. To detect opsin at the plasma membrane, cells were immunostained with B6-30 antibody recognizing opsin's N terminus and Alexa Fluor 594-labeled secondary antibody (orange). The nuclei of the cells were stained with DAPI (blue). c, quantification of the fluorescence intensity in the plasma membrane and the total fluorescence intensity in cells expressing P23H rod opsin mutant. d, ratio of the fluorescence intensity at the plasma membrane and the total fluorescence in cells expressing P23H rod opsin mutant. Statistically significant change in the fluorescence intensity is shown with asterisks (***, p ≤ 0.0001). e, cytotoxicity of quercetin (blue) and myricetin (red) on NIH-3T3 cells expressing WT rod opsin was determined by using the MTT assay. The cells were treated with flavonoid compounds at concentrations within a range of 0–1000 μm for 24 h. The results are expressed as a percentage of cytotoxic effect compared with nontreated control cells. f, fluorescence images of the NIH-3T3 cells expressing WT rod opsin treated either with quercetin or myricetin (at a final concentration of 1 or 100 μm) or 5 μm 9-cis-retinal for 16 h. The images were taken with a high-content imaging operetta microscope at ×20 magnification. Scale bar, 50 μm. To detect opsin at the plasma membrane, cells were immunostained with B6-30 antibody recognizing opsin's N terminus and Alexa Fluor 594–labeled secondary antibody (orange). The nuclei of the cells were stained with DAPI (blue). g, quantification of the fluorescence intensity in the plasma membrane and the total fluorescence intensity in cells expressing WT rod opsin. h, ratio of the fluorescence intensity in the plasma membrane and the total fluorescence in cells expressing WT opsin. NT, nontreated; 9cR, treated with 9-cis-retinal; Q-1, treated with 1 μm quercetin; Q-100, treated with 100 μm quercetin; M-1, treated with 1 μm myricetin; M-100, treated with 100 μm myricetin. Error bars represent S.D.
Figure 10.
Figure 10.
Effect of flavonoids on the glycosylation pattern of P23H rod opsin mutant and WT rod opsin. NIH-3T3 cells stably expressing the P23H rod opsin mutant were treated either with quercetin (a) or myricetin (b) at 1 or 100 μm final concentration or 5 μm 9-cis-retinal for 16 h. NIH-3T3 cells stably expressing WT rod opsin were treated either with quercetin (c) or myricetin (d) at 1 or 100 μm final concentration, or 5 μm 9-cis-retinal for 16 h. The cells were lysed, and 50 μg of total protein were separated using SDS-polyacrylamide gel, followed by transfer to polyvinyl difluoride membrane. Opsin was detected with the 1D4 anti-Rho C-terminal antibody (top panels). Anti-GAPDH antibody was used as a loading control (bottom panels). Samples were either deglycosylated with PNGaseF prior to the loading onto the gel or not. The experiment was repeated three times. These are representative immunoblots. NT, nontreated; 9cR, treated with 9-cis-retinal; Q-1, treated with 1 μm quercetin; Q-100, treated with 100 μm quercetin; M-1, treated with 1 μm myricetin; M-100, treated with 100 μm myricetin.
Figure 11.
Figure 11.
Effect of flavonoids on rod opsin dimerization/oligomerization within the cell membrane. a, effect of flavonoids on rod opsin membrane dimerization was tested with the BRET assay. The BRET signal was recorded in HEK-293 cells stably expressing both mouse opsin·Rluc and opsin·Venus, which were incubated with quercetin or myricetin at a concentration of 100 μm for 2, 4, 8, or 16 h. To disrupt opsin dimerization, DDM at 5 or 0.5 mm was added to the cell suspension prior to the BRET measurements. The results are expressed as net BRET for each condition. b, alternatively, isoRho was regenerated with 5 μm 9-cis-retinal for 2 h before the treatment with flavonoid compounds for 2 or 16 h. DDM at 5 mm concentration was added to the cell suspension to disrupt opsin dimerization prior to the BRET measurements. c, effect of flavonoids on the BRET signal in transiently transfected HEK-293 cells with different donor to acceptor ratios. The BRET signal was recorded in HEK-293 cells transiently transfected with opsin·Rluc (donor) and opsin·Venus (acceptor) constructs at different donor to acceptor ratios (1:2, 1:4, 1:6, and 1:8). Twenty four hours post-transfection, cells were incubated or not with flavonoids at a concentration of 100 μm for 16 h and then the BRET signal was measured in the cell suspension in each condition. d, time-dependent effects of flavonoids on the BRET signal in HEK-293 cells transiently transfected with opsin·Rluc and opsin·Venus constructs at a 1:4 donor to acceptor ratio. Twenty four hours after transfection, these cells were incubated with quercetin or myricetin at a concentration of 100 μm for 2, 4, 8, or 16 h, and then the BRET signal was recorded in the cell suspension. To disrupt opsin dimerization, DDM at 5 mm was added to the cell suspension prior to the BRET measurements. e, specificity of the flavonoid-related effect on opsin–opsin interaction. The BRET signal was recorded in HEK-293 cells transiently transfected with opsin·Rluc (donor) only or in cells co-transfected with opsin·Rluc (donor) and Kras·Venus (acceptor) constructs used as a negative control and compared with the BRET signal recorded in cells co-transfected with opsin·Rluc (donor) and opsin·Venus (acceptor). The BRET signal detected in cells co-expressing opsin·Rluc and Kras·Venus was due to co-localization in the cell membrane and was much smaller than BRET detected in cells co-expressing opsin·Rluc and opsin·Venus. No effect of flavonoids on the BRET signal in cells co-expressing opsin·Rluc and Kras·Venus was detected. The results are shown as the BRET1 signal or NET BRET (ΔBRET). BRET was calculated as the emission ratio at 530 and 480 nm. Net BRET was calculated as the emission ratio at 530 and 480 nm (BRET1 signal) subtracted by the emission of donor only at 480 nm. ΔBRET = (530/480 ratio − 480 nm). Each experiment was performed in triplicate. Error bars represent S.D. Statistically significant change in BRET was indicated with asterisks. *, p ≤ 0.05; **, p ≤ 0.001; ***, p ≤ 0.0001.

References

    1. Jastrzebska B. (2013) GPCR: G protein complexes–the fundamental signaling assembly. Amino Acids 45, 1303–1314 10.1007/s00726-013-1593-y - DOI - PMC - PubMed
    1. Christopoulos A. (2014) Advances in G protein-coupled receptor allostery: from function to structure. Mol. Pharmacol. 86, 463–478 10.1124/mol.114.094342 - DOI - PubMed
    1. Erlandson S. C., McMahon C., and Kruse A. C. (2018) Structural basis for G protein-coupled receptor signaling. Annu. Rev. Biophys. 2018 10.1146/annurev-biophys-070317-032931 - DOI - PubMed
    1. Hilger D., Masureel M., and Kobilka B. K. (2018) Structure and dynamics of GPCR signaling complexes. Nat. Struct. Mol. Biol. 25, 4–12 10.1038/s41594-017-0011-7 - DOI - PMC - PubMed
    1. Rask-Andersen M., Almén M. S., and Schiöth H. B. (2011) Trends in the exploitation of novel drug targets. Nat. Rev. Drug Discov. 10, 579–590 10.1038/nrd3478 - DOI - PubMed

Publication types

Associated data

LinkOut - more resources