. 2019 May 29;93(12):e02238-18.
doi: 10.1128/JVI.02238-18. Print 2019 Jun 15.

Reconstruction of the Genetic History and the Current Spread of HIV-1 Subtype A in Germany

Affiliations

Reconstruction of the Genetic History and the Current Spread of HIV-1 Subtype A in Germany

Kirsten Hanke et al. J Virol. .

Abstract

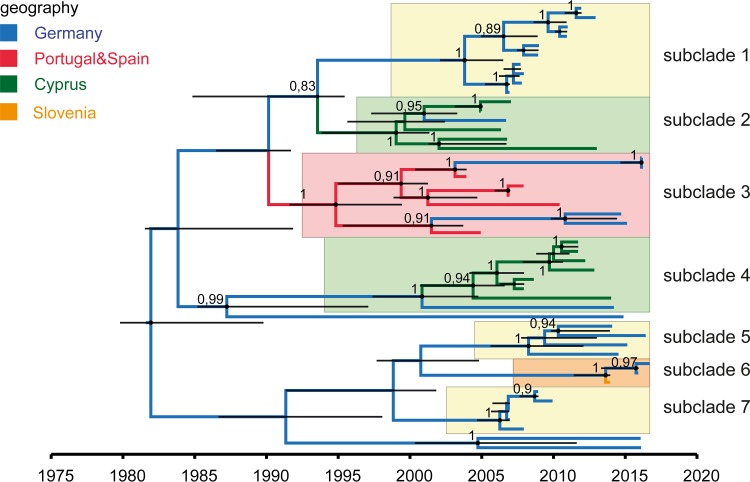
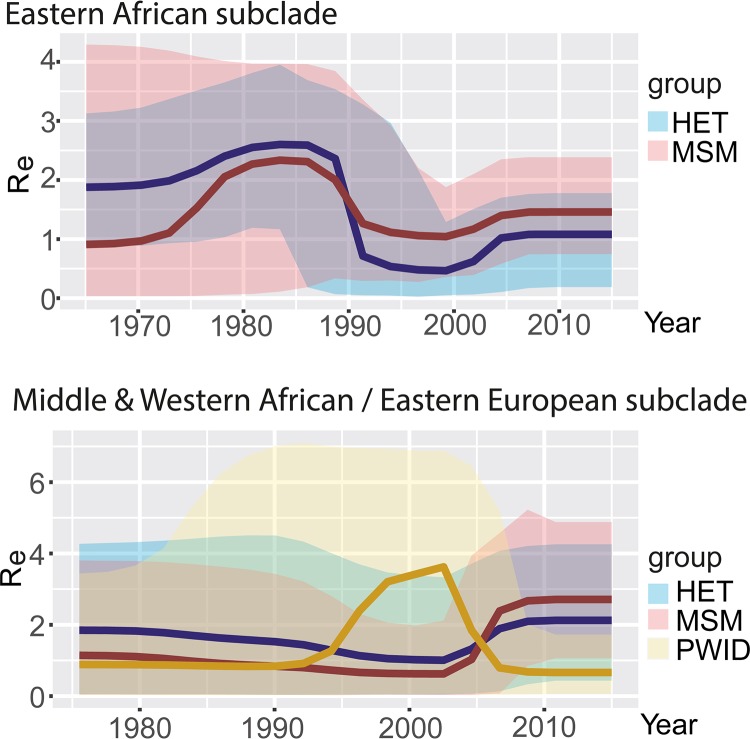
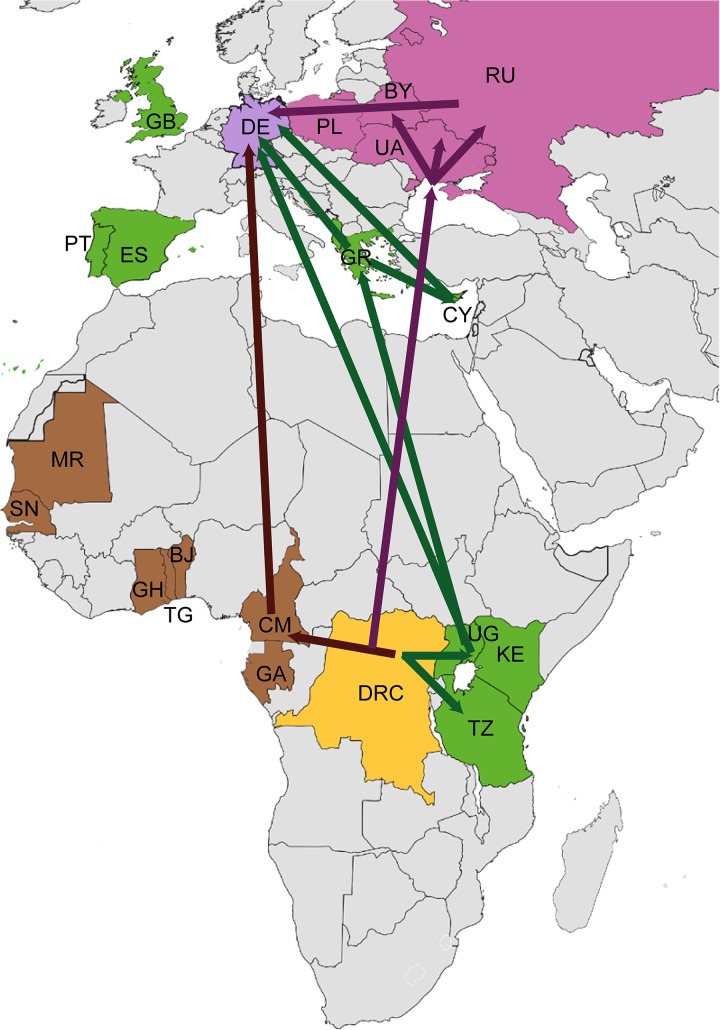
HIV-1 non-B infections have been increasing in Europe for several years. In Germany, subtype A belongs to the most abundant non-B subtypes showing an increasing prevalence of 8.3% among new infections in 2016. Here we trace the origin and examine the current spread of the German HIV-1 subtype A epidemic. Bayesian coalescence and birth-death analyses were performed with 180 German HIV-1 pol sequences and 528 related and publicly available sequences to reconstruct the population dynamics and fluctuations for each of the transmission groups. Our reconstructions indicate two distinct sources of the German subtype A epidemic, with an Eastern European and an Eastern African lineage both cocirculating in the country. A total of 13 German-origin clusters were identified; among these, 6 clusters showed recent activity. Introductions leading to further countrywide spread originated predominantly from Eastern Africa when introduced before 2005. Since 2005, however, spreading introductions have occurred exclusively within the Eastern European clade. Moreover, we observed changes in the main route of subtype A transmission. The beginning of the German epidemic (1985 to 1995) was dominated by heterosexual transmission of the Eastern African lineage. Since 2005, transmissions among German men who have sex with men (MSM) have been increasing and have been associated with the Eastern European lineage. Infections among people who inject drugs dominated between 1998 and 2005. Our findings on HIV-1 subtype A infections provide new insights into the spread of this virus and extend the understanding of the HIV epidemic in Germany.IMPORTANCE HIV-1 subtype A is the second most prevalent subtype worldwide, with a high prevalence in Eastern Africa and Eastern Europe. However, an increase of non-B infections, including subtype A infections, has been observed in Germany and other European countries. There has simultaneously been an increased flow of refugees into Europe and especially into Germany, raising the question of whether the surge in non-B infections resulted from this increased immigration or whether German transmission chains are mainly involved. This study is the first comprehensive subtype A study from a western European country analyzing in detail its phylogenetic origin, the impact of various transmission routes, and its current spread. The results and conclusions presented provide new and substantial insights for virologists, epidemiologists, and the general public health sector. In this regard, they should be useful to those authorities responsible for developing public health intervention strategies to combat the further spread of HIV/AIDS.

Keywords: Germany; HIV-1; phylogeography; reproduction numbers; risk groups; spread; subtype A; transmission cluster.


Figures

FIG 1
FIG 1
Time-scaled phylogeographic analysis reveals at least two different origins of the German HIV-1A epidemic. German samples and their 10 closest related sequences found by BLAST search (data set A) were used to construct the MCC tree. (A) Sampling locations and the inferred origin of the most recent common ancestor (MRCA) computed by discrete asymmetric trait analysis are color-coded. The node size reflects posterior probabilities. Curly braces mark the Middle and Western African and Eastern European subclade as well as the Eastern African subclade. German-origin clusters are highlighted and numbered. *, active clades; the dotted vertical line indicates the threshold for active clades (at least two introductions per cluster after 2012). The data table describes the labeled nodes. 95% HPD, highest posterior density interval. (B) Time-scaled MCC tree with discrete risk group analysis reveals distinct clusters for most transmission routes. The estimated risk group of the MRCA is color-coded. Posterior probabilities of >0.95 are marked by circles at nodes according to their value. The inset depicts the number of clusters per mean edge distance. A distance of 20 years, a posterior probability of >0.99, and a geographic probability of >0.99 were used to identify transmission clusters (TC) with German origin (highlighted in yellow and red). Roman numerals label the 14 TC fulfilling all criteria. German-origin clusters not fulfilling the distance criteria are highlighted in blue. The three TC that are parts of a bigger German-origin cluster are highlighted in red. HET, heterosexual contacts; MSM, men having sex with men; PWID, people who inject drugs; HPL, high-prevalence country.
FIG 2
FIG 2
Bayesian skygrid and BDSKY analysis reveal two spatiotemporal independent subepidemics. (A) Epidemiologically unlinked samples from the Eastern African (gray curve) and Eastern European subclade (red) were analyzed separately. The logarithmic effective number of infections (Ne) × viral generation time (t) representing effective transmissions is plotted over time. 95% HPD intervals are plotted in lighter colors. (B) Estimation of Re by BDSKY analysis of the two German subepidemics using only RKI samples. Gray, samples belonging to the Eastern African variant; red, samples belonging to the Middle and Western African/Eastern European variant. (C) Time of the most recent common ancestor (tMRCA) of the German-origin clusters. Clusters within the Eastern African clade are colored in gray. Clusters within the Eastern European subclade are colored in red. 95% HPDs are depicted as bars. Small shapes represent inactive clades without recent spread. Larger shapes represent active clades with at least two infections since 2012. The shape of the cluster icon depicts the transmission route within each cluster. Squares, MSM; triangles, HET; circles, mixed clades with PWID. (D) Proportion of risk groups in all German-origin clusters (left) compared to the still active clades (right).
FIG 3
FIG 3
MCC tree of cluster 9* within the Eastern African clade reveals seven subclades. The estimated geographic locations of the MRCA are color-coded. The various subclades are highlighted. Yellow, German clusters; green, Cyprian clades; red, cluster with Spanish, Portuguese, and German sequences; orange, mixed cluster with German and Slovenian sequences. Posterior probabilities of >0.8 are depicted at nodes. Node bars (black) indicate 95% HPDs.
FIG 4
FIG 4
Multitype birth-death (BDMM) analysis according to transmission routes and virus origin reveals a change in the impact of transmission routes over time. Changes in the Res for each transmission group in each subclade are depicted. (Upper graph) RKI sequences clustering in the Eastern African clade. (Lower graph) Res according to risk groups for RKI sequences from the Middle and Western African/Eastern European clade.
FIG 5
FIG 5
Level of drug resistance mutations in RKI samples: transmitted surveillance drug resistance mutations (SDRM) in therapy-naive RKI samples.
FIG 6
FIG 6
Scheme of the geographic spread of HIV-1 subtype A to Germany. The subtype A origin lies in the region of today’s Democratic Republic of Congo (DRC; yellow). Subsequent spread occurred in two spatiotemporal independent routes. The first was to Eastern African countries (colored in green), such as Tanzania (TZ), Kenya (KE), and Uganda (UG), as marked by green arrows. From here spread to Germany occurred directly or indirectly (i.e., via Greece [GR] and Cyprus [CY] and GR and Albania [AL]). Other countries, such as Great Britain (GB), Portugal (PT), and Spain (ES), might also be involved but to a lesser extent. The second subtype A lineage spread from Middle and Western Africa directly (brown arrow) or indirectly via countries of the former Soviet Union (purple arrows), such as Ukraine (UA), the Russian Federation (RU), Belarus (BY), and, to a lesser extent, Poland (PL). The map was colored and modified with Adobe Illustrator and Photoshop according to our findings and published analyses by other groups (7, 8, 13, 14, 35, 74, 75) using a blank map from Wikipedia Commons (public domain).

References

    1. Tebit DM, Arts EJ. 2011. Tracking a century of global expansion and evolution of HIV to drive understanding and to combat disease. Lancet Infect Dis 11:45–56. doi:10.1016/S1473-3099(10)70186-9. - DOI - PubMed
    1. ECDC. 2018. European Centre for Disease Prevention and Control: HIV/AIDS surveillance in Europe 2018-2017 data, annual HIV/AIDS surveillance reports. https://ecdc.europa.eu/en/publications-data/hivaids-surveillance-europe-.... Accessed 18 December 2018.
    1. UNAIDS. 2018. Fact sheet. World AIDS Day 2018. http://www.unaids.org/sites/default/files/media_asset/UNAIDS_FactSheet_e.... Accessed 12 May 2018.
    1. Robert Koch Institute. 2018. HIV-Jahresbericht 2017. Epid Bull. https://www.rki.de/DE/Content/Infekt/EpidBull/Archiv/2018/Ausgaben/47_18.... Accessed 18 December 2018.
    1. Chan PA, Hogan JW, Huang A, DeLong A, Salemi M, Mayer KH, Kantor R. 2015. Phylogenetic investigation of a statewide HIV-1 epidemic reveals ongoing and active transmission networks among men who have sex with men. J Acquir Immune Defic Syndr 70:428–435. doi:10.1097/QAI.0000000000000786. - DOI - PMC - PubMed

Publication types