Extreme mechanical diversity of human telomeric DNA revealed by fluorescence-force spectroscopy
- PMID: 30944218
- PMCID: PMC6486787
- DOI: 10.1073/pnas.1815162116
Extreme mechanical diversity of human telomeric DNA revealed by fluorescence-force spectroscopy
Abstract
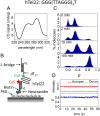
G-quadruplexes (GQs) can adopt diverse structures and are functionally implicated in transcription, replication, translation, and maintenance of telomere. Their conformational diversity under physiological levels of mechanical stress, however, is poorly understood. We used single-molecule fluorescence-force spectroscopy that combines fluorescence resonance energy transfer with optical tweezers to measure human telomeric sequences under tension. Abrupt GQ unfolding with K+ in solution occurred at as many as four discrete levels of force. Added to an ultrastable state and a gradually unfolding state, there were six mechanically distinct structures. Extreme mechanical diversity was also observed with Na+, although GQs were mechanically weaker. Our ability to detect small conformational changes at low forces enabled the determination of refolding forces of about 2 pN. Refolding was rapid and stochastically redistributed molecules to mechanically distinct states. A single guanine-to-thymine substitution mutant required much higher ion concentrations to display GQ-like unfolding and refolded via intermediates, contrary to the wild type. Contradicting an earlier proposal, truncation to three hexanucleotide repeats resulted in a single-stranded DNA-like mechanical behavior under all conditions, indicating that at least four repeats are required to form mechanically stable structures.
Keywords: G-quadruplex; fluorescence resonance energy transfer; optical tweezers; single-molecule biophysics.
Conflict of interest statement
The authors declare no conflict of interest.
Figures


Similar articles
-
Streamlining effects of extra telomeric repeat on telomeric DNA folding revealed by fluorescence-force spectroscopy.Nucleic Acids Res. 2019 Dec 2;47(21):11044-11056. doi: 10.1093/nar/gkz906. Nucleic Acids Res. 2019. PMID: 31617570 Free PMC article.
-
Structural diversity and extreme stability of unimolecular Oxytricha nova telomeric G-quadruplex.Biochemistry. 2008 Mar 18;47(11):3389-96. doi: 10.1021/bi702013d. Epub 2008 Feb 26. Biochemistry. 2008. PMID: 18298084
-
Mechanical unfolding of human telomere G-quadruplex DNA probed by integrated fluorescence and magnetic tweezers spectroscopy.Nucleic Acids Res. 2013 Feb 1;41(4):2746-55. doi: 10.1093/nar/gks1341. Epub 2013 Jan 8. Nucleic Acids Res. 2013. PMID: 23303789 Free PMC article.
-
Folding of guanine quadruplex molecules-funnel-like mechanism or kinetic partitioning? An overview from MD simulation studies.Biochim Biophys Acta Gen Subj. 2017 May;1861(5 Pt B):1246-1263. doi: 10.1016/j.bbagen.2016.12.008. Epub 2016 Dec 13. Biochim Biophys Acta Gen Subj. 2017. PMID: 27979677 Review.
-
Fluorescence resonance energy transfer in the studies of guanine quadruplexes.Methods Mol Biol. 2006;335:311-41. doi: 10.1385/1-59745-069-3:311. Methods Mol Biol. 2006. PMID: 16785636 Review.
Cited by
-
Streamlining effects of extra telomeric repeat on telomeric DNA folding revealed by fluorescence-force spectroscopy.Nucleic Acids Res. 2019 Dec 2;47(21):11044-11056. doi: 10.1093/nar/gkz906. Nucleic Acids Res. 2019. PMID: 31617570 Free PMC article.
-
Complexity of Guanine Quadruplex Unfolding Pathways Revealed by Atomistic Pulling Simulations.J Chem Inf Model. 2023 Aug 14;63(15):4716-4731. doi: 10.1021/acs.jcim.3c00171. Epub 2023 Jul 17. J Chem Inf Model. 2023. PMID: 37458574 Free PMC article.
-
Mechanical diversity and folding intermediates of parallel-stranded G-quadruplexes with a bulge.Nucleic Acids Res. 2021 Jul 9;49(12):7179-7188. doi: 10.1093/nar/gkab531. Nucleic Acids Res. 2021. PMID: 34139007 Free PMC article.
-
Optical tweezers in single-molecule biophysics.Nat Rev Methods Primers. 2021;1:25. doi: 10.1038/s43586-021-00021-6. Epub 2021 Mar 25. Nat Rev Methods Primers. 2021. PMID: 34849486 Free PMC article.
-
Mechanical Stability and Unfolding Pathways of Parallel Tetrameric G-Quadruplexes Probed by Pulling Simulations.J Chem Inf Model. 2024 May 13;64(9):3896-3911. doi: 10.1021/acs.jcim.4c00227. Epub 2024 Apr 17. J Chem Inf Model. 2024. PMID: 38630447 Free PMC article.
References
Publication types
MeSH terms
Substances
Grants and funding
LinkOut - more resources
Full Text Sources

