. 2019 Apr 16;116(16):7941-7950.
doi: 10.1073/pnas.1818281116. Epub 2019 Apr 3.

Hierarchy of clinical manifestations in SAVI N153S and V154M mouse models

Affiliations

Hierarchy of clinical manifestations in SAVI N153S and V154M mouse models

Mona Motwani et al. Proc Natl Acad Sci U S A. .

Abstract

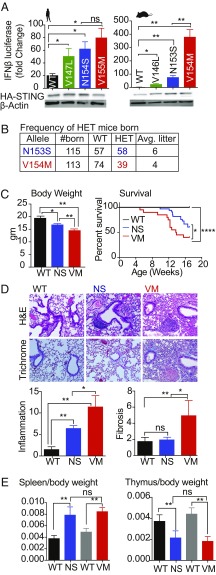
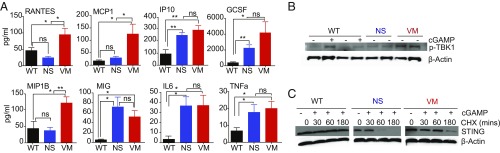
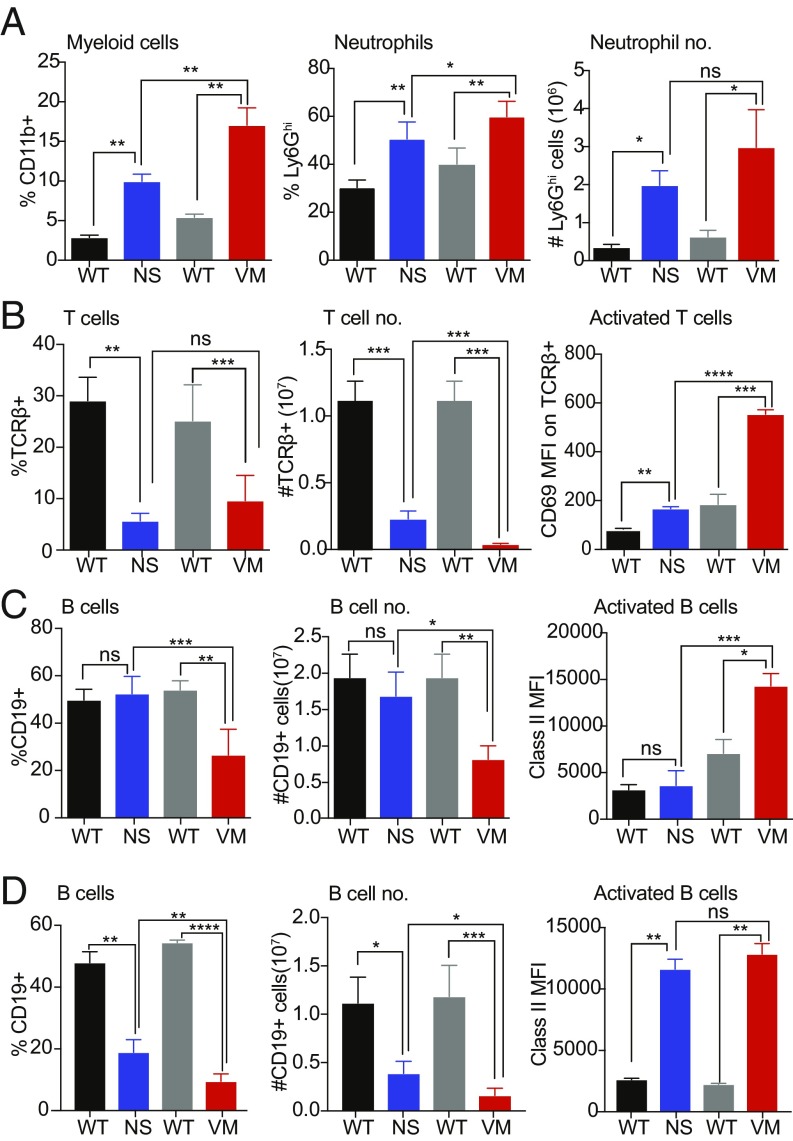
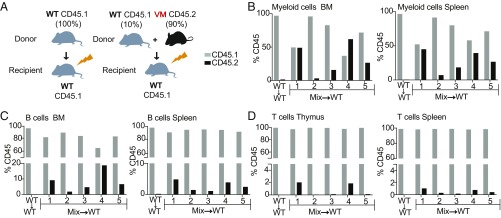
Studies over the past decade have revealed a central role for innate immune sensors in autoimmune and autoinflammatory diseases. cGAS, a cytosolic DNA sensor, detects both foreign and host DNA and generates a second-messenger cGAMP, which in turn binds and activates stimulator of IFN genes (STING), leading to induction of type I interferons and inflammatory cytokines. Recently, gain-of-function mutations in STING have been identified in patients with STING-associated vasculopathy with onset in infancy (SAVI). SAVI patients present with early-onset systemic inflammation and interstitial lung disease, resulting in pulmonary fibrosis and respiratory failure. Here, we describe two independent SAVI mouse models, harboring the two most common mutations found in patients. A direct comparison of these strains reveals a hierarchy of immune abnormalities, lung inflammation and fibrosis, which do not depend on either IFN-α/β receptor signaling or mixed lineage kinase domain-like pseudokinase (MLKL)-dependent necroptotic cell death pathways. Furthermore, radiation chimera experiments reveal how bone marrow from the V154M mutant mice transfer disease to the WT host, whereas the N153S does not, indicating mutation-specific disease outcomes. Moreover, using radiation chimeras we find that T cell lymphopenia depends on T cell-intrinsic expression of the SAVI mutation. Collectively, these mutant mice recapitulate many of the disease features seen in SAVI patients and highlight mutation-specific functions of STING that shed light on the heterogeneity observed in SAVI patients.

Keywords: SAVI; STING; T cells; cell death; type I interferonopathies.


Conflict of interest statement

The authors declare no conflict of interest.

Figures

Fig. 1.
Fig. 1.
Reduced survival and spontaneous disease in N153S and V154M SAVI heterozygous mice. (A) 293T cells were transfected with 20 ng of plasmid encoding either human WT STING or mutant STING variants (Left) or the mouse version of WT or mutant STING variants (Right) along with an IFN-β reporter gene. Gene activation was measured by luciferase assay and fold-induction was calculated over cells transfected with IFN-β reporter only. Lysates from the same cells were probed with anti-HA for HA-tagged STING and anti–β-actin as loading control (Lower). (B) HET mutant males were bred to WT females; offspring were genotyped and litter sizes were monitored. (C) The body weight of 4- to 6-wk-old males was determined and the survival of heterozygous mice was monitored with n = 40 mice per group. (D) H&E- and trichrome-stained lungs were assessed for inflammation and fibrosis respectively, n = 5 mice per genotype were used. Representative images are shown at 20× resolution. (E) Spleen-to-body weight and thymus-to-body weight ratios were calculated for n = 8 mice per genotype at 4–6 wk of age. Black bar represents littermate control for N153S (NS) HET mice and gray bar is the littermate control for V154M (VM) HET mice. *P < 0.05; **P < 0.01; ****P < 0.0001; ns, not significant.
Fig. 2.
Fig. 2.
SAVI mutant mice express IFN and inflammatory gene signature. (A) Sera was collected from 16-wk-old SAVI mice and serum cytokines were measured using multiplex assays with n = 6 mice per group. (B) BMDM from 4- to 6-wk-old mice were either untransfected or transfected with 2 μg/mL cGAMP for 30 min and lysates were then probed for pTBK1 and actin as loading controls. (C) BMDMs were either untreated or treated with 20 μg/mL of cycloheximide for 30 min, 60 min, or 180 min and subsequently treated with or without cGAMP for 30 min and probed for STING and actin as loading control. WT+cGAMP-treated cells were used as positive control. *P < 0.05; **P < 0.01; ns, not significant.
Fig. 3.
Fig. 3.
V154M mutants exhibit more severe immune cell alterations than N153S SAVI mutant. (AC) Immune cell populations obtained from the spleens of 6-wk-old N153S and V154M HETs and their respective littermate controls were analyzed by flow cytometry, n = 8 mice per group. (A) Total myeloid cells identified as CD11b+ and neutrophils as CD11b+ Ly6Ghi. (B) T cells were identified as TCR-β+ and activation was assessed by mean fluorescence intensity of CD69. (C) B cells were identified as CD19+ and the activation status of B cells was measured using mean fluorescence intensity of MHC class II. (D) B cell number and activation status in spleens from 16- to 20-wk-old mice. *P < 0.05; **P < 0.01; ***P < 0.001; ****P < 0.0001; ns, not significant.
Fig. 4.
Fig. 4.
SAVI mutations cause abnormal lymphocyte development. (A) The total number of cells and percentage of double-negative (DN) thymocytes in the thymus of SAVI mutants and respective WT littermate controls was determined. of (B) The percentage of B cells, mature B cells, and frequency of immature B cells in the BM was determined. (C) The percentage myeloid progenitors in the lin gate of the BM and the frequency of CD11b+ myeloid cells in the BM were determined. (D) The total number of Ter119+ RBCs in the spleen (Left) and the percentage of immature (CD71+) RBCs in the RBC gate in the spleen (Center) and BM (Right) was determined. n = 8 mice for each WT and mutant genotype. *P < 0.05; **P < 0.01; ***P < 0.001; ****P < 0.0001; ns, not significant.
Fig. 5.
Fig. 5.
IRF3, IFNaR, and MLKL deficiency fail to rescue V154M SAVI phenotype. (AC) IRF3-deficient (IRF3−/−) V154M mutant and WT mice were compared with IRF3-sufficient Het (IRF3+/−) V154M mutant or WT mice. The same strategy was used to evaluate V154M HET IFNaR KO and littermate controls. (A) Survival curve for IRF3 mutant. n = 15 mice. (B) Survival curve for IFNaR mutant. n = 10 mice. (C) Spleen cells V154M HET IFNAR KO and littermate controls were further analyzed as described in Fig. 4. (D) Spleen cells from MLKL-deficient VM mice were compared with MLKL+/− cells using the same criteria. n = 5 mice 8–12 wk old per group. *P < 0.05, **P < 0.01, ***P < 0.001, ****P < 0.0001.
Fig. 6.
Fig. 6.
BM chimeras reveal distinct disease outcomes between the N153S and V154M mutant mice. (A) 107 BM cells from 8- to 10-wk-old CD45.2 WT, N153S HET, V154M HET mice were used to reconstitute lethally irradiated (850R) CD45.1 WT mice (recipient). (B) The percentage myeloid cells (CD11b+) and percentage granulocytes CD11b+ Ly6G+ in the spleens of the WT → WT (W → W), N153S → WT (N → W), and V154M → WT (V → W) chimeras, and the %CD45.1 vs. %CD45.2 of the CD11b+ population were determined by flow cytometry. (C) The %B220+ B cell in the BM %CD19+ B cells the spleen and the %CD45.1 vs. %CD45.2 of the CD19+ splenic B cell population were determined by flow cytometry. (D) The %TCR-β+ cells in the spleen and the %CD45.1 vs. %CD45.2 within the TCR-β+ population were determined by flow cytometry. Activation status of the TCR-β+ cells was assessed by CD44 mean fluorescence intensity. (E) The total cell number of Thy1.2+ cells in the thymus was measured and the %CD45.1 vs. %CD45.2 of the total thymocytes population was determined by flow cytometry. H&E-stained sections of the lung were evaluated for inflammation (Right). All mice were evaluated 10–12 wk after BM reconstitution. n = 8–10 mice per group compiled from two independent experiments. **P < 0.01; ***P < 0.001.
Fig. 7.
Fig. 7.
Mixed BM chimeras identify cell intrinsic defects in both T cells and myeloid cells. (A) 107 BM cells were isolated from 8- to 10-wk-old CD45.1 WT and CD45.2 V154M HET mice. A total of 107 cells were injected that were either WT only (CD45.1+) or a combination of 90% V154M HET and 10% WT were used to reconstitute lethally irradiated (850R) CD45.1+ WT mice. (B) One representative WT → WT chimera is compared with the five mice that received the 90:10 mix. The %CD45.1 and %CD45.2 of the CD11b+ cells in the BM and spleen was determined by flow cytometry. (C) The %CD45.1 and %CD45.2 of the CD19+ cells in the BM and spleen. (D) The %CD45.1 and %CD45.2 of the Thy1.2 cells in the thymus and TCR-β+ cells in the spleen. n = 5 mice per group analyzed 8–10 wk after BM reconstitution.

References

    1. Chen Q, Sun L, Chen ZJ. Regulation and function of the cGAS-STING pathway of cytosolic DNA sensing. Nat Immunol. 2016;17:1142–1149. - PubMed
    1. Ahn J, Barber GN. Self-DNA, STING-dependent signaling and the origins of autoinflammatory disease. Curr Opin Immunol. 2014;31:121–126. - PubMed
    1. Crow YJ, Manel N. Aicardi-Goutières syndrome and the type I interferonopathies. Nat Rev Immunol. 2015;15:429–440. - PubMed
    1. Gall A, et al. Autoimmunity initiates in nonhematopoietic cells and progresses via lymphocytes in an interferon-dependent autoimmune disease. Immunity. 2012;36:120–131. - PMC - PubMed
    1. Stetson DB, Ko JS, Heidmann T, Medzhitov R. Trex1 prevents cell-intrinsic initiation of autoimmunity. Cell. 2008;134:587–598. - PMC - PubMed

Publication types