. 2019 Apr 16;116(16):7951-7956.
doi: 10.1073/pnas.1816360116. Epub 2019 Apr 3.

Cone photoreceptor classification in the living human eye from photostimulation-induced phase dynamics

Affiliations

Cone photoreceptor classification in the living human eye from photostimulation-induced phase dynamics

Furu Zhang et al. Proc Natl Acad Sci U S A. .

Abstract

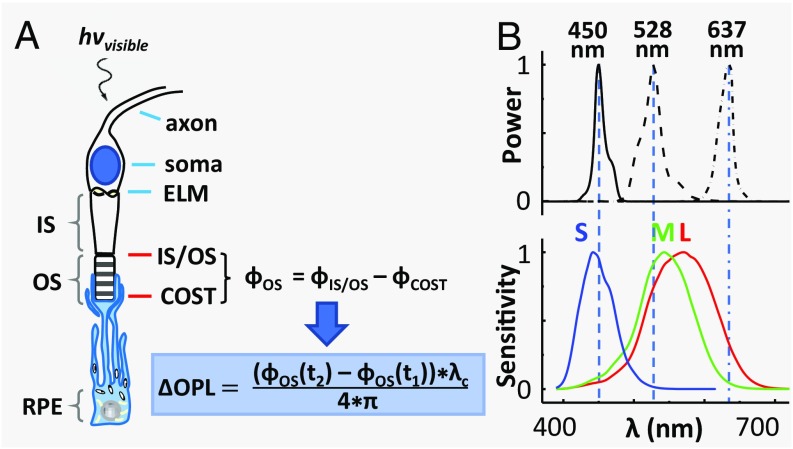
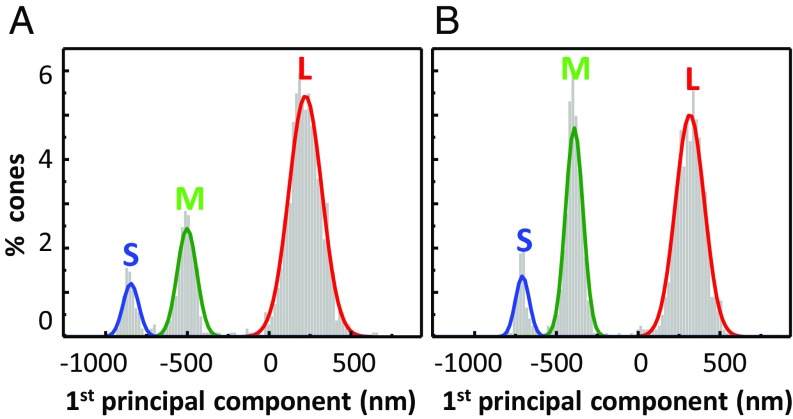
Human color vision is achieved by mixing neural signals from cone photoreceptors sensitive to different wavelengths of light. The spatial arrangement and proportion of these spectral types in the retina set fundamental limits on color perception, and abnormal or missing types are responsible for color vision loss. Imaging provides the most direct and quantitative means to study these photoreceptor properties at the cellular scale in the living human retina, but remains challenging. Current methods rely on retinal densitometry to distinguish cone types, a prohibitively slow process. Here, we show that photostimulation-induced optical phase changes occur in cone cells and carry substantial information about spectral type, enabling cones to be differentiated with unprecedented accuracy and efficiency. Moreover, these phase dynamics arise from physiological activity occurring on dramatically different timescales (from milliseconds to seconds) inside the cone outer segment, thus exposing the phototransduction cascade and subsequent downstream effects. We captured these dynamics in cones of subjects with normal color vision and a deuteranope, and at different macular locations by: (i) marrying adaptive optics to phase-sensitive optical coherence tomography to avoid optical blurring of the eye, (ii) acquiring images at high speed that samples phase dynamics at up to 3 KHz, and (iii) localizing phase changes to the cone outer segment, where photoactivation occurs. Our method should have broad appeal for color vision applications in which the underlying neural processing of photoreceptors is sought and for investigations of retinal diseases that affect cone function.

Keywords: adaptive optics; color vision; cone classification; optical coherence tomography; retina.


Conflict of interest statement

The authors declare no conflict of interest.

Figures

Fig. 1.
Fig. 1.
The physiological response of a cone cell to light produces nanometer OPL changes in its OS, which we detect with AO-OCT. (A) Schematic shows the axon, soma, inner segment (IS), and OS of a cone cell, and the underlying retinal pigment epithelium (RPE) cell that ensheathes it. The cone cell is stimulated with a visible flash during AO-OCT imaging, and the resulting phase and OPL changes are defined mathematically, as shown. The phase difference, ϕOS, is between the two bright reflections at opposing ends of the cone OS, which are labeled as IS/OS and COST (cone OS tip). (B) Normalized spectra of the three light sources that stimulate the cones are shown with the normalized sensitivity functions of the three cone types that are sensitive to short- (S), medium- (M), and long- (L) wavelength light (31).
Fig. 2.
Fig. 2.
Phase response of cones is biphasic with amplitude increasing with flash energy in subject 1. The dashed gray lines at 0 s in A and C represent the 637-nm stimulus onset. (A) Average responses of 1,094 cone cells sampled at the 10-Hz volume rate for flash energies over a sixfold range and averaged over 10 videos to improve signal to noise. Phase response was referenced to the average of the prestimulus volumes. (B) Maximum ΔOPL and maximum slope of ΔOPL in A are plotted against the total flash energy and the predicted percentage of photopigment bleaching (top secondary axis). Solid curves represent best power fits. (C) Average fast response of cone cells as analyzed on a per B-scan basis over the single volume during which flash stimulation occurred. SD of the prestimulus signal was measured at 2.4 nm, which corresponds to the noise floor. (D) ΔOPL during the downward portion of the traces in C is plotted against accumulated flash energy and corresponding predicted percentage of photopigment bleaching. Solid line represents best linear fit. Key specifies energy level at eye and flash duration of stimulation. Note that the 0.64 μJ, 1.60 μJ, and 3.20 μJ flashes were of the same 320 μW intensity; the 0.53 μJ and 1.07 μJ flashes were 107 μW and 213 μW, respectively.
Fig. 3.
Fig. 3.
Phase response of cones varies with cone type (S, M, and L) and wavelength of the stimulus in subject 1. The dashed gray line at 0 s represents the 5-ms stimulus flash. Response traces of individual cones are shown for stimulation at (Upper) 637 nm and 1.6 μJ, (Middle) 528 nm and 0.5 μJ, and (Bottom) 450 nm and 1.0 μJ. (A, D, and G) Individual traces of 1,094 cone cells are randomly colored. Histogram of normalized cone count is shown for 0.6–1.0 s after flash. Average SD of individual S and M cone traces before stimulation was measured at 5 nm, which corresponds to the system noise floor. L cones were excluded from the analysis because their slight sensitivity to the imaging wavelength would have biased the measurement. Phase response was referenced to the average of the prestimulus volumes. (B, E, and H) Cone responses in A, D, and G are colored red (L), green (M), or blue (S) based on the k-mean classification and expected spectral sensitivity of each cone type to the stimulus wavelength. (C, F, and I) Average responses of the grouped traces in B, E, and H. (J) To quantify the agreement of our method to classify cones, three confusion matrices were constructed that show the number of cones that were classified as S, M, or L by one stimulus (450, 528, or 637 nm) and as S, M, or L by another stimulus (450, 528, or 637 nm). Percentage agreement is shown to the right of each matrix. (K) Repeatability error was quantified by comparing classification results of two independent subsets of videos (P1 and P2) obtained with the 637-nm stimulus. Each subset contains seven videos.
Fig. 4.
Fig. 4.
Mapping the trichromatic cone mosaic of the three subjects. (AC) En face intensity images show the cone mosaics at 3.7° retinal eccentricity, as projected through their OSs (Movies S1–S3). Images are shown on a log scale (C) The dark holes in the mosaic of the deuteranope are marked by red arrows and are suggestive of missing cone OSs. The holes reflect little light (the 22 marked holes are 35 ± 10 times dimmer than their brightest neighboring cone) and show no evidence of waveguiding (no punctated reflection at hole center). Cone density of the deuteranope is 17,587 cones/mm2, and falls in the normal range for this retinal eccentricity (39). (DF) The cone mosaics from AC are color coded on the basis of cone classification using the 637-nm stimulus results in Fig. 3A and SI Appendix, Figs. S4A and S10A (S = blue; M = green; L = red; Unidentified = yellow). Spatial coordinates and class type of cones of the three subjects are listed in Dataset S1.
Fig. 5.
Fig. 5.
Cone classification uncertainty is less than 0.02%. (A and B) Distribution of the first principal component of ΔOPL traces for the two color-normal subjects as obtained from Fig. 3A and SI Appendix, Fig. S4A, using the 637-nm stimulus. Gaussian fits to the three clusters are color coded and identified by spectral type (S, M, L). Total cones in both plots equal 100%.

References

    1. Rodieck RW. The First Steps in Seeing. Sinauer Associates; Sunderland, MA: 1998.
    1. Greenstein VC, Hood DC, Ritch R, Steinberger D, Carr RE. S (blue) cone pathway vulnerability in retinitis pigmentosa, diabetes and glaucoma. Invest Ophthalmol Vis Sci. 1989;30:1732–1737. - PubMed
    1. Sharpe LT, Stockman A, Jägle H, Nathans J. Opsin genes, cone photopigments, color vision, and color blindness. In: Gegenfurtner KR, Sharp TL, editors. Color Vision: From Genes to Perception. Cambridge Univ Press; Cambridge, UK: 1999. pp. 3–51.
    1. Weinrich TW, et al. No evidence for loss of short-wavelength sensitive cone photoreceptors in normal ageing of the primate retina. Sci Rep. 2017;7:46346. - PMC - PubMed
    1. De Vries H. The heredity of the relative numbers of red and green receptors in the human eye. Genetica. 1949;24:199–212.

Publication types

LinkOut - more resources