. 2019 Apr 4;4(7):e126751.
doi: 10.1172/jci.insight.126751.

Altered X-chromosome inactivation in T cells may promote sex-biased autoimmune diseases

Affiliations

Altered X-chromosome inactivation in T cells may promote sex-biased autoimmune diseases

Camille M Syrett et al. JCI Insight. .

Abstract

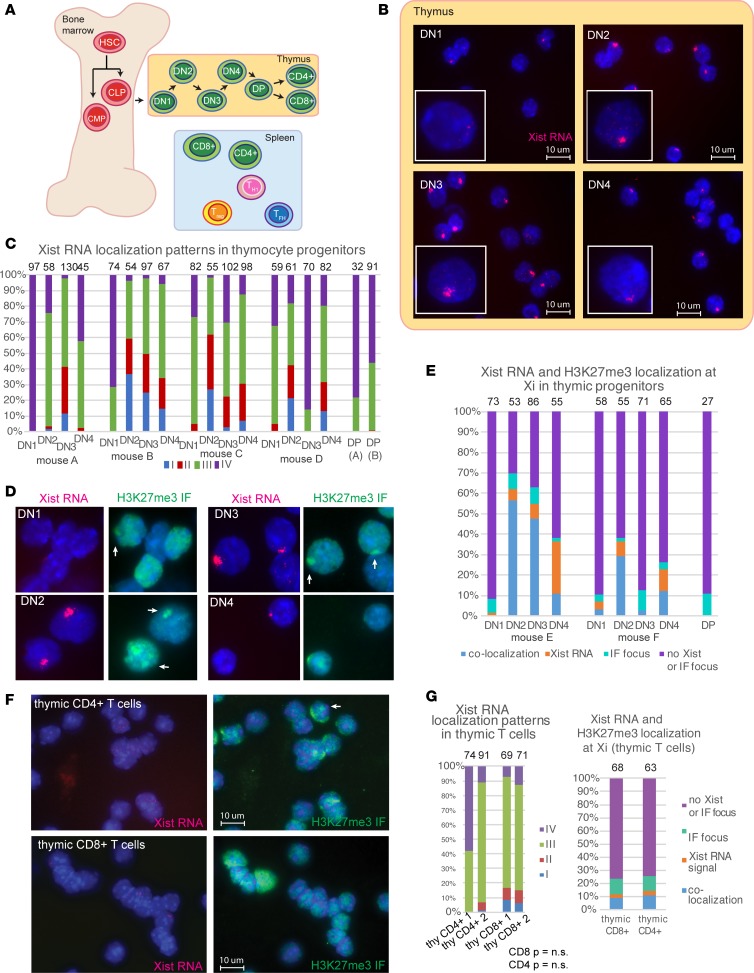
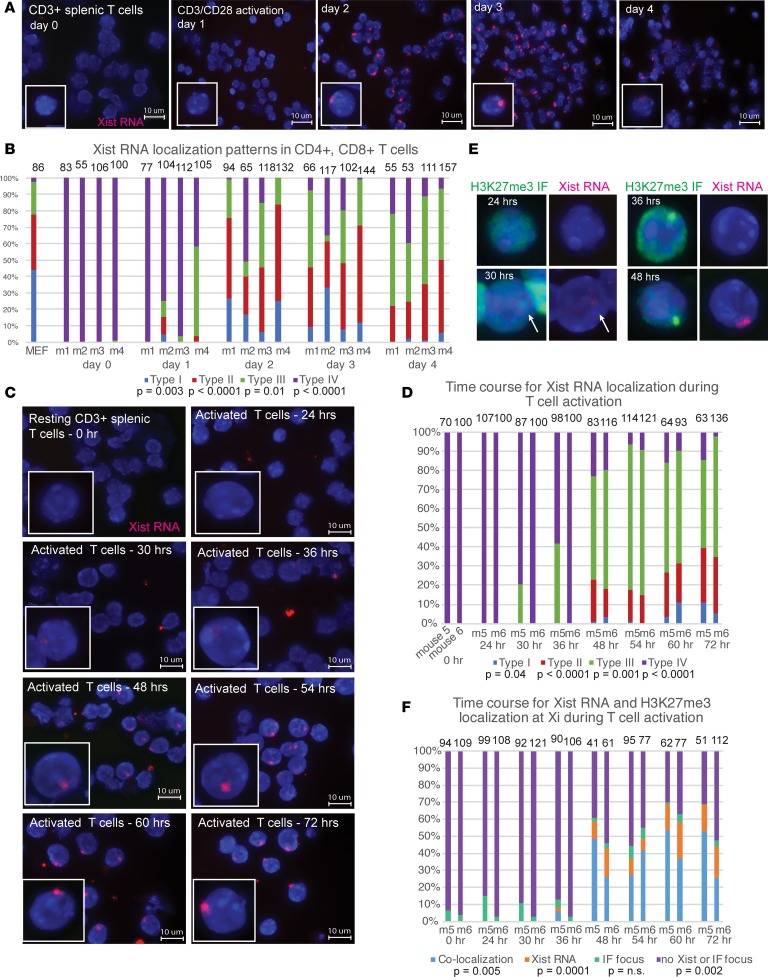
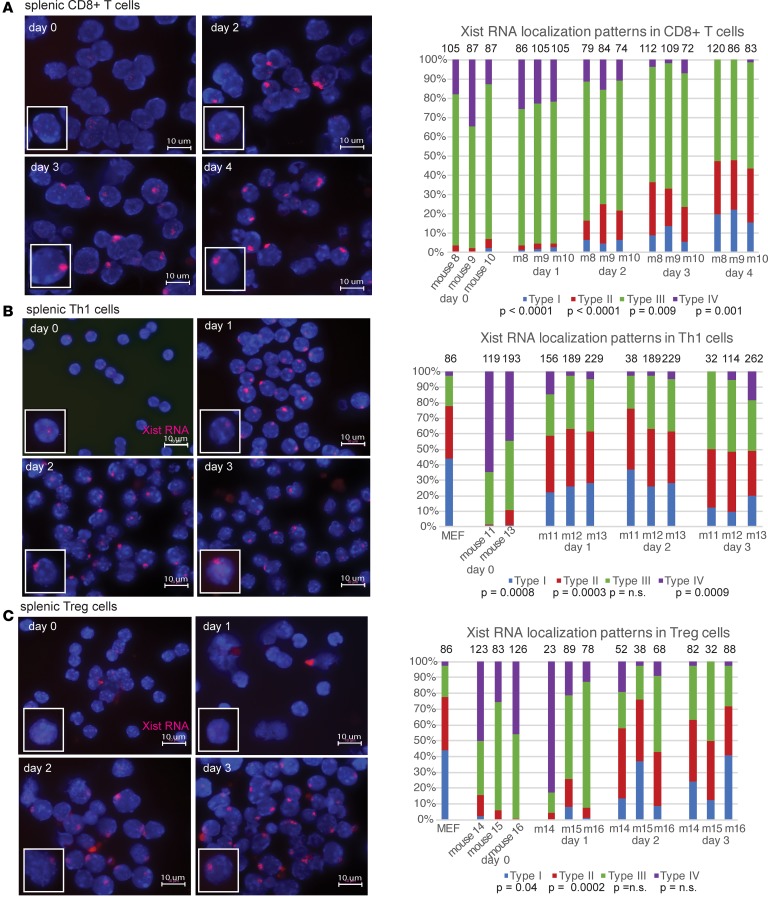
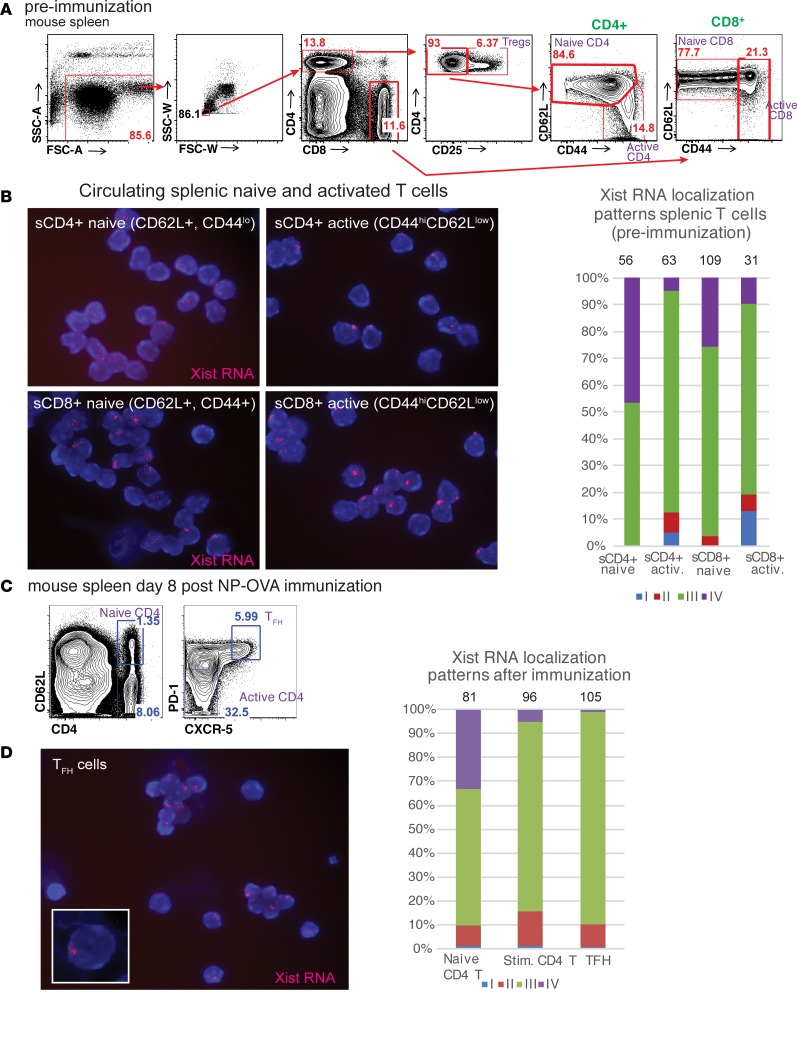
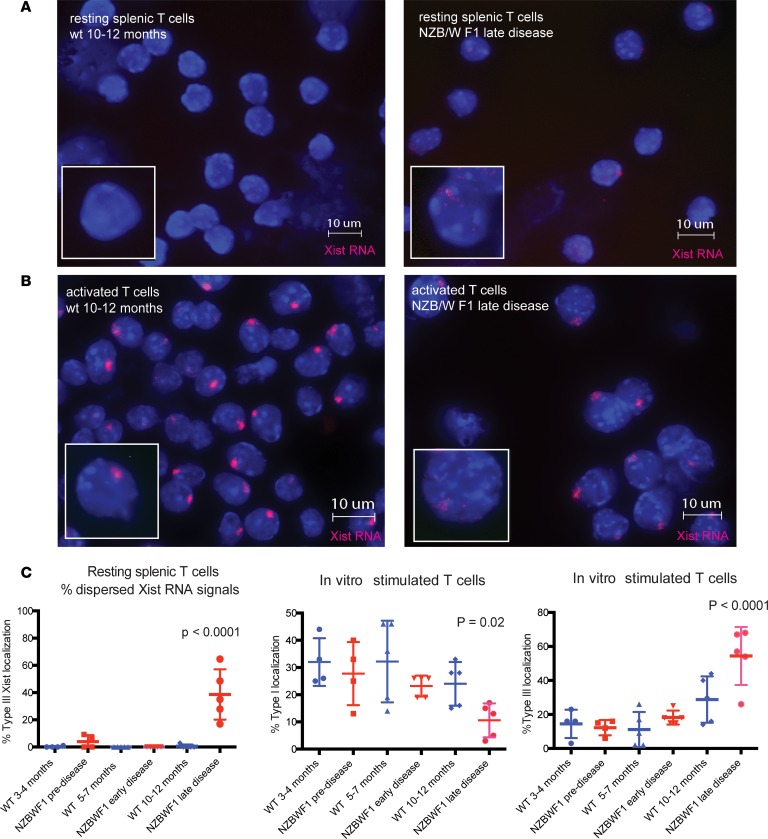
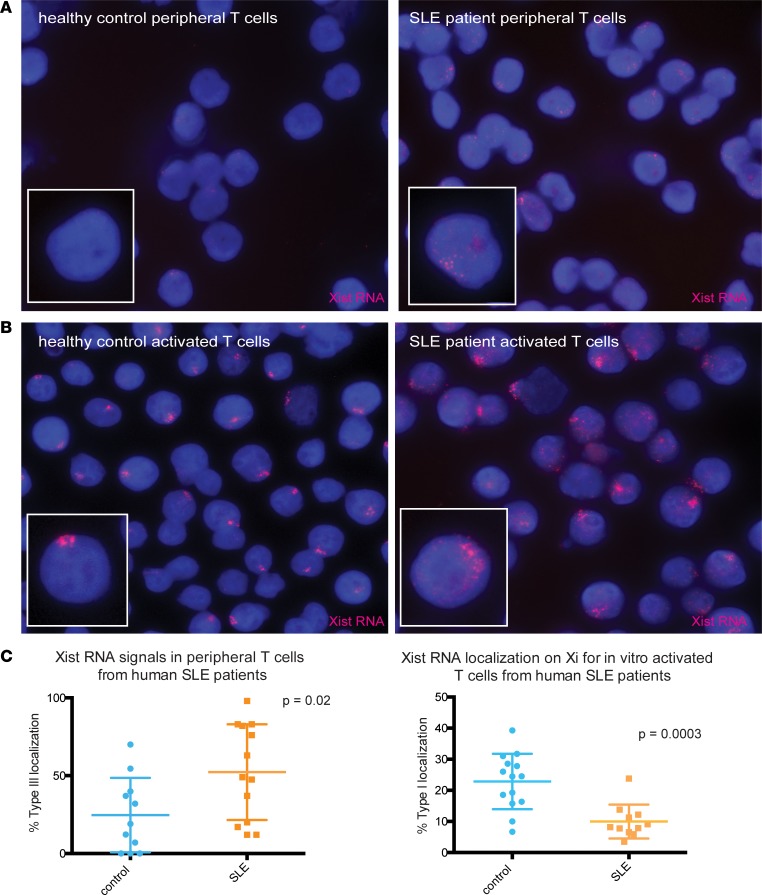
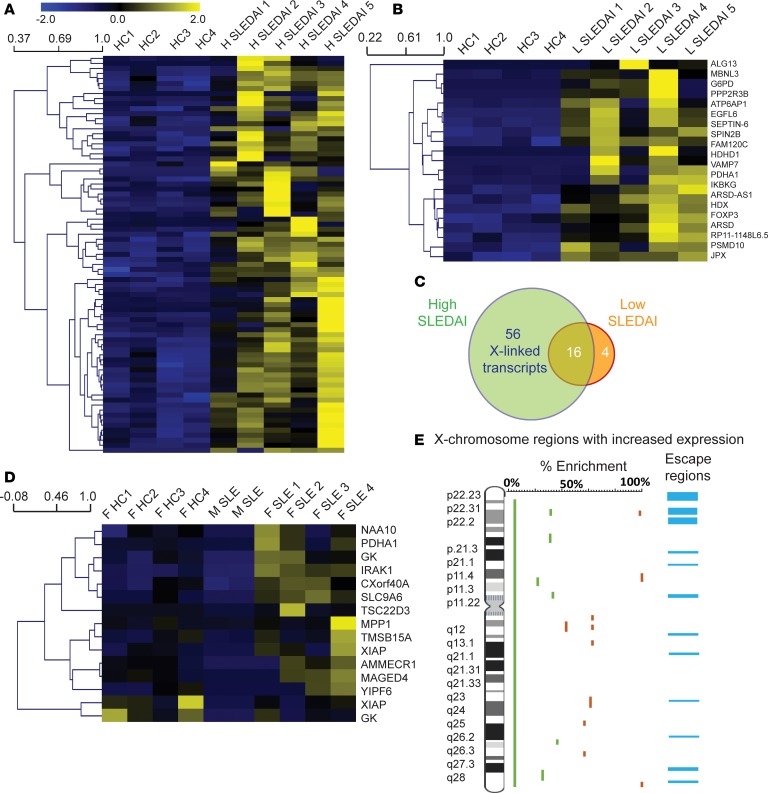
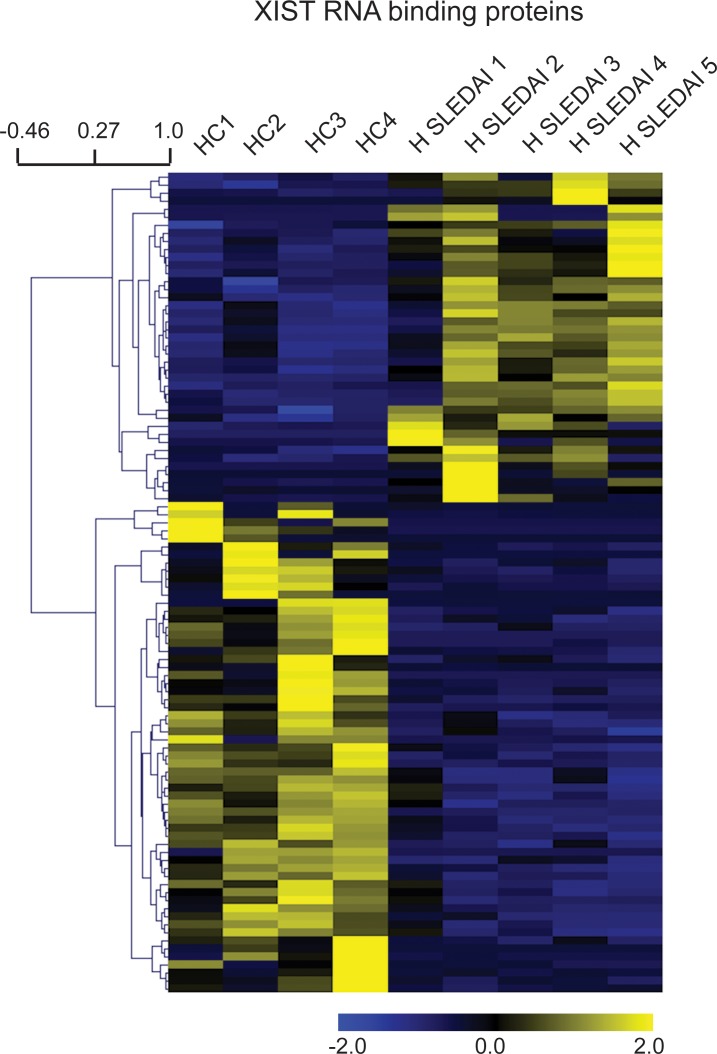
Systemic lupus erythematosus (SLE) is an autoimmune disorder that predominantly affects women and is driven by autoreactive T cell-mediated inflammation. It is known that individuals with multiple X-chromosomes are at increased risk for developing SLE; however, the mechanisms underlying this genetic basis are unclear. Here, we use single cell imaging to determine the epigenetic features of the inactive X (Xi) in developing thymocytes, mature T cell subsets, and T cells from SLE patients and mice. We show that Xist RNA and heterochromatin modifications transiently reappear at the Xi and are missing in mature single positive T cells. Activation of mature T cells restores Xist RNA and heterochromatin marks simultaneously back to the Xi. Notably, X-chromosome inactivation (XCI) maintenance is altered in T cells of SLE patients and late-stage-disease NZB/W F1 female mice, and we show that X-linked genes are abnormally upregulated in SLE patient T cells. SLE T cells also have altered expression of XIST RNA interactome genes, accounting for perturbations of Xi epigenetic features. Thus, abnormal XCI maintenance is a feature of SLE disease, and we propose that Xist RNA localization at the Xi could be an important factor for maintaining dosage compensation of X-linked genes in T cells.

Keywords: Autoimmunity; Cell Biology; Epigenetics; Noncoding RNAs; T cell development.


Conflict of interest statement

Conflict of interest: The authors have declared that no conflict of interest exists.

Figures

Figure 1
Figure 1. Xist RNA and heterochromatin marks disappear from the Xi during T cell development.
(A) Schematic of thymocyte differentiation in BM and thymus, as well as mature T cell subsets in the spleen. (B) Representative Xist RNA FISH images of nuclei from each thymocyte subset. (C) Quantification of Xist RNA localization patterns from each stage of thymocyte development. Results from 4 different female mice (mice A–D) are shown. Numbers above each column indicate number of nuclei counted. Statistical significance for each type of Xist RNA localization pattern across DN1-DP was determined using 1-way ANOVA; there was no statistically significant difference across all groups. (D) Sequential Xist RNA FISH and IF for H3K27me3 for DN1–4 (DP thymocytes shown in Supplemental Figure 2). White arrows denote H3K27me3 foci. (E) Quantification of colocalization patterns for Xist RNA and H3K27me3 at the Xi. Colocalization of Xist RNA and H3K27me3 focus (blue bars), Xist RNA signals alone (orange), nuclei without either signals (purple), or H3K27me3 focus (green). Numbers above each column indicate number of nuclei counted. Results from 2 different mice (mice E and F) are shown. Statistical significance for each type of Xist RNA/H3K27me3 colocalization pattern across DN1–4 was determined using 1-way ANOVA; there was no statistically significant difference across all groups. (F) Sequential Xist RNA FISH and H3K27me3 in mature thymic CD4+ and CD8+ T cells. (G) Quantification of Xist RNA localization patterns for thymic CD4+ and CD8+ T cells (left). Results from 2 different mice (labeled 1 and 2) are shown. Quantification of colocalization patterns for Xist RNA and H3K27me3 in mature thymic T cells from 1 female mouse (right). Numbers above each column indicate number of nuclei counted. Statistical significance for each type of Xist RNA localization pattern was determined using 1-way ANOVA; there was no statistically significant difference across all groups.
Figure 2
Figure 2. Timing of Xist RNA and H3K27me3 localization to the Xi during in vitro T cell stimulation.
(A) Time course for Xist RNA localization to the Xi for splenic CD3+ T cells stimulated with CD3/CD28, determined between days 0–4. Representative results from 1 experiment are shown. (B) Quantification of Xist RNA localization patterns for 4 independent experiments. Statistical significance for each type of Xist RNA localization pattern across 4 different mice (labeled m1–m4) was determined using 1-way ANOVA, and P values for each test are shown below the graph. (C) Time course (24–72 hours) for Xist RNA localization at the Xi for splenic CD3+ T cells stimulated with CD3/CD28. Results from 1 representative experiment are shown. (D) Quantification of Xist RNA localization patterns for 2 independent experiments, using 2 different mice (labeled m5 and m6). Statistical significance for each type of Xist RNA localization pattern was determined using 1-way ANOVA, and P values for each test are shown below the graph. (E) Sequential Xist RNA FISH and IF for H3K27me3 for splenic CD3+ T cells at 24, 30, 36, and 48 hours after stimulation, from 1 representative experiment. Arrows indicate co-localization of Xist RNA and H3K27me3 focus. (F) Quantification of colocalization patterns for Xist RNA and H3K27me3 during T cell activation, using the same 2 female mice from D. Statistical significance for each type of Xist RNA/H3K27me3 localization pattern was determined using 1-way ANOVA, and P values for each test are shown below the graph.
Figure 3
Figure 3. Xist RNA localization patterns in CD8+ T cells and CD4+ T cell subsets.
(A) Xist RNA FISH for splenic CD8+ T cells stimulated for 4 days using CD3/CD28, from 1 representative experiment (left). Quantification of Xist RNA localization patterns from 3 different female mice, labeled mouse 8–10 (right). Statistical significance for each type of Xist RNA localization pattern was determined using 1-way ANOVA, and P values for each test are shown below the graph. (B) Xist RNA FISH and quantification of localization patterns for splenic CD4+ Th1 cells, using 3 different female mice (labeled mouse 11–13). Statistical significance for each type of Xist RNA localization pattern was determined using 1-way ANOVA, and P values for each test are shown below the graph. (C) Xist RNA FISH and quantification of localization patterns for splenic Tregs isolated from 3 different female mice (labeled mouse 14–16). Statistical significance for each type of Xist RNA localization pattern was determined using 1-way ANOVA, and P values for each test are shown below the graph.
Figure 4
Figure 4. Xist RNA transcripts are diffuse at the Xi for in vivo–activated T cell subsets.
(A) Representative FACS analysis for sorting naive and activated CD4+ and CD8+ T cells from the spleens of preimmunized mice (n = 2). (B) Xist RNA FISH for circulating splenic (s) naive and activated CD4+ and CD8+ T cells from preimmunized mice, sorted using the gating strategy in A (left). Quantification of Xist RNA localization patterns for splenic CD4+ and CD8+ T cells (right). (C) Representative FACS analysis for sorting T follicular helper cells from mice immunized with NP-OVA. Spleens were collected at day 8 after immunization from 2 female mice. (D) Xist RNA FISH for T follicular helper cells (left) and quantification of Xist RNA localization patterns for CD4+ T cell subsets from spleens of NP-OVA–immunized mice (right).
Figure 5
Figure 5. Xist RNA becomes mislocalized from the Xi in T cells from diseased NZB/W F1 mice.
(A) Representative Xist RNA FISH images from resting splenic T cells from late-stage–disease NZB/W F1 mice (determined by proteinuria and serum dsDNA autoantibody levels) and age-matched healthy controls (C57BL/6J, BALB/c). (B) Representative Xist RNA FISH images from in vitro activated (CD3/CD28) splenic T cells from late-stage–disease NZB/W F1 mice and age-matched healthy controls (C57BL/6J, BALB/c). (C) (Left) Quantification of Type III Xist RNA localization patterns in splenic T cells from NZB/W F1 mice from 3 disease stages (predisease, early-stage disease, and late-stage disease) and age-matched controls (n = 4–5 mice/group) for each disease time point. At least 23 nuclei (23–159 nuclei) were counted for each sample; total counts shown in Supplemental Figure 3. (Center and right) Quantification of Type I and Type III Xist RNA localization patterns for in vitro–activated splenic T cells. At least 50 nuclei (50–237 nuclei) were counted for each sample; total counts shown in Supplemental Figure 3. Error bars denote mean ± SD, and statistical significance was determined for each type of Xist RNA localization pattern between all groups using an ordinary 1-way ANOVA (nonparametric tests).
Figure 6
Figure 6. Peripheral T cells from pediatric SLE patients have mislocalized XIST RNA patterns.
(A) Representative XIST RNA FISH images from circulating T cells from 1 SLE patient (SLEDAI 0) and age-matched control. (B) Representative XIST RNA FISH images for in vitro–activated T cells from 1 pediatric SLE patient and age-matched healthy control. (C) (Left) Quantification of Type III XIST RNA localization patterns in circulating T cells from pediatric SLE patients (n = 13) and healthy age-matched controls (n = 10). (Right) Quantification of Type I XIST RNA localization patterns for in vitro–activated T cells from SLE patients and healthy controls. Error bars denote mean ± SD, and statistical significance was determined using 2-tailed unpaired t tests.
Figure 7
Figure 7. Increased transcription across the X-chromosome and differential expression of XIST RNA interacting proteins in T cells from SLE patients.
(A) Heatmap showing X-linked gene transcripts overexpressed in T cells from 5 female SLE patients with high (H) SLEDAI scores (score 12–26) compared with 4 healthy control (HC) females. Gene transcript information is in Supplemental Table 2. (B) Heatmap showing X-linked gene transcripts overexpressed in 5 female SLE patients with low (L) SLEDAI scores (score 0–4) compared with HC females. Gene names for each transcript are shown; transcript IDs are listed in Supplemental Table 3. (C) Venn-diagram showing the number of X-linked genes overexpressed in high SLEDAI (score 12–26) and low SLEDAI (score 0–4) cases from A and B. (D) Heatmap of the X-linked genes overexpressed in female (F) SLE patients (n = 4) compared with male (M) lupus patients (n = 2) and healthy female individuals (n = 4). Gene names for each transcript are shown; transcript IDs are listed in Supplemental Tables 5 and 6. (E) Positional gene enrichment (PGE) analysis for X-linked genes overexpressed in T cells from female SLE patients compared with female healthy controls. Regions with % enrichment > 50 are denoted in red; regions with % enrichment < 50 are shown in green. The regions along the X-chromosome containing genes that escape XCI (ref. 50) are represented in blue (right side). Statistical significance for fold changes in gene expression was determined using FDR < 0.05.
Figure 8
Figure 8. Altered expression of XIST interacting proteins in SLE patient T cells.
Heatmap of differentially expressed XIST interacting protein coding genes between female SLE patients with high SLEDAI scores (score 12–26; n = 5) and healthy female controls (n = 4). Complete gene transcript lists of upregulated and downregulated transcripts are listed in Supplemental Table 7.

Comment in

References

    1. Eaton WW, Rose NR, Kalaydjian A, Pedersen MG, Mortensen PB. Epidemiology of autoimmune diseases in Denmark. J Autoimmun. 2007;29(1):1–9. doi: 10.1016/j.jaut.2007.05.002. - DOI - PMC - PubMed
    1. Liu K, et al. X Chromosome Dose and Sex Bias in Autoimmune Diseases: Increased 47,XXX in Systemic Lupus Erythematosus and Sjogren’s Syndrome. Arthritis Rheumatol. 2016;68(5):1290–1300. - PMC - PubMed
    1. Cooney CM, et al. 46,X,del(X)(q13) Turner’s syndrome women with systemic lupus erythematosus in a pedigree multiplex for SLE. Genes Immun. 2009;10(5):478–481. doi: 10.1038/gene.2009.37. - DOI - PMC - PubMed
    1. Libert C, Dejager L, Pinheiro I. The X chromosome in immune functions: when a chromosome makes the difference. Nat Rev Immunol. 2010;10(8):594–604. doi: 10.1038/nri2815. - DOI - PubMed
    1. Ross MT, et al. The DNA sequence of the human X chromosome. Nature. 2005;434(7031):325–337. doi: 10.1038/nature03440. - DOI - PMC - PubMed

Publication types

MeSH terms