. 2019 Apr 3;10(1):1514.
doi: 10.1038/s41467-019-09570-7.

Ca2+-dependent regulation of sodium channels NaV1.4 and NaV1.5 is controlled by the post-IQ motif

Affiliations

Ca2+-dependent regulation of sodium channels NaV1.4 and NaV1.5 is controlled by the post-IQ motif

Jesse B Yoder et al. Nat Commun. .

Abstract

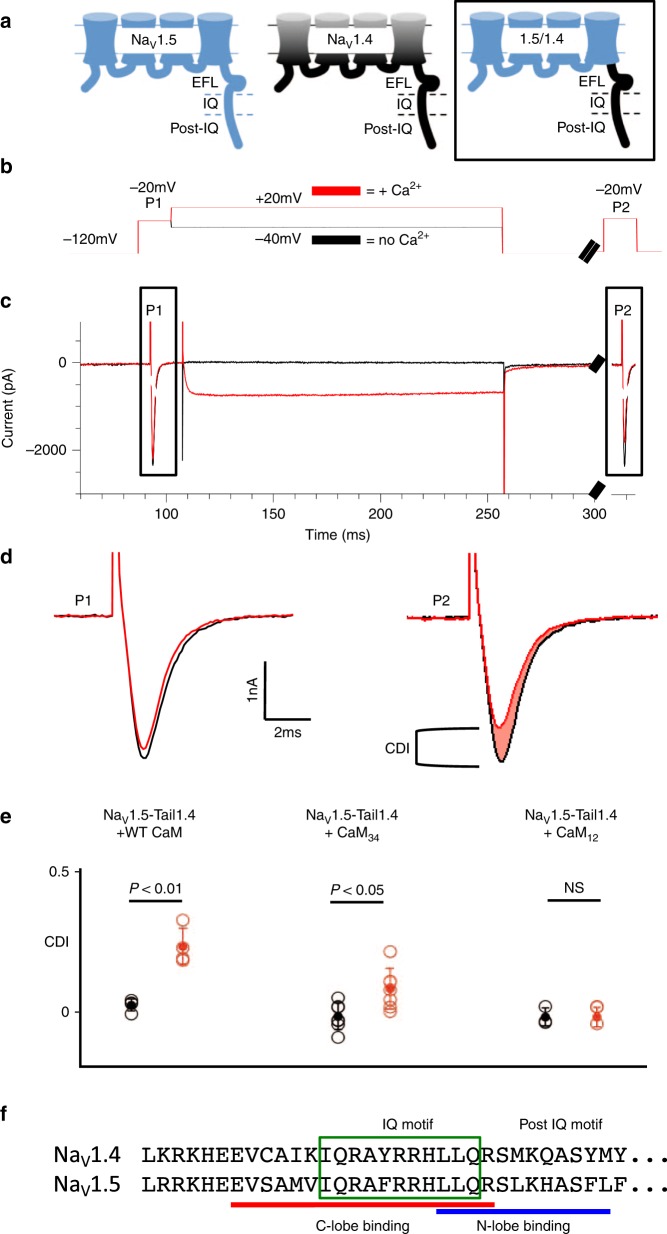
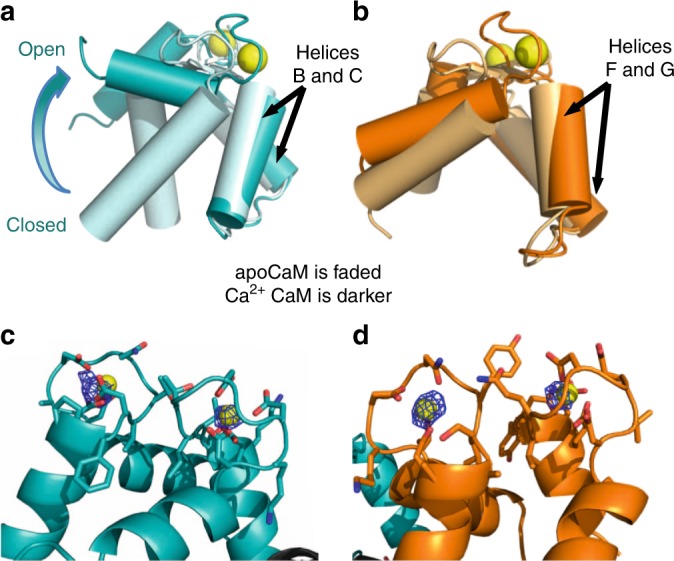
Skeletal muscle voltage-gated Na+ channel (NaV1.4) activity is subject to calmodulin (CaM) mediated Ca2+-dependent inactivation; no such inactivation is observed in the cardiac Na+ channel (NaV1.5). Taken together, the crystal structures of the NaV1.4 C-terminal domain relevant complexes and thermodynamic binding data presented here provide a rationale for this isoform difference. A Ca2+-dependent CaM N-lobe binding site previously identified in NaV1.5 is not present in NaV1.4 allowing the N-lobe to signal other regions of the NaV1.4 channel. Consistent with this mechanism, removing this binding site in NaV1.5 unveils robust Ca2+-dependent inactivation in the previously insensitive isoform. These findings suggest that Ca2+-dependent inactivation is effected by CaM's N-lobe binding outside the NaV C-terminal while CaM's C-lobe remains bound to the NaV C-terminal. As the N-lobe binding motif of NaV1.5 is a mutational hotspot for inherited arrhythmias, the contributions of mutation-induced changes in CDI to arrhythmia generation is an intriguing possibility.


Conflict of interest statement

The authors declare no competing interests.

Figures

Fig. 1
Fig. 1
C-terminal tail and CaM control of NaV CDI. a Schematic of NaV1.5, NaV1.4 and NaV1.5-CTail1.4 (NaV1.5 residues 1–1773 with NaV1.4 1599–1836) used in experiments below. b Pulse protocol for Na+ channel current recordings and assessment of CDI. The pulse protocol with a 150 msec step to +20 mV (red) activates co-expressed CaV2.1 while a step to −40 mV (black) does not. c Current elicited by the pulse protocols. The Na+ current is probed before (P1) and after (P2) Ca2+ entry into the cells due to the intermediate depolarization at −40 mV (where the Ca2+ channels are closed) and +20 mV (where the Ca2+ channels are open). The pre-pulse P1 and the test pulse P2 are used to probe the Na+ current in the absence of Ca2+ due to the intermediate depolarization at −40 mV or in the presence of Ca2+ due to the activated Ca2+ channels during the further depolarization at +20 mV. d Na+ currents measured during P1 and P2. The P2 current after Ca2+ influx (red trace) compared to P2 current with no Ca2+ influx (black). e Data points of CDI measurement (open circles, filled circle as mean with bars showing ±1 standard deviation) with CaM WT, CaM12 or CaM34 showing only the N-lobe of CaM is required to bind Ca2+ for CDI to occur. Statistical significance was determined by an unpaired t-test. Supplementary Table 2 lists values of the individual data points shown. f Alignment of the sequences of NaV1.4 and NaV1.5 in IQ and post-IQ regions
Fig. 2
Fig. 2
Structures of NaV1.4 CTerm in complex with CaM, ± Ca2+. a 1.8 Å resolution structure of the complex of the NaV1.4 CTerm and apo CaM. CTerm colored gray and CaM light teal (N-lobe) and light orange (C-lobe). b Close-up of the apo C-lobe and helix α VI interactions. c Close-up of N-lobe and EFL interaction. d 3.3 Å resolution structure of the complex of the NaV1.4 CTerm and (Ca2+)4-CaM. CTerm is colored black and CaM dark teal (N-lobe) and dark orange (C-lobe). e Close-up of Ca2+-C-lobe and helix αVI interactions. f Close-up of Ca2+-N-lobe and EFL interaction. Residues shown have more than 10 Å2 BSA. g–i Schematics of CaM N-lobe control in NaV regulation. g Activated conformation of CaM and NaV1.4 (PDB ID: 6MBA). h Ca2+-inactivated conformation of CaM and NaV1.4 (PDB ID: 6MC9). i Ca2+-insensitive conformation of CaM and NaV1.5 (PDB ID: 4JQ0, FHF molecule not displayed)
Fig. 3
Fig. 3
Structural overlap of the N-lobe and C-lobe of CaM bound to NaV1.4 CTerm. a CaM N-lobes aligned by helices B and C (residues 32–55) show the N-lobe displacement from closed to open upon Ca2+ binding (70° of opening). b CaM C-lobes aligned by helices F and G (residues 105–128) show the small conformational change (8° of opening) experienced by the C-lobe upon Ca2+ binding; both C-lobes are semi-open (Supplementary Fig. 2). c Close-up of the C-lobe of (Ca2+)4-CaM bound to helix α VI, showing the C-lobe’s EF-hand loop residues (CaM residues 93–104 and 129–140) and the anomalous scattering (F+ − F)eiφ-calc map at a 4σ contour within 10 Å of either Ca2+ ion. d, Close-up of the N-lobe of (Ca2+)4-CaM showing the N-lobe’s EF-hand loop residues (CaM residues 20–31 and 56–67) and the anomalous scattering (F+ − F)eiφ-calc map at 3.5σ contour within 10 Å of either Ca2+ ion
Fig. 4
Fig. 4
NaV1.4 CTerm and NaV1.5 CTerm populations with bound CaM. a Reaction scheme of Ca2+ ions binding to CaM lobes. Thermodynamic data of these binding reactions were reported previously, . b Reaction scheme of CaM in four Ca2+-saturation states binding to NaV CTerm. Thermodynamic data of these binding reactions are reported here. c–f Panels showing the relative population (Z-axis) of four CaM species bound to NaV CTerm, modeled as a function of [Ca2+] and [CaM] using the two schemes above. NaV1.4 CTerm-bound species on the left, NaV1.5 CTerm-bound CaM-species on the right. c Population of apo CaM bound to NaV CTerm. d Population of (Ca2+)2-N–CaM bound to NaV CTerm. e Population of (Ca2+)2-C–CaM bound to NaV CTerm. f Population of (Ca2+)4–CaM bound to NaV CTerm. Only NaV1.4 CTerm shows a significant population of bound (Ca2+)2-C–CaM (orange surface)
Fig. 5
Fig. 5
NaV CTerm-CaM populations as a function of Ca2+. a The relative populations of four CaM-bound CTerm species are shown at a fixed CaM concentration of 10 µM (fixed CaM at 1 µM shows similar trends, Supplementary Fig. 8). The isoform CTerm species add to 100%; free CTerm is included in calculations but not shown in figure. At ~10 µM Ca2+ NaV1.4 CTerm shows a dominant species of (Ca2+)2-C–CaM bound to CTerm (solid orange line) while NaV1.5 CTerm shows a dominant species of (Ca2+)4–CaM bound to CTerm (dashed purple line). b The relative populations of CTerm-bound CaM, showing Ca2+-saturation of the CaM N- or C-lobe. At ~10 M Ca2+ CaM bound to NaV1.4 CTerm has little (Ca2+)2-N-lobe (solid teal) while CaM bound to NaV1.5 CTerm has primarily (Ca2+)2-N-lobe (dashed teal line). This is consistent with the hypothesis that NaV1.5 CTerm contains an NLBM while NaV.14 CTerm does not
Fig. 6
Fig. 6
Deletion of NaV1.5 post-IQ NLBM reveals CDI. a Schematic of the sodium channel NaV1.5 displaying CTerm and post-IQ NLBM region; currents unaffected by 10 µM Ca2+. Gray dots, peak currents before uncaging. Bottom, mean ± ecm for CDI versus Ca2+-step amplitude. CDI = 1−average peak INa of last three to four responses after Ca2+ uncaging/peak INa before uncaging. b Schematic of NaV1.5 displaying CTerm and the post-IQ deletion; Na+ currents reduced strongly at 10 µM Ca2+, the envelope of peak currents is outlined in red and the difference in peak current before and after uncaging is shaded. Current measurements of NaV1.5ΔP-IQ, shown as in (a)

References

    1. Payandeh J, Scheuer T, Zheng N, Catterall WA. The crystal structure of a voltage-gated sodium channel. Nature. 2011;475:353–358. doi: 10.1038/nature10238. - DOI - PMC - PubMed
    1. Naylor CE, et al. Molecular basis of ion permeability in a voltage-gated sodium channel. EMBO J. 2016;35:820–830. doi: 10.15252/embj.201593285. - DOI - PMC - PubMed
    1. Bahler M, Rhoads A. Calmodulin signaling via the IQ motif. FEBS Lett. 2002;513:107–113. doi: 10.1016/S0014-5793(01)03239-2. - DOI - PubMed
    1. Gabelli SB, et al. Regulation of the NaV1.5 cytoplasmic domain by calmodulin. Nat. Commun. 2014;5:5126. doi: 10.1038/ncomms6126. - DOI - PMC - PubMed
    1. Wang C, Chung BC, Yan H, Lee SY, Pitt GS. Crystal structure of the ternary complex of a NaV C-terminal domain, a fibroblast growth factor homologous factor, and calmodulin. Structure. 2012;20:1167–1176. doi: 10.1016/j.str.2012.05.001. - DOI - PMC - PubMed

Publication types

MeSH terms