. 2019 Apr 3;10(1):1519.
doi: 10.1038/s41467-019-09469-3.

Proteogenomics and Hi-C reveal transcriptional dysregulation in high hyperdiploid childhood acute lymphoblastic leukemia

Affiliations

Proteogenomics and Hi-C reveal transcriptional dysregulation in high hyperdiploid childhood acute lymphoblastic leukemia

Minjun Yang et al. Nat Commun. .

Abstract

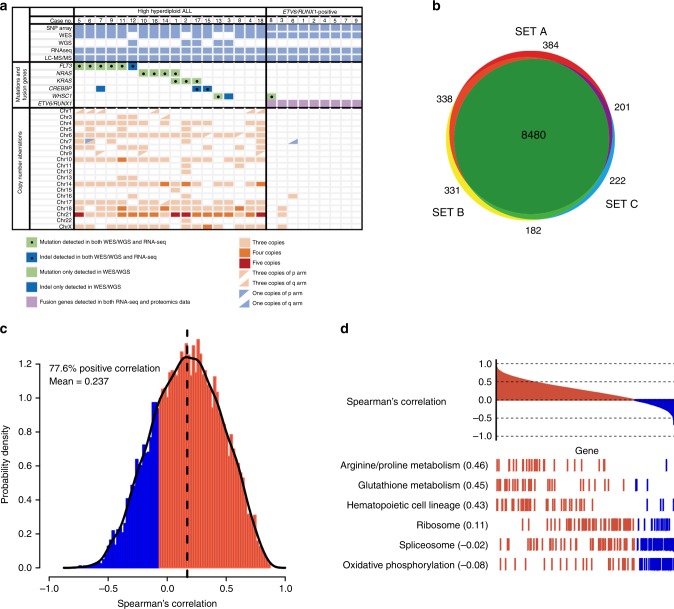
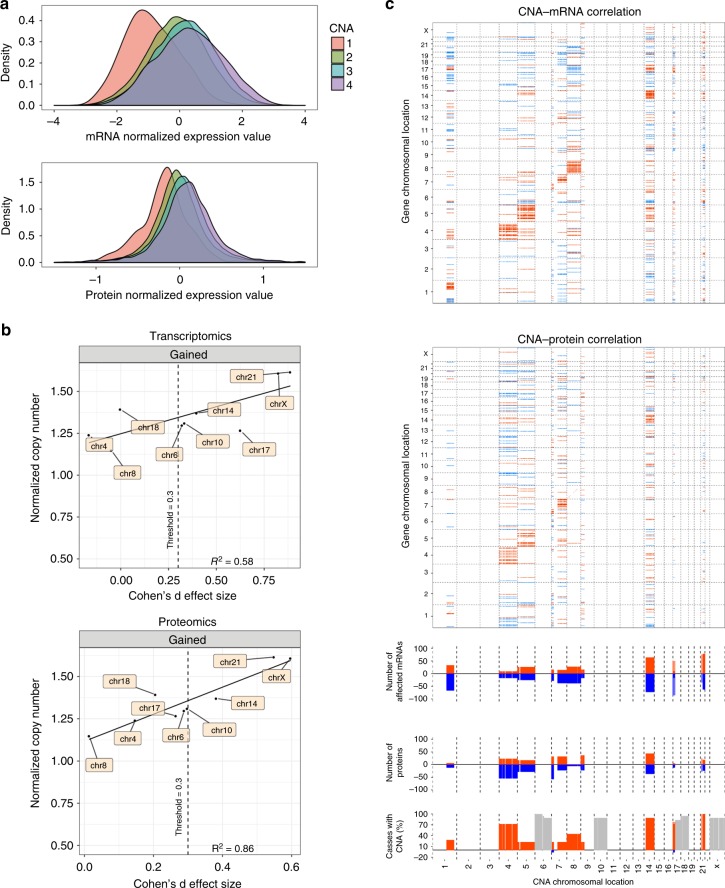
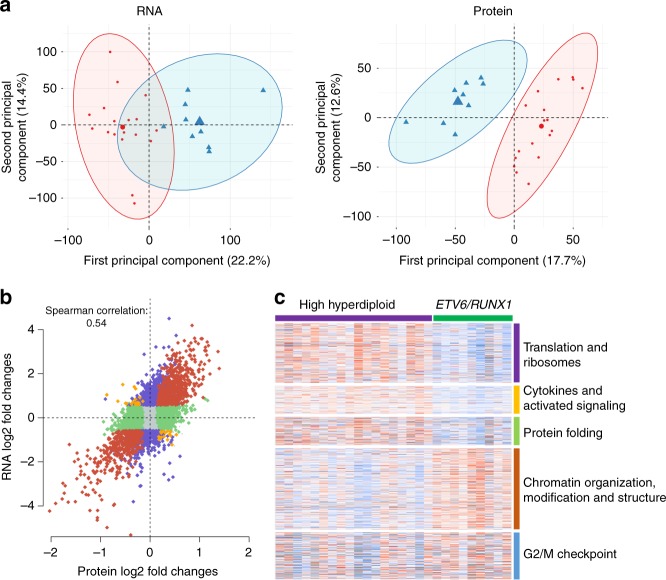
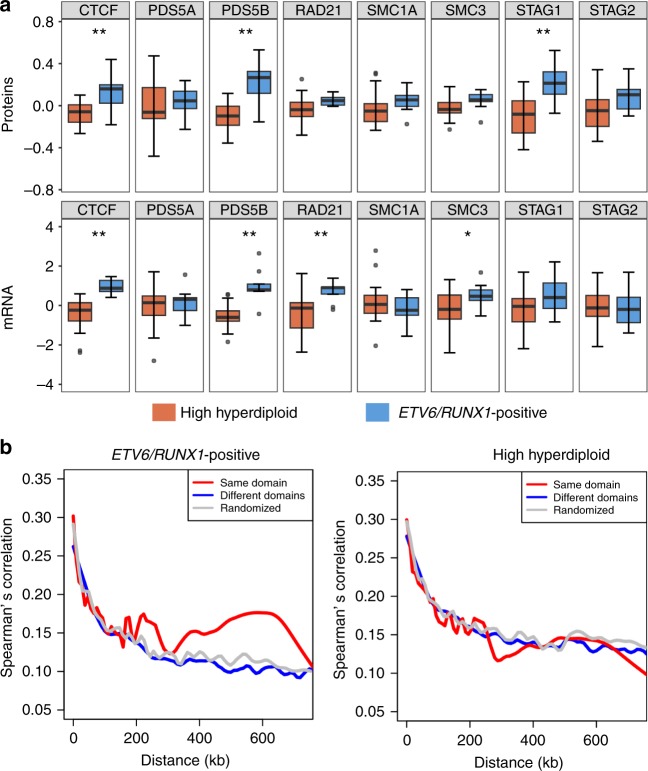
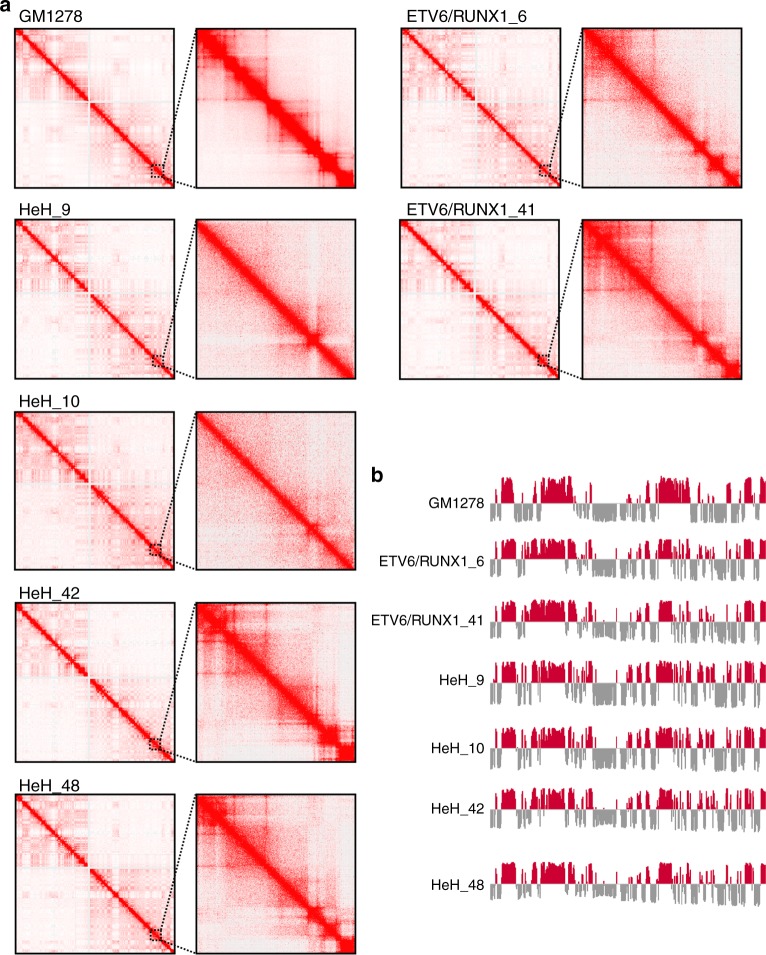
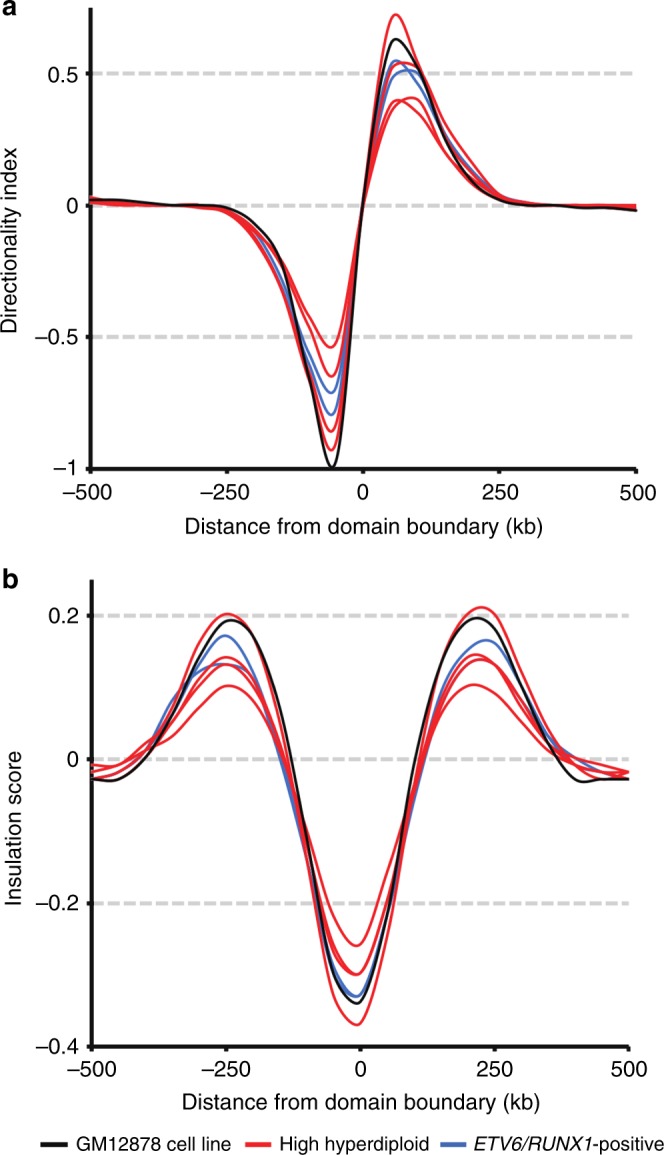
Hyperdiploidy, i.e. gain of whole chromosomes, is one of the most common genetic features of childhood acute lymphoblastic leukemia (ALL), but its pathogenetic impact is poorly understood. Here, we report a proteogenomic analysis on matched datasets from genomic profiling, RNA-sequencing, and mass spectrometry-based analysis of >8,000 genes and proteins as well as Hi-C of primary patient samples from hyperdiploid and ETV6/RUNX1-positive pediatric ALL. We show that CTCF and cohesin, which are master regulators of chromatin architecture, display low expression in hyperdiploid ALL. In line with this, a general genome-wide dysregulation of gene expression in relation to topologically associating domain (TAD) borders were seen in the hyperdiploid group. Furthermore, Hi-C of a limited number of hyperdiploid childhood ALL cases revealed that 2/4 cases displayed a clear loss of TAD boundary strength and 3/4 showed reduced insulation at TAD borders, with putative leukemogenic effects.


Conflict of interest statement

The authors declare no competing interests.

Figures

Fig. 1
Fig. 1
Proteogenomic study of childhood B-cell precursor acute lymphoblastic leukemia (ALL). a Genomic landscape of 27 childhood ALL included in the proteogenomic analysis. All cases were disomic for chromosomes 2, 19, and 20. b Numbers of proteins overlapping across the 3 TMT-sets. c Spearman’s rank order correlation between mRNA and protein abundance. The correlation was positive for 77.6% mRNA-protein pairs in the whole cohort of cases with a mean Spearman’s correlation coefficient of 0.24. Approximately 23% mRNA-protein pairs showed significant correlation (multiple-test adjusted P 0.05). d When investigating different biological processes, mRNA and protein levels displayed the highest correlation for specialized pathways, such as hematopoietic cell lineage and amino acid metabolism, and lowest for house-keeping functions, e.g., ribosomal and spliceosomal processes
Fig. 2
Fig. 2
Effects of copy number alterations on mRNA and protein abundance. a Dosage effects in 18 high hyperdiploid ALL at the RNA and protein levels. The effects were lower on the protein level than on RNA level, showing additional layers of control for protein expression. b Cohen’s d effect size analysis of gained chromosomes in high hyperdiploid vs. ETV6/RUNX1-positive leukemia. c cis and trans effects of copy number changes in 18 cases of hyperdiploid childhood B-cell precursor acute lymphoblastic leukemia. Correlations of copy number aberrations (CNA) (x-axes) to RNA (top) and protein (bottom) expression levels (y-axes) are shown. Note that a large fraction of the genome was not included in the analysis since there was no copy number variance, either because all cases had two copies or because all cases had three copies. Significant (multiple-test adjusted P < 0.05) positive (red) and negative (blue) correlations between CNA and mRNAs/proteins are indicated. CNA cis effects appear as a red diagonal line, CNA trans effects as vertical stripes. The fraction (%) of significant CNA trans effects (positive in red and negative in blue) for each CNA gene is shown below. The bottom panel shows the fraction (%) of leukemias harboring CNA (copy number gain in red and copy number loss in blue). Chromosomes that were gained in more than 16 cases were not informative; their copy number is shown in gray
Fig. 3
Fig. 3
Clustering and enriched pathways in high hyperdiploid and ETV6/RUNX1-positive leukemia. a Principal component analyses of 27 B-cell precursor acute lymphoblastic leukemias showed that high hyperdiploid (red) and ETV6/RUNX1-positive (blue) cases clustered separately in unsupervised analyses by scaled RNA (left) and protein (right) abundance. b There was a linear relationship between the log2 fold changes of RNA-sequencing and proteomics data (Spearman’s correlation coefficient = 0.54) between the high hyperdiploid and ETV6/RUNX1-positive subtypes, demonstrating a high correlation between changes on the transcript and translation levels of an individual gene product. The correlation was stronger for gene/protein pairs with high fold changes. Significant changes found in both RNA-seq and LC-MS/MS are shown in red, inverse changes found in RNA-seq and LC-MS/MS in yellow, significant changes found only in LC-MS/MS in green, and changes only found in RNA-seq in purple. c Gene set enrichment analysis of protein data highlighted sets of pathways that were significantly different between high hyperdiploid and ETV6/RUNX1-positive cases
Fig. 4
Fig. 4
Low CTCF/cohesin expression and transcriptional dysregulation in high hyperdiploid leukemia. a Boxplots of the expression of CTCF and members of the cohesin complex in proteomics (top) and RiboZero RNA-sequencing datasets (bottom). Low expression of CTCF/cohesin complex members was seen in the high hyperdiploid subgroup at both the RNA and protein levels. The center of the boxplot is the median and lower/upper hinges correspond to the first/third quartiles; whiskers are 1.5 times the interquartile range and data beyond this range are plotted as individual points. b Spearman’s correlation coefficient between gene pairs as a function of distance across the oligo(dT) RNA-sequencing dataset for ETV6/RUNX1-positive cases (left; n = 39) and high hyperdiploid ALL (right; n = 44). The analysis showed that the expression of gene pairs in the same topologically associating domain (TAD; red) displayed higher correlation than those in different domains (blue) or randomly selected regions (gray) in ETV6/RUNX1-positive cases, whereas no difference was seen in high hyperdiploid ALL, suggesting that transcriptional dysregulation in hyperdiploid cases is related to TAD borders
Fig. 5
Fig. 5
Hi-C of high hyperdiploid and ETV6/RUNX1-positive cases. a Contact matrices from chromosome 3, selected because it is disomic in all cases and displays no structural aberrations. The whole chromosome at 250 kb resolution is shown to the left and the 161–172 Mb region at 25 kb resolution to the right. At a resolution of 250 kb, the interaction profile is similar, showing that the general chromatin architecture is intact. However, at a resolution of 25 kb, it can clearly be seen that two of the high hyperdiploid cases (HeH_9 and HeH_10) have lost some topologically associating domains. b A/B compartment profile of chromosome 3 in cell line GM12878 and the six leukemia samples at 500 kb resolution. The profiles were similar between the cell line and the leukemias
Fig. 6
Fig. 6
Weaker topologically associating domain (TAD) boundaries in high hyperdiploid samples. a Median standardized directionality index profiles around TAD boundaries identified in high hyperdiploid cases (red), ETV6/RUNX1-positive cases (blue) and the GM12878 cell line (black). Two high hyperdiploid cases (HeH_9 and HeH_10) showed markedly decreased boundary strength, indicating permissive TAD boundaries. b Median insulation score around the TAD boundaries identified in high hyperdiploid cases (red), ETV6/RUNX1-positive cases (blue) and the GM12878 cell line (black). Three high hyperdiploid cases (HeH_9, HeH_10, and HeH_48) showed decreased insulation signal amplitude suggesting weaker insulation between TADs compared to the remaining samples
Fig. 7
Fig. 7
Metaphase chromosome morphology in hyperdiploid leukemia. High hyperdiploid childhood acute lymphoblastic leukemia samples displayed varying metaphase chromosome morphology, but the majority of cases had poor morphology. a Example of metaphase with score 1—poor morphology (case HeH_33). b Example of metaphase with score 2—fair morphology (case HeH_48). c Example of metaphase with score 3—good morphology (case HeH_48)

References

    1. Holland AJ, Cleveland DW. Boveri revisited: chromosomal instability, aneuploidy and tumorigenesis. Nat. Rev. Mol. Cell Biol. 2009;10:478–487. doi: 10.1038/nrm2718. - DOI - PMC - PubMed
    1. Paulsson K, Johansson B. High hyperdiploid childhood acute lymphoblastic leukemia. Genes Chromosomes Cancer. 2009;48:637–660. doi: 10.1002/gcc.20671. - DOI - PubMed
    1. Paulsson K, et al. The genomic landscape of high hyperdiploid childhood acute lymphoblastic leukemia. Nat. Genet. 2015;47:672–676. doi: 10.1038/ng.3301. - DOI - PubMed
    1. Malinowska-Ozdowy K, et al. KRAS and CREBBP mutations: a relapse-linked malicious liaison in childhood high hyperdiploid acute lymphoblastic leukemia. Leukemia. 2015;29:1656–1667. doi: 10.1038/leu.2015.107. - DOI - PMC - PubMed
    1. Bateman CM, et al. Evolutionary trajectories of hyperdiploid ALL in monozygotic twins. Leukemia. 2015;29:58–65. doi: 10.1038/leu.2014.177. - DOI - PubMed

Publication types

MeSH terms