. 2019 Apr 3;9(1):5591.
doi: 10.1038/s41598-019-41849-z.

In vitro neuronal network activity as a new functional diagnostic system to detect effects of Cerebrospinal fluid from autoimmune encephalitis patients

Affiliations

In vitro neuronal network activity as a new functional diagnostic system to detect effects of Cerebrospinal fluid from autoimmune encephalitis patients

Henner Koch et al. Sci Rep. .

Abstract

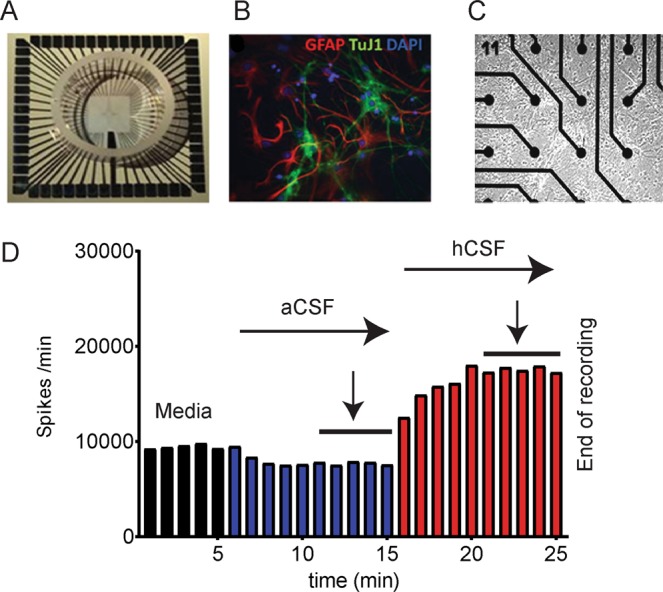
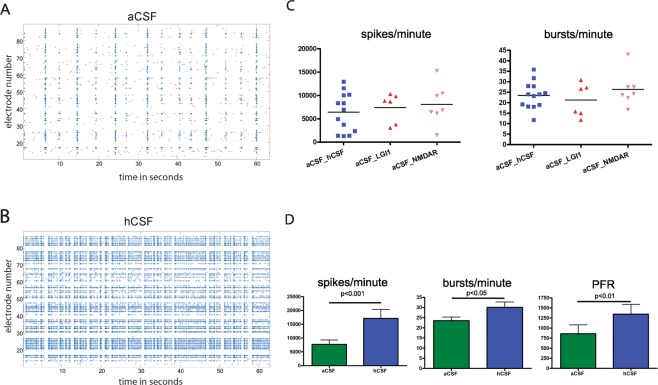
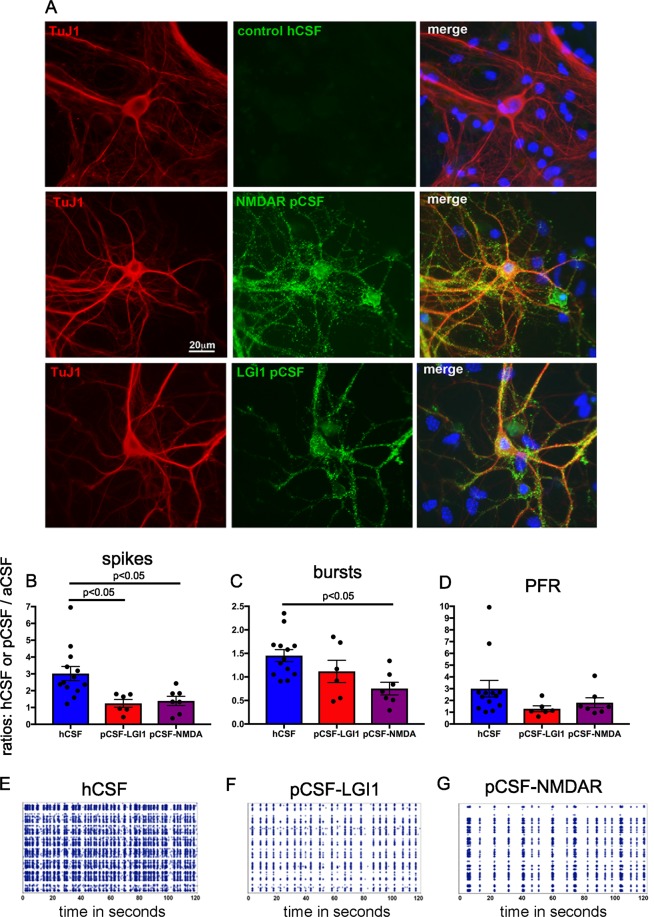
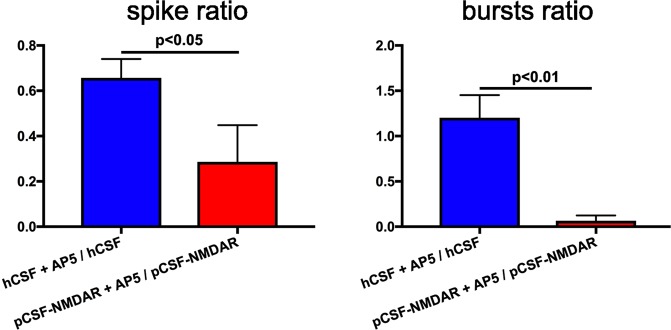
The intent of this study was to investigate if cerebrospinal fluid (CSF) from autoimmune encephalitis (AE) patients regulates in vitro neuronal network activity differentially to healthy human control CSF (hCSF). To this end, electrophysiological effects of CSF from AE patients or hCSF were measured by in vitro neuronal network activity (ivNNA) recorded with microelectrode arrays (MEA). CSF from patients with either N-methyl-D-aspartate-receptor-antibody (pCSFNMDAR, n = 7) or Leucine-rich-glioma-inactivated-1-Ab (pCSFLGI1, n = 6) associated AE suppressed global spiking activity of neuronal networks by a factor of 2.17 (p < 0.05) or 2.42 (p < 0.05) compared to hCSF. The former also suppressed synchronous network bursting by a factor of 1.93 (p < 0.05) in comparison to hCSF (n = 13). As a functional diagnostic test, this parameter reached a sensitivity of 86% for NMDAR-Ab- and 100% for LGI1-Ab-associated AE vs. hCSF at a specificity of 85%. To explore if modulation at the NMDAR influences effects of hCSF or pathological CSF, we applied the NMDAR-antagonist 2-Amino-5-phosphono-pentanoic acid (AP5). In CSF from NMDAR-Ab-associated AE patients, spike rate reduction by AP5 was more than 2-fold larger than in hCSF (p < 0.05), and network burst rate reduction more than 18-fold (p < 0.01). Recording ivNNA might help discriminating between functional effects of CSF from AE patients and hCSF, and thus could be used as a functional diagnostic test in AE. The pronounced suppression of ivNNA by CSF from NMDAR-Ab-associated AE patients and simultaneous antagonism at the NMDAR by AP5, particularly in burst activity, compared to hCSF plus AP5, confirms that the former contains additional ivNNA-suppressing factors.


Conflict of interest statement

The authors declare no competing interests.

Figures

Figure 1
Figure 1
MEA System and experimental design. In (A) a whole MEA chip is depicted. In (B) a photomicrograph illustrates GFAP-positive (red) astrocytes and β−tubulin-positive (green) neurons. The blue color marks cell nuclei. (C) shows the neural population situated around some MEA electrodes. (D) Experimental design and exemplary spike rate response to exchange from culture media (black bars) to aCSF (blue bars) to hCSF (red bars). Measurements for quantification were taken at the last five minutes (marked by arrow) of aCSF and hCSF (of patients or healthy controls).
Figure 2
Figure 2
Human control CSF increases ivNNA in comparison to artificial CSF. (A,B) Shown are spike raster plots (SRPs) with time in seconds on the x-axis and electrode numbers (1–100) on the y-axis. Every single dot represents an extracellularly detected spike from neurons nearby individual electrodes. If spikes appear vertically aligned, spatially distributed neurons fire synchronized sequences of spikes termed network bursts, separated by quiescent periods. Between network bursts, activity gaps can be seen (inter burst intervals) with only some non-synchronized spikes. Note, SRPs under the influence of hCSF show more densely packed network bursts. (C) Baseline spike and burst rates recorded in aCSF prior to application of either hCSF, pCSFLGI1 or pCSFNMDAR are shown: aCSF_LGI1, for instance, shows the baseline spike rate in aCSF before pCSFLGI1 was added. Only MEAs were used with a spike rate between 1,000 and 16,000 spikes/minute and a burst rate between 10 and 50 bursts/minute. The baseline spike rate per minute under aCSF of all 26 MEAs used for our experiments was between 1,287 and 15,236 (7,089 ± 766; 95% confidence interval 5,511–8,666). The burst rate per minute was between 12 and 43 (24 ± 1; 95% confidence interval 21–27). There was no significant difference between the baseline spike rates in the presence of aCSF used for later application of either hCSF, pCSFLGI1 or pCSFNMDAR (D).
Figure 3
Figure 3
CSF from NMDAR-Ab encephalitis patients contains neuronal antibodies and does not increase  ivNNA in comparison to aCSF. (A) To verify the presence of neuronal antibodies in CSF from NMDAR-Ab or LGI1-Ab patients, we applied pCSF and hCSF samples on non-permeabilized dissociated primary mouse hippocampal neurons (10 days in vitro, βtubulin, TuJ1, immunocytochemistry, red) that are known to express NMDARs containing the target antigens. Indeed, pCSFNMDAR and pCSFLGI1 showed a strong immunoreactivity (green) with overlap on neurons (merged photomicrograph, yellow), while control samples (hCSF) did not. In (BD) ratios of absolute values for spikes/minute, bursts/minute and PFR  are given. We calculated the respective values for human CSF (either hCSF from controls, n = 13; pCSFLGI1, n = 6; or pCSFNMDAR, n = 7) divided by those for aCSF: pCSF-LGI1, for instance, shows the value pCSFLGI1/aCSF. Shown are all individual samples as dots, the mean value as bar graph, and error bars represent S.E.M. In (EG) spike raster plots (SRPs) are illustrated, visualizing the decreased activity under the influence of pCSFNMDAR (G) or pCSFLGI1 (F) compared to hCSF (E).
Figure 4
Figure 4
AP5 decreases network activity significantly more in pCSFNMDAR. In (A,B) effects of 50 μM AP5 on ivNNA under hCSF or pCSFNMDAR influence are illustrated with the ratios given on the y-axis. Ratios of spike or burst activity after/before application of AP5 to hCSF or pCSFNMDAR are given as illustrated on the x-axis. Note, AP5 reduced (below 1) spiking activity under hCSF and, even more, under pCSFNMDAR. However, the number of network bursts under hCSF remained nearly unchanged after AP5 application (around 1), with almost no remaining network bursts after AP5 application in pCSFNMDAR. For hCSF, we used 8 different CSF samples and performed 17 independent recordings in different MEA cultures. For pCSFNMDAR, we used 3 different CSF samples and performed 8 independent recordings. Error bars represent S.E.M.

References

    1. Graus F, et al. A clinical approach to diagnosis of autoimmune encephalitis. Lancet Neurol. 2016;15:391–404. doi: 10.1016/S1474-4422(15)00401-9. - DOI - PMC - PubMed
    1. Bien CG, Holtkamp M. Autoimmune Epilepsy: Encephalitis With Autoantibodies for Epileptologists. Epilepsy Curr. 2017;17:134–141. doi: 10.5698/1535-7511.17.3.134. - DOI - PMC - PubMed
    1. Lee SK, Lee S-T. The Laboratory Diagnosis of Autoimmune Encephalitis. J. epilepsy Res. 2016;6:45–50. doi: 10.14581/jer.16010. - DOI - PMC - PubMed
    1. Dalmau J, Furneaux HM, Gralla RJ, Kris MG, Posner JB. Detection of the anti-Hu antibody in the serum of patients with small cell lung cancer?A quantitative western blot analysis. Ann. Neurol. 1990;27:544–552. doi: 10.1002/ana.410270515. - DOI - PubMed
    1. Dalmau, J. et al. Anti-NMDA-receptor encephalitis: case series and analysis of the effects of antibodies. Lancet Neurol., 10.1016/S1474-4422(08)70224-2 (2008). - PMC - PubMed

Publication types

MeSH terms

Substances

Supplementary concepts