. 2019 Apr;568(7753):546-550.
doi: 10.1038/s41586-019-1087-5. Epub 2019 Apr 3.

Nuclear positioning facilitates amoeboid migration along the path of least resistance

Affiliations

Nuclear positioning facilitates amoeboid migration along the path of least resistance

Jörg Renkawitz et al. Nature. 2019 Apr.

Abstract

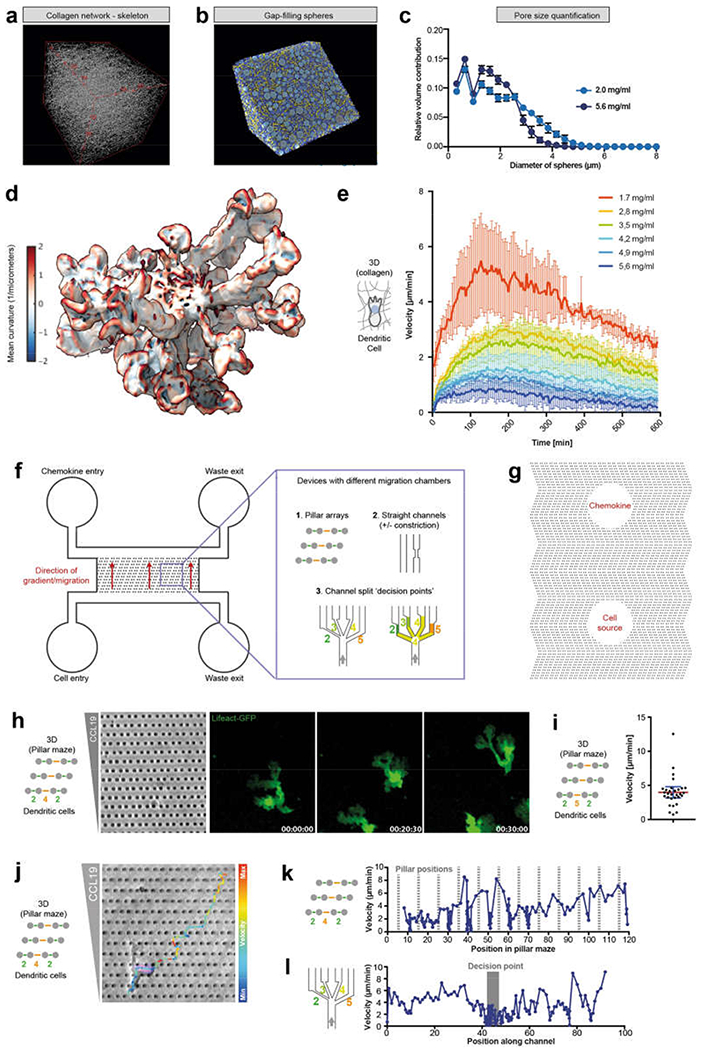
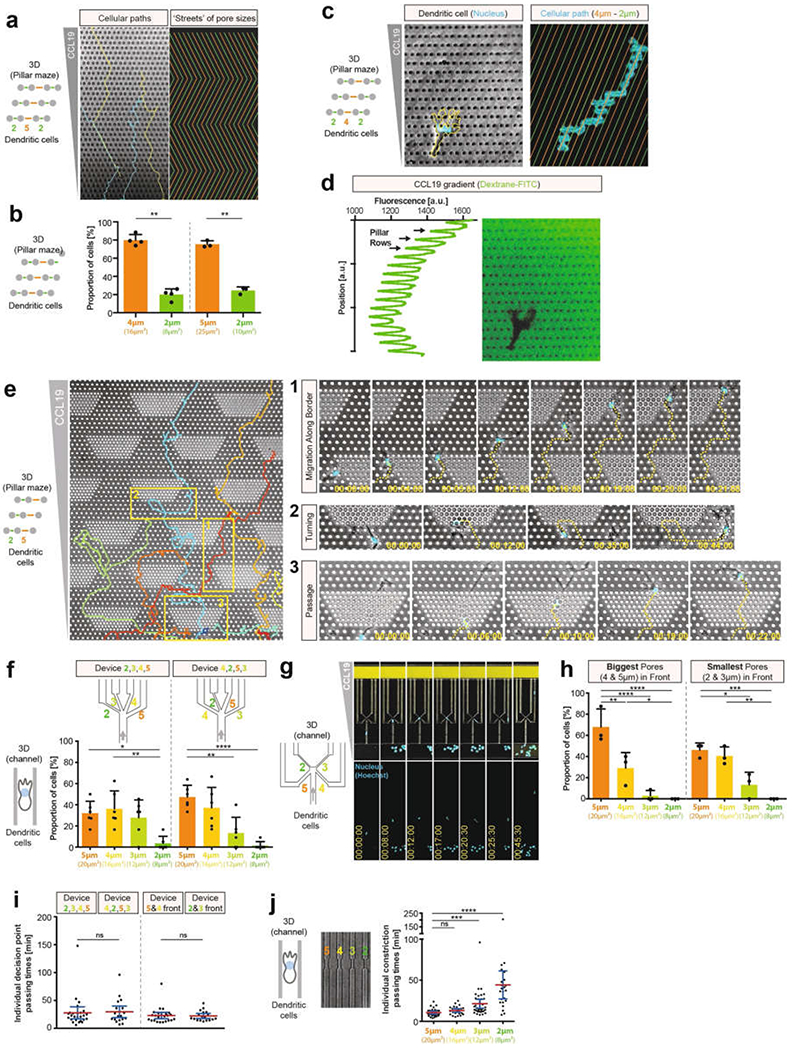
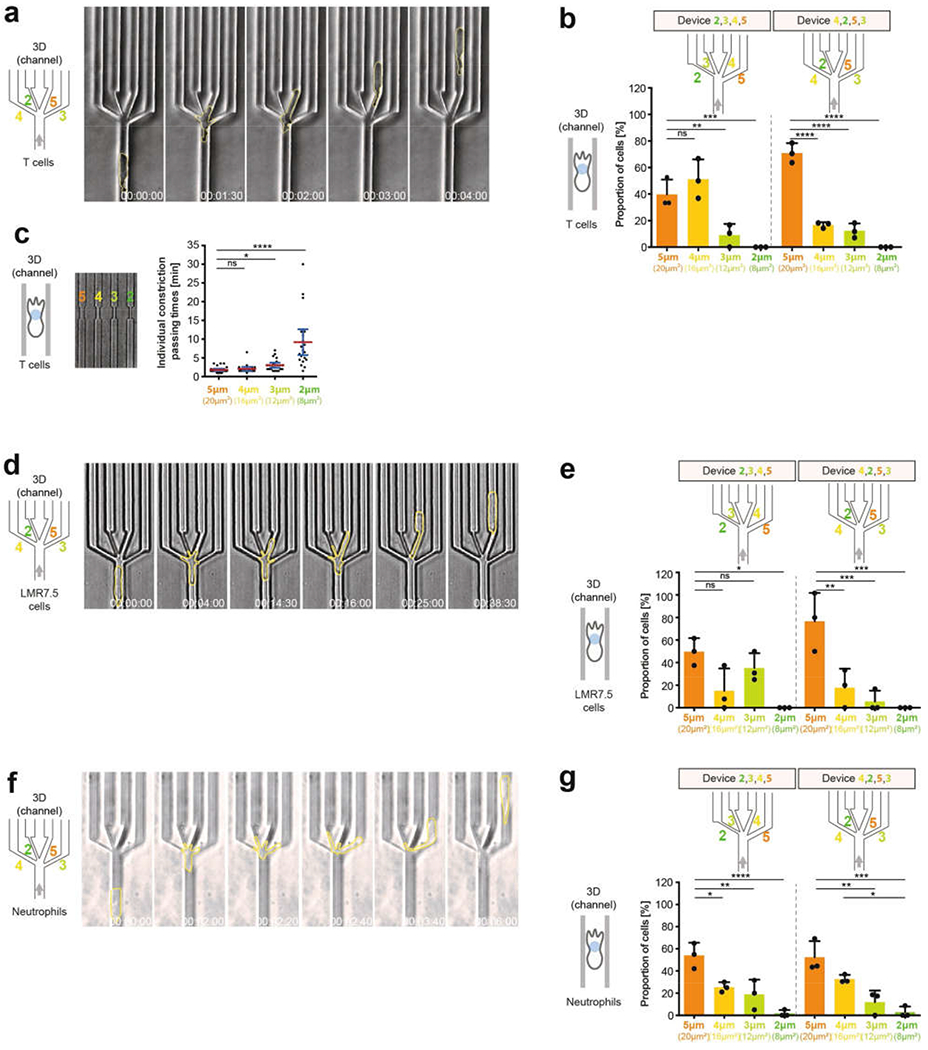
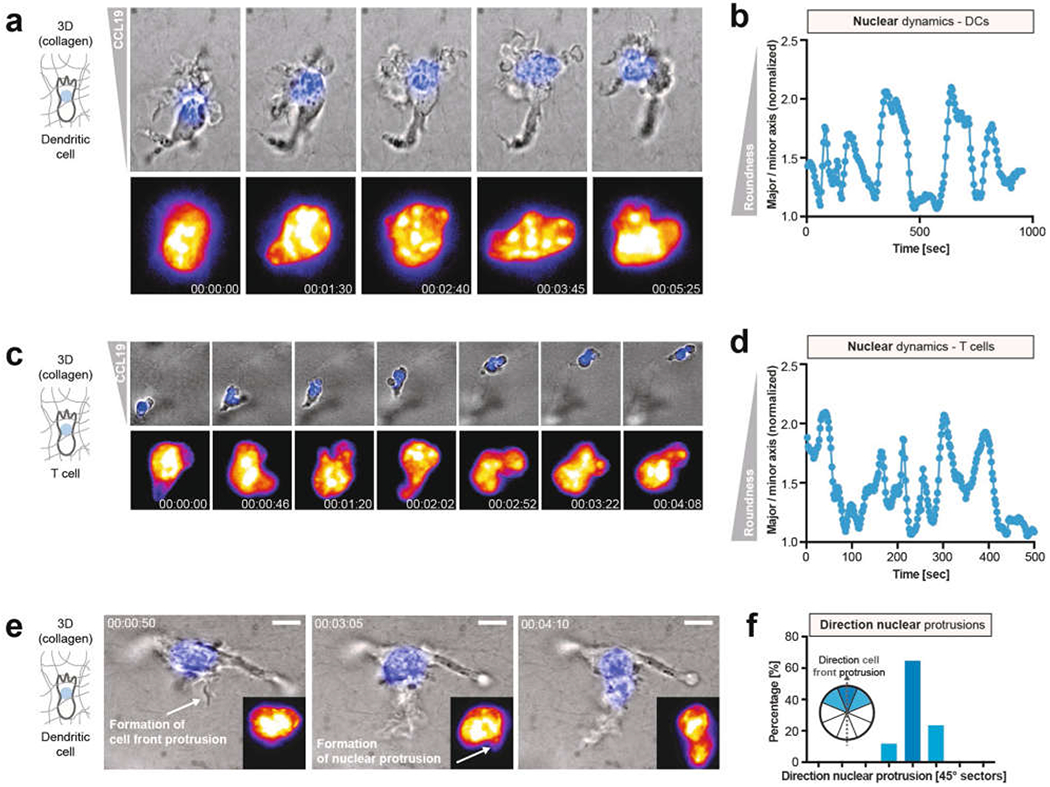
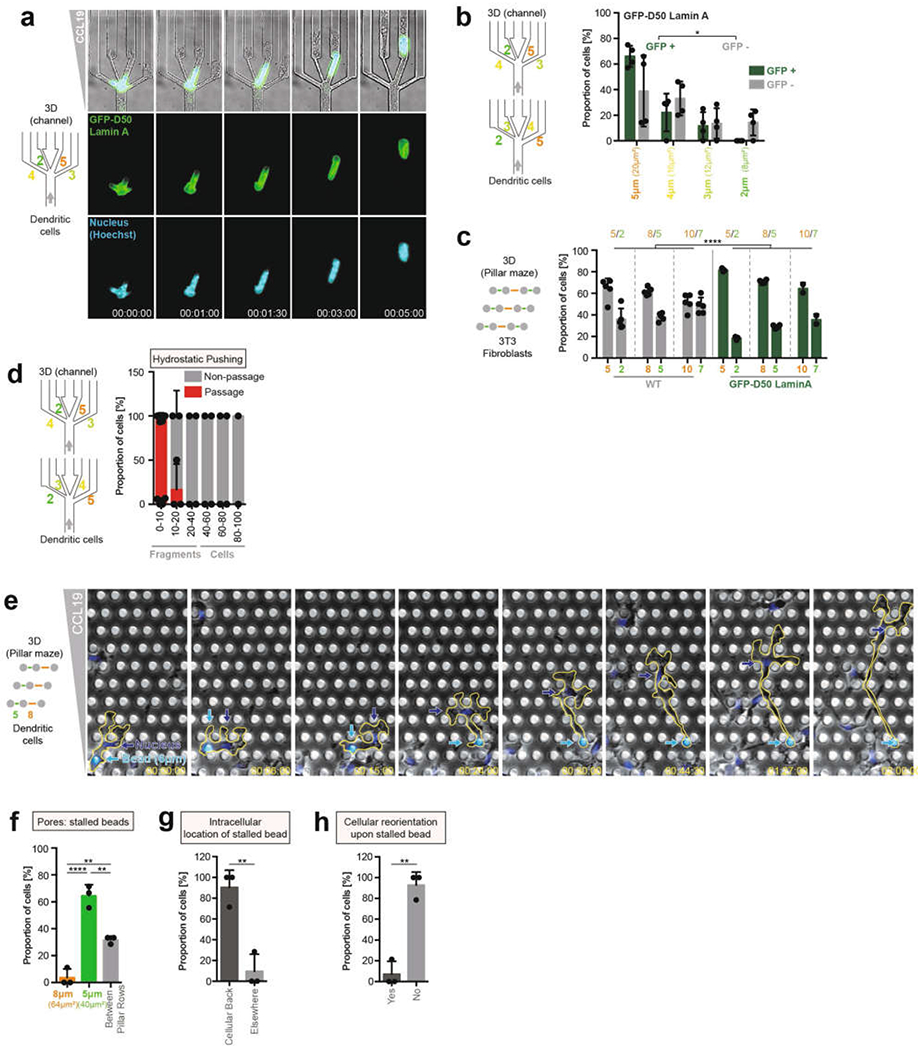
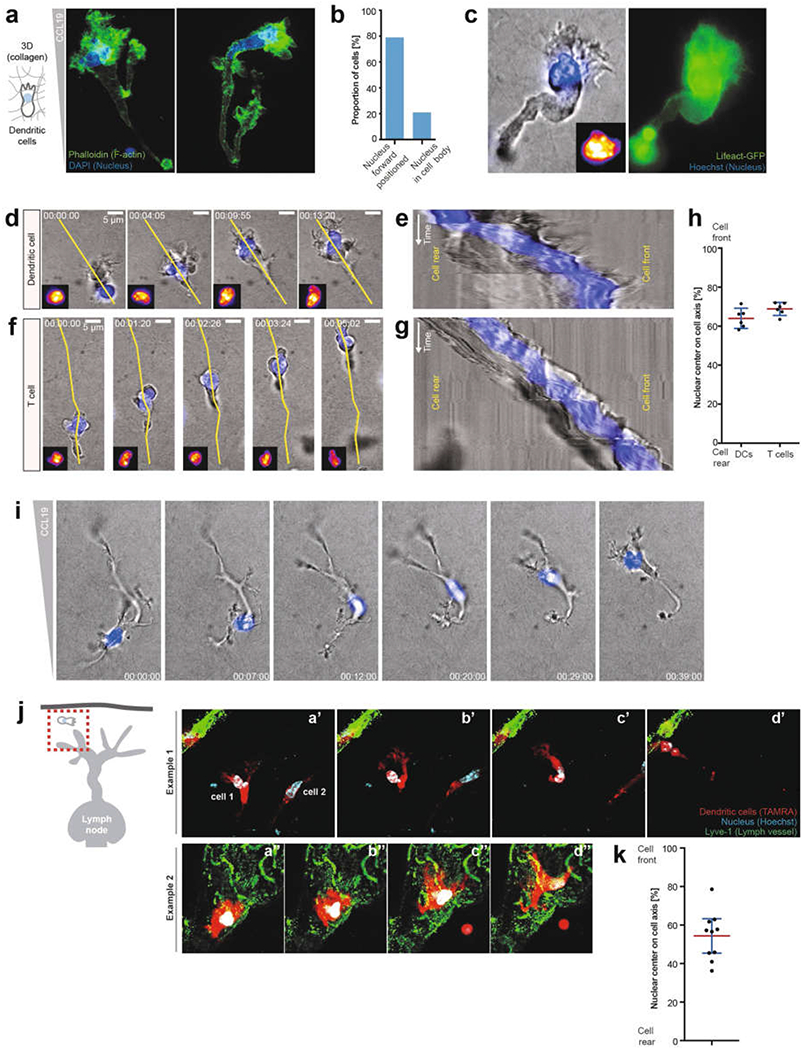
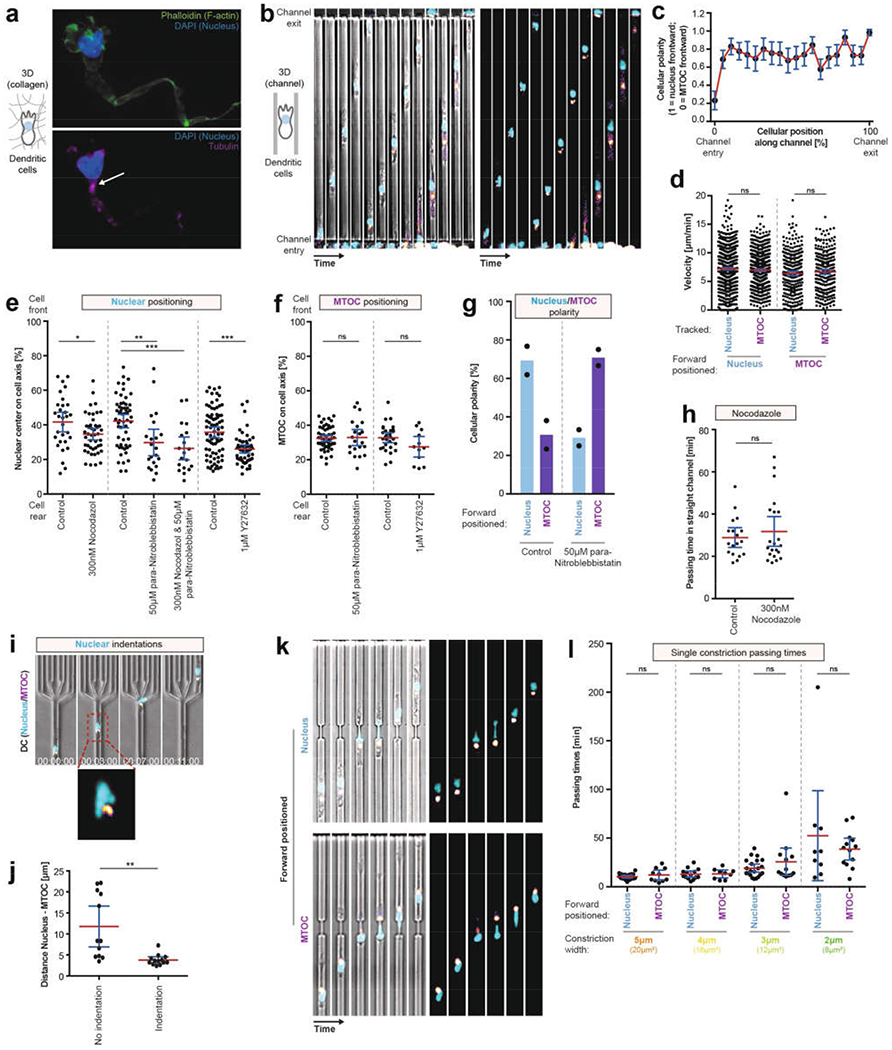
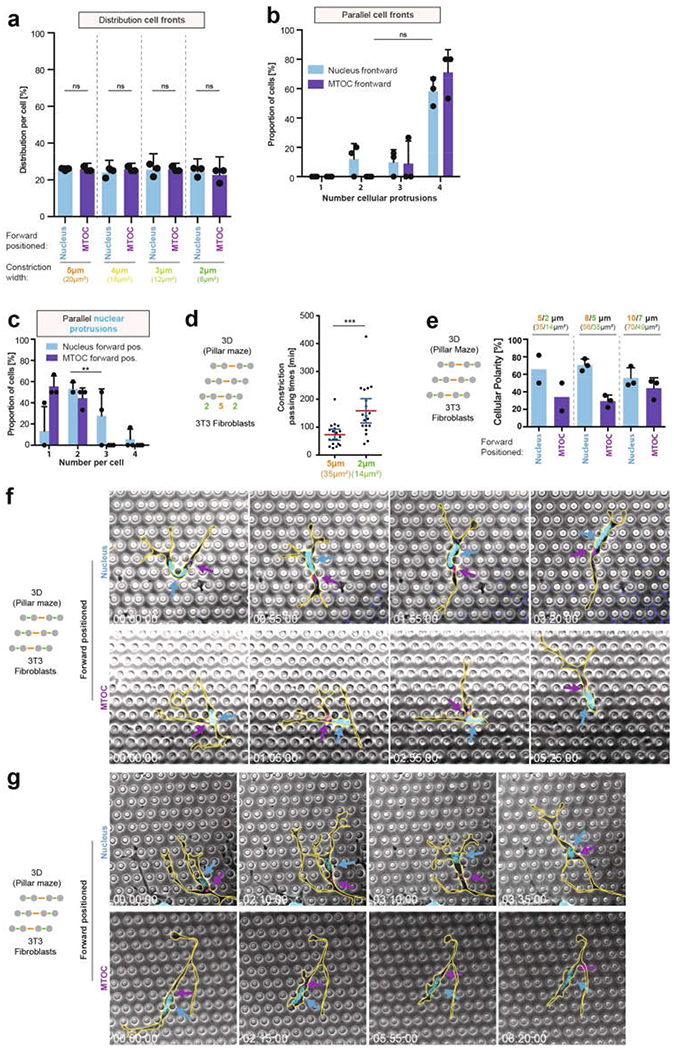
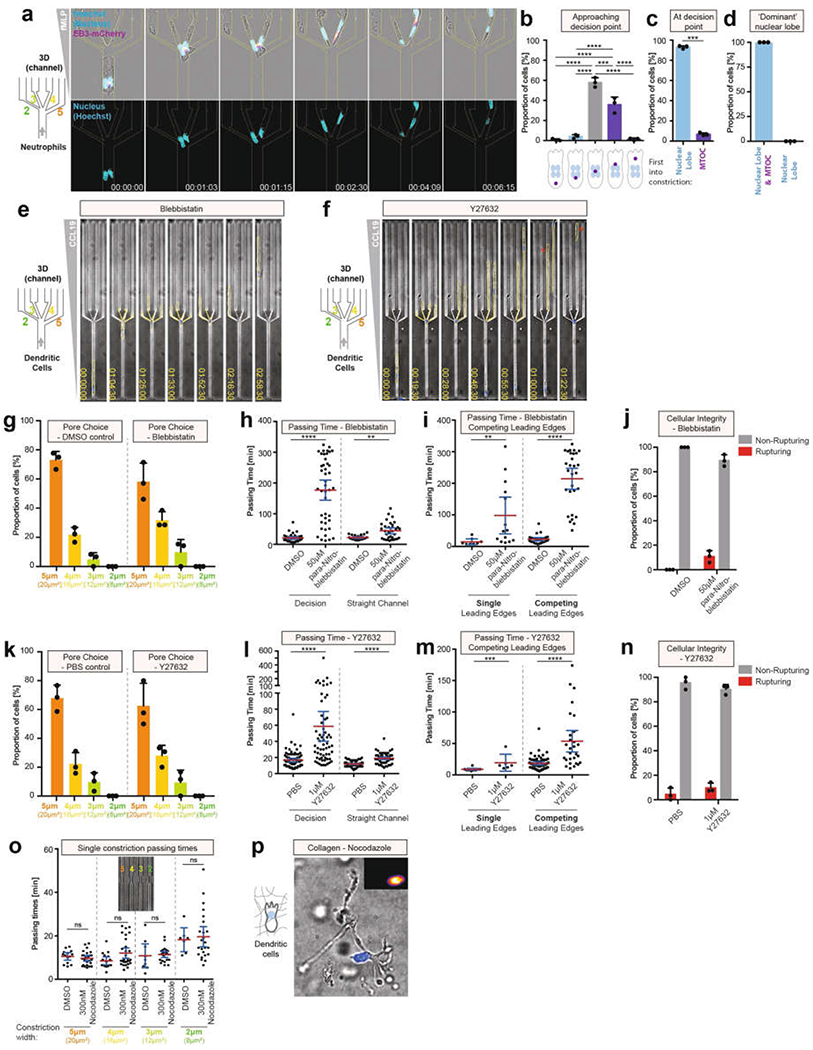
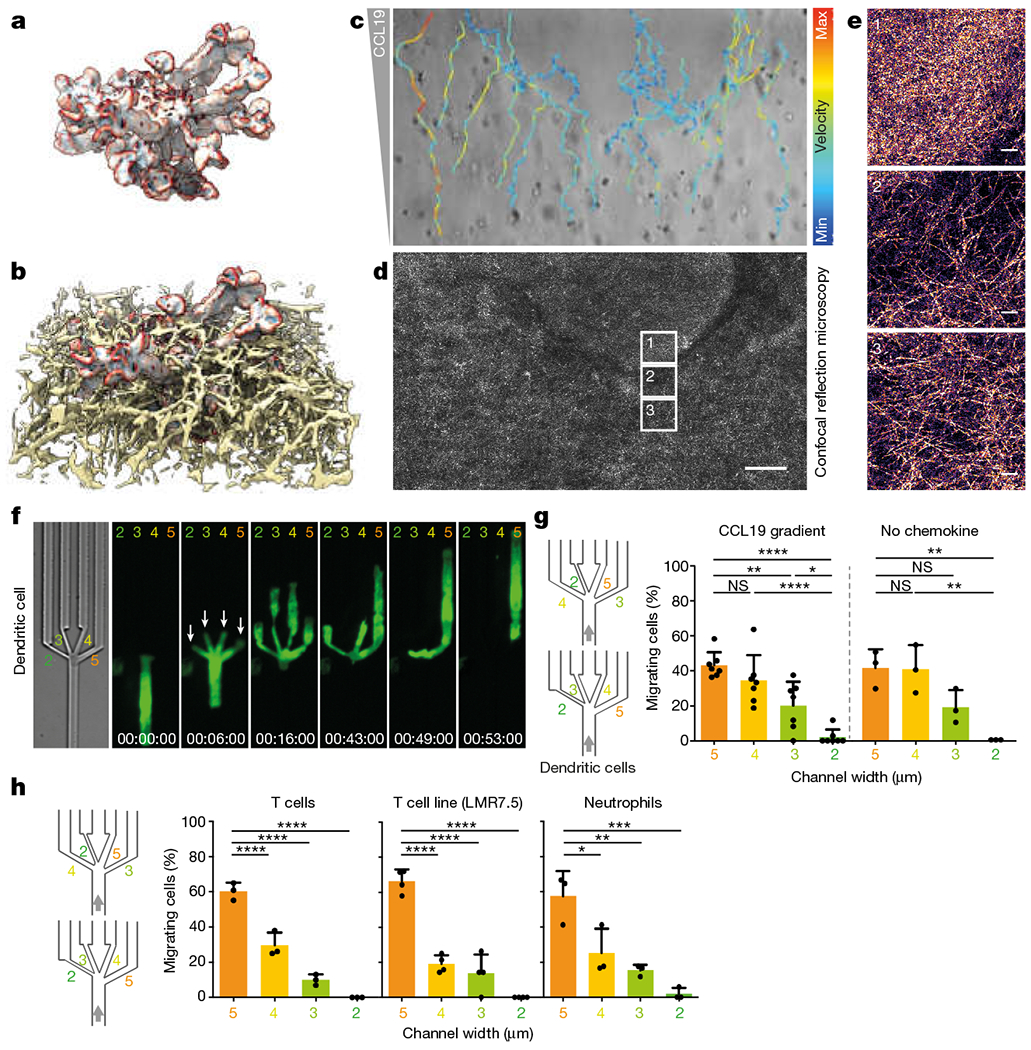
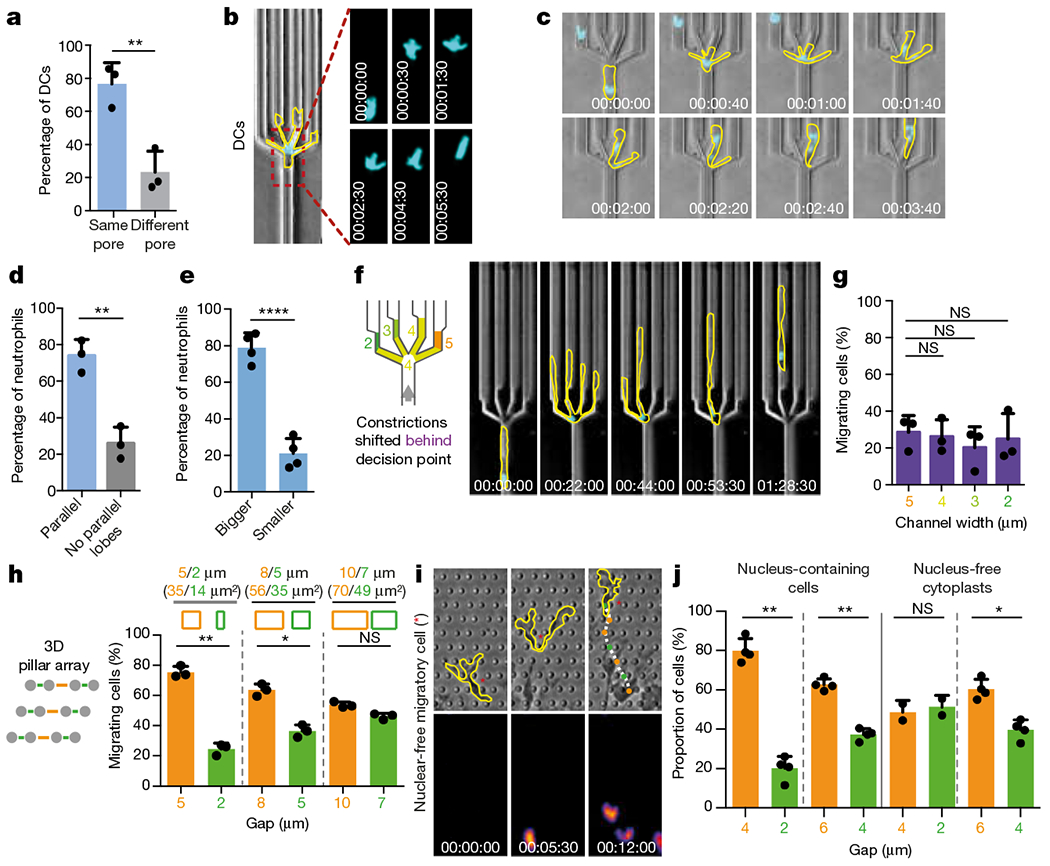
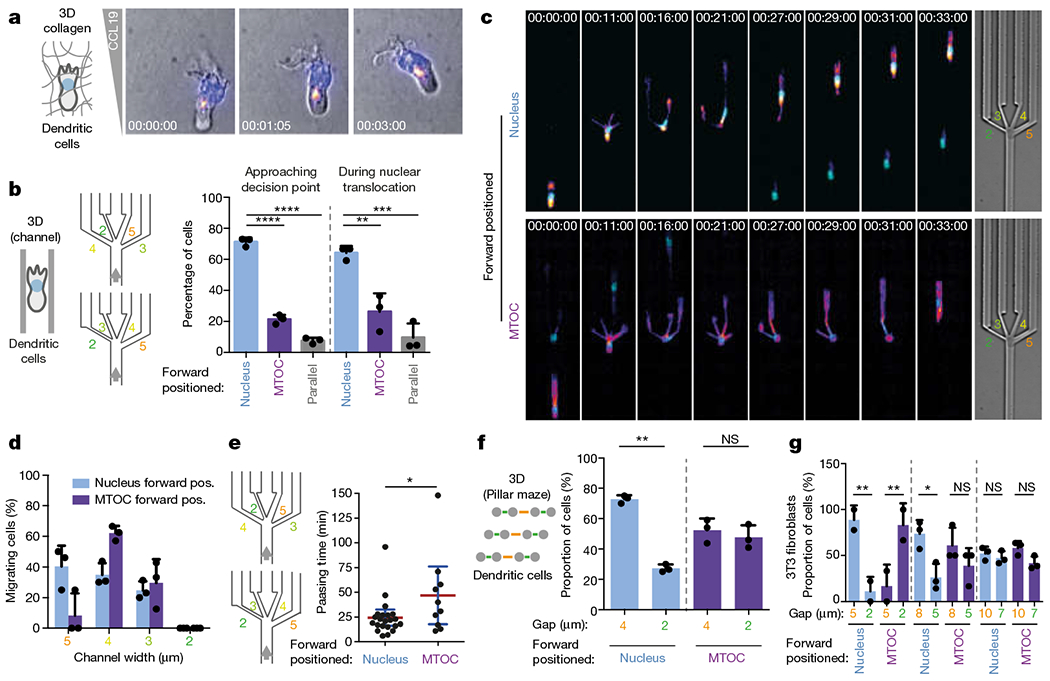
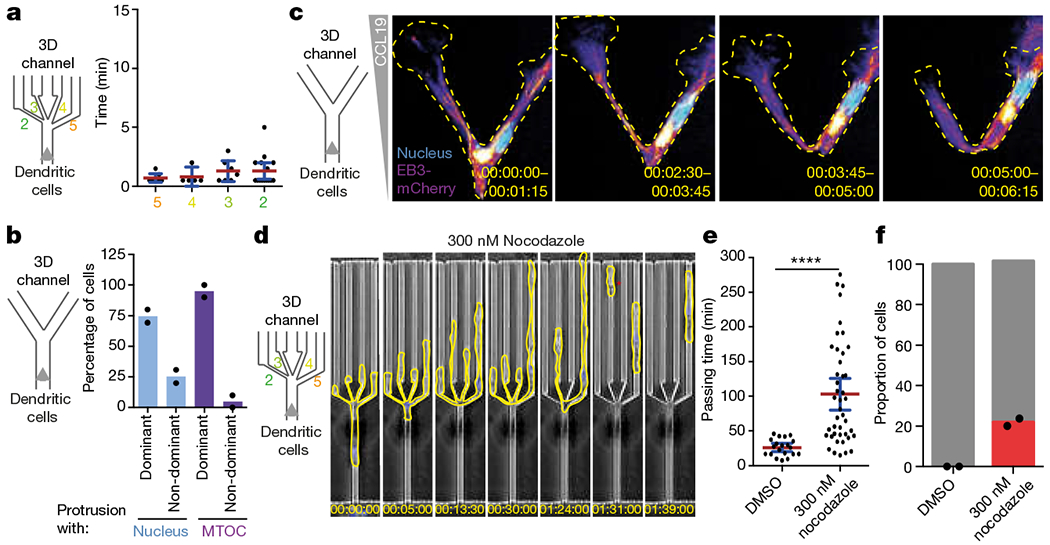
During metazoan development, immune surveillance and cancer dissemination, cells migrate in complex three-dimensional microenvironments1-3. These spaces are crowded by cells and extracellular matrix, generating mazes with differently sized gaps that are typically smaller than the diameter of the migrating cell4,5. Most mesenchymal and epithelial cells and some-but not all-cancer cells actively generate their migratory path using pericellular tissue proteolysis6. By contrast, amoeboid cells such as leukocytes use non-destructive strategies of locomotion7, raising the question how these extremely fast cells navigate through dense tissues. Here we reveal that leukocytes sample their immediate vicinity for large pore sizes, and are thereby able to choose the path of least resistance. This allows them to circumnavigate local obstacles while effectively following global directional cues such as chemotactic gradients. Pore-size discrimination is facilitated by frontward positioning of the nucleus, which enables the cells to use their bulkiest compartment as a mechanical gauge. Once the nucleus and the closely associated microtubule organizing centre pass the largest pore, cytoplasmic protrusions still lingering in smaller pores are retracted. These retractions are coordinated by dynamic microtubules; when microtubules are disrupted, migrating cells lose coherence and frequently fragment into migratory cytoplasmic pieces. As nuclear positioning in front of the microtubule organizing centre is a typical feature of amoeboid migration, our findings link the fundamental organization of cellular polarity to the strategy of locomotion.


Conflict of interest statement

Competing interests The authors declare no competing interests.

Figures

Extended Data Fig. 1 |
Extended Data Fig. 1 |. DC migration in 3D collagen matrices of different densities and microfluidic assays to study cell migration through defined inhomogeneous spaces.
a, Skeleton representation of the collagen matrix (labelled with Alexa Fluor 568) imaged by light-sheet microscopy with isotropic, subcellular 3D resolution (4 experiments). b, Pore-size analysis by filling 3D spheres (blue) between the collagen fibres (yellow) based on the skeleton representation in a. c, Quantification of pore sizes as in b for two different collagen concentrations (2.0 and 5.6 mg ml−1; n = 4 cells each; mean ± s.d.). d, Magnification of Fig. 1a, showing an example of a DC (labelled with LifeAct–GFP) with multiple protrusions (with veil like shapes) embedded in a 3D collagen matrix and coloured by surface curvature (regions of large positive and large negative curvature in red and blue, respectively; see scale bar), e, Migration velocities (average displacement in direction of the chemokine gradient over time) of DCs in collagen matrices of different collagen concentrations (1.7–5.6 mg ml−1) along a CCL19 gradient, highlighting the ability of DCs to migrate even in high collagen densities (5.6 mg ml−1), but with a reduced velocity. Data are mean ± s.d. (n = 4 experiments). f, Scheme of the PDMS-based microfluidic setup used to analyse cell migration in different defined microenvironments. In brief, cells and chemokine were flushed separately from two different entrances into two main channels, which are connected either by pillar arrays or different types of channels. On stopping the flow, a chemokine gradient was established and cells migrated into the connecting area (Methods). g, Alternative PDMS-based migration chamber setup, in which cells are placed in one hole and a chemokine is placed in the other; the holes are connected by arrays of pillars (Methods). h, Typical shape of a DC (labelled with LifeAct-GFP) with multiple cell fronts, migrating in a CCL 19 gradient (left) through a pillar array with 2 μm and 4 μm pores, arranged to generate streets’ of large (orange) and small (green) pores (2 experiments), i, Migration velocities of DCs through a pillar array of 2 μm and 5 μm pores (30 cells); data are mean ± 95% CI. j, Velocity (colour-coded) of a representative DC migrating through a pillar array of 2 μm and 4 μm pores (2 experiments). k, Quantification of e, showing cellular deceleration before pore translocation even before passing large pores (2 experiments). l, DC velocity before, during and after pore-size decision, when migrating in a microchannel through a junction (decision point) of four differently sized pores of 2, 3, 4 and 5 μm width (2 experiments). During this ‘decision time’, DCs feature multiple parallel cell fronts and cellular protrusions (see Fig. 1).
Extended Data Fig. 2 |
Extended Data Fig. 2 |. DC migration through defined inhomogeneous spaces.
a, Tracks (left; blue, yellow) of DCs migrating long distances through pillar arrays (2 μm and 5 μm pores; 5 μm height), in which ‘streets’ of pore size change orientation after ten pores (right panel, ‘streets’ of large and small pores in orange and green, respectively) (3 experiments). b, Left, quantification of DC pore-size preference in pillar forests depicted in c (4 experiments, 23 cells, 231 pore passages; paired t-test, **P = 0.0023). Right, quantification of DC pore-size preference in a (3 experiments, 21 cells, 312 pore passages; paired t-test, **P = 0.0073). c, Similar to a, but with different pore sizes and pillar arrangements, showing that DCs (nucleus (Hoechst stain) in cyan, cell outlines in yellow) can deviate from the most direct chemokine gradient (CCL19) along the path of least resistance (2 μm and 4 μm pores; arranged to generate streets (top right) of large (orange) and small (green) pores) (3 experiments). d, CCL19 gradient in a visualized by dextran–FITC (3 experiments). e, Pillar forests with dense pillar islands (2 μm pores) within a surrounding area with lower pillar density (5 μm pores). Insets are expanded on the right, showing examples of small-pore avoidance by migration along boundaries of small-pore islands (1) or turning (2), and small-pore translocation when cells encounter dense pillar islands head-on (3) (3 experiments). f, As in Fig. 1g (left), but showing the results of the pore-size preference of DCs in individual devices with different orders of pore sizes (3 experiments, 27 cells in device 1, 30 cells in device 2); one-way ANOVA with Tukey’s test; ****P < 0.0001, **P = 0.0016, *P = 0.0159). g, DC migration through microchannels with a decision point with two small pores (2 μm and 3 μm wide) directly in the migration direction, and two larger pores (4 μm and 5 μm wide) diagonally against the direction of migration (3 experiments). h, Quantification of g, comparing alternative orientations (small pores in front versus in the back) (3 experiments, 61 cells; one-way ANOVA with Tukey’s test; left: ****P < 0.0001, **P = 0.0037, *P = 0.0389; right panel, ***P = 0.0007, **P = 0.0025, *P = 0.0157). i, Quantification of passing times in devices with different pore-size arrangements as in f and h (3 experiments; 26,29, 25 and 18 cells, left to right, respectively; Kruskal–Wallis with Dunn’s test). j, DC passing times through the same pore sizes as in d, f and Fig. 1g, but without the possibility of pore selection (single pores; 3 experiments, 114 cells; Kruskal–Wallis with Dunn’s test; ****P < 0.0001, ***P = 0.0002). Data in a, b, f and h are mean ± s.d.; data in i and j are mean ± 95% CI.
Extended Data Fig. 3 |
Extended Data Fig. 3 |. Migration of T cells, LMR7.5 cells and neutrophils through defined inhomogeneous spaces.
a, Image sequence of a representative T cell (cell outlines in yellow) migrating in microchannels through a junction (decision point) with pores 2, 3,4 and 5 μm wide (3 experiments). b, As in Fig. 1h, but showing the results of the pore-size preference of T cells in individual devices with different sequences of pore sizes (3 experiments, 37 (left) or 42 (right) cells; one-way ANOVA with Tukey’s test; ****P < 0.0001, ***P = 0.0003, **P = 0.0045). c, Passing times for T cells through the same pore sizes as in Fig. 1h, but without the possibility of pore choice (single pores; 3 experiments, 90 cells; Kruskal–Wallis with Dunn’s test; ****P < 0.0001, *P = 0.0128). d, Image sequence of a representative LMR7.5 T cell hybridoma cell (cell outlines in yellow) migrating in microchannels through a decision point with exits 2, 3, 4 and 5 μm wide (3 experiments). e, As in Fig. 1h, but showing the results of the pore-size preference of LMR7.5 T cell hybridoma cells in individual devices with different sequences of pore sizes (3 experiments, 23 (left) or 17 (right) cells; one-way ANOVA with Tukey’s test; ***P = 0.0002, ***P = 0.0004, **P = 0.0030, *P = 0.0132 (left to right), respectively). f, Image sequence of a representative neutrophil (cell outlines in yellow) migrating in microchannels through a decision point with pores 2, 3, 4 and 5 μm wide (height 2 μm) (3 experiments). g, As in Fig. 1h, but showing the results of the pore-size preference for neutrophils in individual devices with different sequences of pore sizes (3 experiments, 59 (left) or 63 (right) cells; one-way ANOVA with Tukey’s test; left: ****P < 0.0001, **P = 0.0054, *P = 0.0284; right: ***P = 0.0002, **P = 0.0014, *P = 0.0212). Data in b, e and g are mean ± s.d.; data in c are mean ± 95% CI.
Extended Data Fig. 4 |
Extended Data Fig. 4 |. Dynamic nuclear protrusions during pore-size decisions.
a, Quantification of the translocation of cell fronts through the differently sized pores (3 exeriments, 71 cells, 237 lamellipodia; one-way ANOVA with Tukey’s test). b, Number of cell front protrusions per cell during four-way pore-size decision (3 experiments, 62 cells). c, Quantification of cell front protrusion retractions before cell body (nuclear) passage (3 experiments, 101 lamellipodia). d, Quantification of initial nuclear protrusions into the different pore sizes during pore-size decision (3 experiments, 51 cells, 164 nuclear protrusions; one-way ANOVA with Tukey’s test; ***P = 0.0003). e, Number of parallel nuclear protrusions per cell during pore-size decision (3 experiments, 51 cells). f, Pore-size selection for the larger, intermediate or smaller pore when there are parallel nuclear lobes (3 experiments, 50 cells; one-way ANOVA with Tukey’s test; **P = 0.0025 (bigger vs intermediate), **P = 0.0021 (bigger vs smaller)). g, Maximal nuclear protrusion depth into non-chosen pores (9 cells (5 μm), 27 cells (4 μm), 25 cells (3 μm) and 27 cells (2 μm); Kruskal–Wallis with Dunn’s test; ****P < 0.0001, **P = 0.0058, *P = 0.0474). h, Frequent and parallel nuclear protrusions (nucleus (Hoechst) in cyan) of migrating DCs navigating through a pillar array with 2 μm and 4 μm pores (3 experiments). i, Nuclear protrusions of a T cell (nucleus (Hoechst) in cyan; cell outlines in yellow) migrating in microchannels through a decision point of four differently sized pores of 2, 3, 4 and 5 μm width (3 experiments). j, Nuclear protrusions of a LMR7.5 T cell hybridoma (nucleus (Hoechst) in cyan; EB3–mCherry in green) migrating in microchannels through a decision point of four differently sized pores of 2, 3,4 and 5 μm width (3 experiments). Data in af are mean ± s.d.; data in g are mean ± 95% CI.
Extended Data Fig. 5 |
Extended Data Fig. 5 |. Dynamic nuclear protrusions during 3D migration in collagen matrices.
a, Nuclear-labelled (top panels, blue; bottom panels, fire colour-coded intensity) DC migrating in a collagen matrix along a CCL19 gradient, depicting the various shapes adopted by the nucleus (3 experiments). b, Nuclear shape changes over time of a DC migrating in a 3D collagen matrix, highlighting the dynamic transitions between rounded and more deformed shapes (3 experiments), c, Nuclear-labelled (top panels, blue; bottom panels, fire-colour-coded intensity) T cell migrating in a collagen matrix along a CCL19 gradient, highlighting the various shapes adopted by the nucleus (3 experiments). d, Nuclear shape changes over time of a T cell migrating in a 3D collagen matrix, highlighting the dynamic transitions between rounded and more deformed shapes (3 experiments). e, DC during formation of a new cell front protrusion, followed by a nuclear protrusion in the direction of the new cell front (3 experiments). f, Quantification of the direction of nuclear protrusion in relation to the direction of new cell front protrusions (n = 17 cells).
Extended Data Fig. 6 |
Extended Data Fig. 6 |. Nuclear function as a mechanical guide.
a, DC expressing lamin(D50)–GFP (lamin(D50) is also known as progerin) migrating through a four-way pore-size decision (4 experiments). b Quantification of pore-size preference in a, divided into GFP+ and GFP regions (4 experiments, 293 cells; unpaired t-test; *P = 0.0118). c Pore-size preference of 3T3 fibroblasts expressing lamin(D50)–GFP (or wild-type lamin–GFP as control) migrating in pillar arrays with differently sized pores (3 experiments, 606 pore passages; two-way ANOVA with Tukey’s test; ****P < 0.0001). d, Low hydrostatic pushing of cells and cellular fragments through four-way pore-size decision (n = 66). e, DC (nucleus labelled, Hoechst, blue) loaded with a 6-μm polystyrene bead (cyan) migrating through a pillar array with 5 μm and 8 μm pores (3 experiments). f, Graph showing where the intracellular bead gets stuck (3 experiments, 29 cells; one-way ANOVA with Tukey’s test; ****P < 0.0001, **P = 0.0016 (8 μm vs between pillar rows), **P = 0.0035 (5 μm vs between pillar rows)). g, Graph showing intracellular location of the bead when it gets stuck (3 experiments, 29 cells; unpaired t-test; **P = 0.0039). h, Frequency of cellular reorientation of DCs with an intracellular bead after getting stuck (3 experiments, 29 cells; unpaired t-test; **P = 0.0011). Data are mean ± s.d.
Extended Data Fig. 7 |
Extended Data Fig. 7 |. Nuclear positioning during amoeboid cell migration.
a, DCs migrating in a 3D collagen matrix along a CCL19 gradient, fixed with paraformaldehyde and stained with phalloidin (green) and DAPI (blue). Two examples are shown; note the nuclear positioning close to the cell front directly behind the F-actin-rich lamellipodium (3 experiments). b, Quantification of the nuclear location in a (62 cells). c, Live-cell imaging of a DC labelled with LifeAct–GFP (green) and Hoechst nuclear stain (blue), showing nuclear positioning close to the cell front directly behind the actin-rich lamellipodium (3 experiments). d Temporal analysis of nuclear positioning during DC migration in a 3D collagen matrix along a CCL19 gradient (yellow line depicts the kymographic axis in e). Note that the cell polarizes at time point 0, after which the nucleus quickly positions close to the cell front (3 experiments). e, Kymographic analysis of d (3 experiments). f, Temporal analysis of nuclear positioning during T cell migration in a 3D collagen matrix along a CCL19 gradient (yellow line depicts the kymographic axis in e) (3 experiments). g, Kymographic analysis of f. Note the nuclear positioning close to the cell front (3 experiments). h, Quantification of nuclear positioning along the cell axis (n = 6 cells; data are mean ± 95% CI). i, Representative of a repolarizing DC (the former front becomes the new back edge) migrating in a 3D collagen matrix along a CCL19 gradient. Note that the nucleus translocates through the entire cell body to position to the new cell front (n = 3 experiments). j, Ex vivo DC (TAMRA, red) migration in mouse skin ear explants (scheme, left) towards lymphatic vessels (LYVE1, green). Two exemplary image sequences (n = 3 experiments). k, Quantification of nuclear positioning along the cell axis in j (n = 10 cells; data are mean ± 95% CI).
Extended Data Fig. 8 |
Extended Data Fig. 8 |. MTOC positioning during DC migration.
a, DCs migrating in a 3D collagen matrix along a CCL19 gradient were fixed with paraformaldehyde and stained with DAPI (blue), phalloidin (green) and for tubulin immunofluorescence (magenta). The arrow highlights the major tubulin signal (n = 3 experiments). b, Image sequence of three exemplary DCs (Hoechst, nucleus, cyan; EB3–mCherry, fire colour-coded intensity) migrating consecutively in a microchannel along a CCL19 gradient. Note that cells 1 and 3 (counting from left to right) initially enter the channel with forward positioning of the MTOC; however, after a short migration distance the nucleus positions in front of the MTOC (nucleus-first configuration) (n = 5 experiments). c, Quantification of b (n = 1,148 events). d, Quantification of the velocity of the cells, depending on the orientation of the nucleus-MTOC axis, tracking the nucleus or the MTOC location as a velocity reference point (n = 830, 323, 787, 262 events, respectively, left to right; Kruskal–Wallis with Dunn’s test). e, Nuclear positioning in DCs along the cell axis, in the presence of 300 nM nocodazole (with DMSO control), 50 μM para-nitroblebbistatin (with DMSO control) or 1 μM Y27632 (with PBS control) in straight microchannels without constrictions (n = 30, 45, 56, 21, 19, 77, 54 cells, respectively, left to right; one-way ANOVA with Tukey’s test; ***P = 0.0002, **P = 0.0051, *P = 0.0269). f, MTOC positioning in DCs along the cell axis in the presence of 300 nM nocodazole (with DMSO control), 50 μM para-nitroblebbistatin (with DMSO control) or 1 μM Y27632 (with PBS control) in straight microchannels without constrictions (n = 53, 21, 29, 12 cells, respectively, left to right; one-way ANOVA with Tukey’s test). g, Nuclear–MTOC polarity in the presence of 50 μM para-nitroblebbistatin (with DMSO control) in straight microchannels without constrictions (e = 2 experiments). h, Quantification of the passing time of DCs migrating through straight channels in the presence of 300 nM nocodazole (DMSO control) (n = 18 (control) or 21 (nocodazole) cells; unpaired t-test). i, Exemplary DCs migrating in a microchannel with a nuclear indentation in close proximity to the MTOC localization (3 experiments). j, Quantification of i (25 cells; unpaired t-test; *P = 0.0012). k, Image sequences of DCs (Hoechst, nucleus, cyan; EB3–mCherry, fire colour-coded intensity) migrating along a CCL19 gradient in a microchannel with a 2 μm-wide individual pore. Top panels depicts an exemplary DC migrating through the 2-μm pore with the nucleus first, the bottom panels depicts an exemplary DC migrating through the 2-μm pore with the MTOC first (3 experiments). l, Quantification of k, and of DC migration through individual pores 3, 4 or 5 μm wide (n = 20, 10, 14, 9, 21, 13, 9, 13 cells, respectively, left to right; Kruskal–Wallis with Dunn’s test). Data are mean ± 95% CI.
Extended Data Fig. 9 |
Extended Data Fig. 9 |. Nucleus-first versus MTOC-first cell polarity during pore-size decisions in DCs and fibroblasts.
a, Quantification of cell-front pore preference as a function of nucleus–MTOC axis orientation (3 experiments, 26 cells; one-way ANOVA with Tukey’s test). b, Quantification of parallel cell fronts as a function of nucleus–MTOC axis orientation (3 experiments, 26 cells; Mann–Whitney test). c, Number of parallel nuclear protrusion in DCs with nucleus first (cyan) or MTOC first (magenta). (3 experiments, 28 cells; two-way ANOVA, **P = 0.0029). d, Constriction passing times of fibroblasts (38 cells; Mann–Whitney test, ***P = 0.0002) during migration through a pillar array with 2 μm and 5 μm pores. e, Pore-size preference of fibroblasts in pillar arrays with pores of increasing size as a function of the nucleus–MTOC polarity (5/2 μm: 2 experiments; 8/5 μm and 10/7 μm: 3 experiments). f, g Image sequence of two exemplary fibroblasts (nucleus (H2B–GFP) in cyan, EB3–mCherry in magenta, cell outlines in yellow) positioning either the MTOC (lower panel) or the nucleus (upper panel) forward, while migrating in a pillar array with 5 μm and 8 μm pores. Arrows indicate the area of highest EB3–mCherry signal (MTOC; fire colour-coded intensity) and the nucleus (cyan) (3 experiments). Data in a, b, c and e are mean ± s.d.; data in d are mean ± 95% CI.
Extended Data Fig. 10 |
Extended Data Fig. 10 |. Myosin inhibition during pore decisions in DCs and nucleus-first versus MTOC-first cell polarity during pore-size decisions in neutrophils.
a, Nuclear lobe dynamics (Hoechst stain) and MTOC localization (SiR–tubulin) during neutrophil pore-size decision (3 experiments). b, Quantification of a, immediately before the decision point (3 experiments; 143 cells; one-way ANOVA with Tukey’s test; ****P < 0.0001, ***P = 0.0005, respectively). c, Quantification of a during pore-size decision (3 experiments; 45 cells; paired t-test; ***P = 0.0003). d, Quantification of cells following the nuclear lobe closest to the MTOC when nuclear lobes translocate in parallel in different pores (3 experiments, 26 cells). e, DC migration in the presence of 50 μM para-nitroblebbistatin through a decision point of four pores of 2, 3, 4 and 5 μm wide (3 experiments). f, DC migration in the presence of 1 μM Y27632 through a decision point of four pores 2, 3, 4 and 5 μm wide (3 experiments). The red star highlights loss of cellular integrity. g Quantification of pore preference in e (3 experiments, 79 cells). h Quantification of passing time in e (3 experiments, 79 cells; Mann–Whitney test; ****P < 0.0001, **P = 0.0020). i, Quantification of the passing time in e, depending on whether cells establish a single or multiple competing leading edges during pore decisions (3 experiments, 79 cells; Mann–Whitney test; ****P < 0.0001, **P = 0.0017). j, Quantification of cellular integrity in e (3 experiments, 79 cells). k, Quantification of pore choice preference in f (3 experiments, 140 cells). l, Quantification of passing time in f (3 experiments, 140 cells; Mann–Whitney test; ****P < 0.0001). m, Quantification of passing time in f, depending on whether cells establish a single or multiple competing leading edges during pore decisions (3 experiments, 140 cells; Mann–Whitney test; ****P < 0.0001, ***P = 0.0008). n, Quantification of cellular integrity in f (3 experiments, 140 cells). o, DC passing times through the same pore sizes as in Fig. 4d, but without pore choice possibility, in the presence of 300 nM nocodazole (3 experiments, 147 cells; Kruskal–Wallis test). p, DC migration in a collagen matrix in the presence of nocodazole (3 experiments). Data in bd, g, j, k and n are mean ± s.d.; data in h, i, l, m and o are mean ± 95% CI.
Fig. 1 |
Fig. 1 |. Migrating cells are selective for pore size.
a, A DC (LifeAct-GFP-labelled) embedded in a 3D collagen matrix (Alexa Fluor 568-labelled) and imaged by light-sheet microscopy with isotropic, subcellular 3D resolution. Colouring on the DC surface indicates regions of large positive and negative curvature in red and blue, respectively. Image representative of 24 cells from five experiments. b, Subvolume of the collagen matrix surrounding the DC depicted in a. Image representative of 24 cells from five experiments. c, Migratory tracks (velocity colour coding) of DCs along a CCL19 chemokine gradient in a collagen matrix spiked with a region of higher collagen density (three experiments). d, Confocal reflection microscopy of the same collagen matrix shown in b (three experiments). Scale bar, 100 μm. e, Enlargement of regions in boxes 1, 2 and 3 in c, exemplifying regions of higher (top) and lower (middle and bottom) collagen densities. Scale bar, 10 μm. f, Protrusion dynamics of the leading edge of a DC, labelled with LifeAct–GFP, during migration in microchannels through a junction (decision point) with four differently sized pores 2, 3, 4 and 5 μm wide (4 μm height). Arrows highlight early establishment of cell-front protrusions into all different pore sizes (3 experiments). g, Quantification of pore-size preference of DCs treated as in f, with (left; seven experiments, 119 cells; one-way ANOVA with Tukey’s test; ****P < 0.0001, **P = 0.0029, *P = 0.0225) or without (right; three experiments, 81 cells; one-way ANOVA with Tukey’s test; **P = 0.0049) CCL19 chemokine gradient. Pooled data from two devices with differently ordered sequences of pore size (2, 3, 4 and 5 μm or 4, 2, 5 and 3 μm, respectively). h, Migration of T cells, LMR7.5 hybridoma T cells and neutrophils in microchannels through a decision point of four differently sized pores of 2, 3, 4 and 5 μm wide (T cells, LMR7.5, 4 μm height; neutrophils, 2 μm height), and quantification of pore-size preference along a chemokine gradient (T cells (CCL19): three experiments, 68 cells; LMR7.5: 3 experiments, 40 cells; neutrophils (fMLP): three experiments, 46 cells; one-way ANOVA with Tukey’s test; ****P < 0.0001, ***P = 0.0007, **P = 0.0043, *P = 0.0193). Pooled data from two devices with differently ordered sequences of pore size (2, 3, 4 and 5 μm or 4, 2, 5 and 3 μm, respectively). Data in g and h are mean ± s.d. Time is indicated as h:min.s.
Fig. 2 |
Fig. 2 |. The nucleus functions as a mechanical guide along the path of least resistance.
a, Correlation of initial nuclear translocation and final pore decision (three experiments, 61 cells; unpaired t-test, **P = 0.0068). b, Nuclear protrusion dynamics (Hoechst stain) during DC pore-size decision (cell outline in yellow, time indicated; representative of five experiments). c, Nuclear lobe dynamics (Hoechst stain) during neutrophil pore-size decision (cell outlines in yellow, time indicated; representative of three experiments). d, Quantification of parallel nuclear lobes into different pores during neutrophil pore-size decision (three experiments, 46 cells; unpaired t-test, **P = 0.0027). e, Pore-size selection by parallel nuclear lobes (four experiments, 71 cells; unpaired t-test, ****P < 0.0001). f, Spatial decoupling of the decision point (the channel split) from the site where the leading edge senses pore size (channel constriction) by locating the differently sized constrictions 10 μm upstream of the decision point (cell outlines in yellow, nucleus (Hoechst stain) in cyan, time indicated; representative of three experiments). g, Quantification of cell ‘decisions’ from f; pooled data from two devices with differently ordered sequences of pore size (2, 3, 4 and 5 μm or 4, 2, 5 and 3 μm, respectively; three experiments, 120 cells; one-way ANOVA with Tukey’s test). h, Pore-size preference of DCs in pillar arrays with pores of increasing size (three experiments, 62 cells, 1,148 pore passages; paired t-test; **P = 0.0073, *P = 0.0289). i, Nucleus-free cell fragment (cytoplast; outlines in yellow) migrating in a pillar array of large (orange) and small (green) pores (representative of three experiments). j, Quantification of pore passages in i (three experiments, 19 nucleus-free cytoplasts, 224 pore passages; paired t-test; **P = 0.0023 (4 μm vs 2 μηm, intact cells), **P = 0.0034 (6 μm vs 4 μm, intact cells), *P = 0.0267 (6 μm vs 4 μm, nucleus-free cytoplast)).
Fig. 3 |
Fig. 3 |. Nucleus-first cell polarity facilitates migration along the path of least resistance.
a, Position of MTOC (indicated by EMTB–mCherry, with fire colour-coded intensity: black (minimum), magenta, orange, yellow to white (maximum)) and nucleus (Hoechst stain; cyan) in a DC migrating in a collagen matrix along a CCL19 gradient (time indicated; representative of three experiments). b, Quantification of relative position of nucleus and MTOC in DCs before and during pore-size decisions (three experiments, 76 cells; one-way ANOVA with Tukey’s test; ****P < 0.0001, ***P = 0.0007, **P = 0.0049). c, Examples of DCs migrating through the decision point with the nucleus (top) or the MTOC (bottom) first (time indicated; representative of three experiments). d, Pore-size preference of DCs approaching a pore-size decision with nucleus or MTOC first (3 experiments, 76 cells). e, Time taken for cell to pass through a pore (passing time), based on whether the cell passes through in nucleus-first or MTOC-first configuration (three experiments, 32 cells; unpaired t-test; *P = 0.0389). f, Pore-size preference of DCs (nucleus-first versus MTOC-first configuration) migrating through pillar arrays with different pore sizes (three experiments, 31 cells, 252 pore passages; paired t-test; **P = 0.0042). g, Pore-size preference of fibroblasts (nucleus-first versus MTOC-first configuration) migrating through pillar arrays with different pore sizes (125 cells, 146 pore passages; one-way ANOVA with Tukey’s test; ***P = 0.0017, **P = 0.0088, *P = 0.0307). Data in b, d, f and g are mean ± s.d.; data in e are mean ± 95% confidence interval (CI).
Fig. 4 |
Fig. 4 |. The microtubule cytoskeleton coordinates nuclear probing with cellular locomotion.
a, Retraction of cellular protrusions (from non-chosen pores) on passage of the MTOC into the chosen pore (three experiments, 34 cells). b, Path choice of DCs in Y-junction channels on translocation of the nucleus or the MTOC into one of the Y branches (two experiments, 46 cells). c, Microtubule plus ends, labelled with EB3–mCherry (fire colour-coded intensity), and nucleus (Hoechst stain, cyan) in a DC migrating through a Y-junction channel (time indicated; representative of three experiments). Images depict maximal intensity projections of 15 frames (5 s intervals). d, DCs (outlined in yellow) migrating through a decision point with pores 2, 3, 4 and 5 μm wide in the presence of 300 nM nocodazole (representative of two experiments). The red star highlights loss of cellular integrity. e, Quantification of the passing time in the experiments represented in d (two experiments, 63 cells; Mann–Whitney test; ****P < 0.0001). f, Quantification of the cellular integrity in the experiments represented in d (two experiments, 61 cells). Data in c and f are mean ± s.d.; data in a and e are mean ± 95% CI.

References

    1. Petrie RJ & Yamada KM Multiple mechanisms of 3D migration: the origins of plasticity. Curr. Opin. Cell Biol 42,7–12 (2016). - PMC - PubMed
    1. Friedl P & Weigelin B Interstitial leukocyte migration and immune function. Nat Immunol. 9,960–969 (2008). - PubMed
    1. te Boekhorst V, Preziosi L & Friedl P Plasticity of cell migration in vivo and in silico. Annu. Rev. Cell Dev. Biol, 32,491–526 (2016). - PubMed
    1. Weigelin B, Bakker G-J & Friedl P Intravital third harmonic generation microscopy of collective melanoma cell invasion: Principles of interface guidance and microvesicle dynamics. Intravital 1,32–43 (2012). - PMC - PubMed
    1. Stoitzner P, Pfaller K, Stössel H& Romani N A close-up view of migrating Langerhans cells in the skin. J. Invest. Dermatol 118,117–125 (2002). - PubMed