. 2019 Apr;568(7752):405-409.
doi: 10.1038/s41586-019-1082-x. Epub 2019 Apr 3.

Innate lymphoid cells support regulatory T cells in the intestine through interleukin-2

Affiliations

Innate lymphoid cells support regulatory T cells in the intestine through interleukin-2

Lei Zhou et al. Nature. 2019 Apr.

Abstract

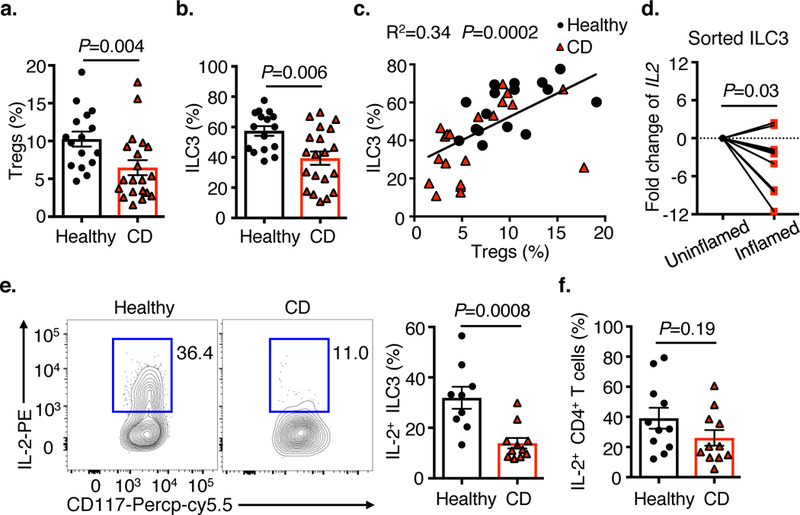
Interleukin (IL)-2 is a pleiotropic cytokine that is necessary to prevent chronic inflammation in the gastrointestinal tract1-4. The protective effects of IL-2 involve the generation, maintenance and function of regulatory T (Treg) cells4-8, and the use of low doses of IL-2 has emerged as a potential therapeutic strategy for patients with inflammatory bowel disease9. However, the cellular and molecular pathways that control the production of IL-2 in the context of intestinal health are undefined. Here we show, in a mouse model, that IL-2 is acutely required to maintain Treg cells and immunological homeostasis throughout the gastrointestinal tract. Notably, lineage-specific deletion of IL-2 in T cells did not reduce Treg cells in the small intestine. Unbiased analyses revealed that, in the small intestine, group-3 innate lymphoid cells (ILC3s) are the dominant cellular source of IL-2, which is induced selectively by IL-1β. Macrophages in the small intestine produce IL-1β, and activation of this pathway involves MYD88- and NOD2-dependent sensing of the microbiota. Our loss-of-function studies show that ILC3-derived IL-2 is essential for maintaining Treg cells, immunological homeostasis and oral tolerance to dietary antigens in the small intestine. Furthermore, production of IL-2 by ILC3s was significantly reduced in the small intestine of patients with Crohn's disease, and this correlated with lower frequencies of Treg cells. Our results reveal a previously unappreciated pathway in which a microbiota- and IL-1β-dependent axis promotes the production of IL-2 by ILC3s to orchestrate immune regulation in the intestine.


Conflict of interest statement

The authors declare no competing interests.

Figures

Extended Data Figure 1.
Extended Data Figure 1.. IL-2 blockade results in disrupted T cell homeostasis throughout the intestinal tract and associated lymphoid tissues.
a-c, Sex- and age- matched C57BL/6 mice were treated with anti-IL-2 monoclonal antibodies every other day for two weeks and examined for the spleen and mesenteric lymph nodes (mLN) size (a), the frequency of Tregs (b) and Ki-67+CD4+ T cells (c) of mLN by flow cytometry (n=10). d-g. Mice from a-c were also analyzed for the frequencies of Tregs (d) and Ki-67+CD4+ T cells (e) in large intestine lamina propria cells (LI-LPs) and the frequencies and numbers of Tregs (f) and Ki-67+CD4+ T cells (g) in small intestine lamina propria cells (SI-LPs) by flow cytometry (n=10). h-k. Mice from a-c were analyzed for the frequency of Th1 cells (h) and Th17 cells (i) in LI-LPs and the frequencies and numbers of Th1 cells (j) and Th17 cells (k) in SI-LPs by flow cytometry (n=10). Data in a are representative of two independent experiments with similar results. Data in b-k are pooled from two independent experiments. Results are shown as the means ± s.e.m. All statistics are calculated by unpaired two-tailed Student’s t-test. P values are indicated on the figure.
Extended Data Figure 2.
Extended Data Figure 2.. T cell-derived IL-2 is essential for maintaining immunologic homeostasis in the mesenteric lymph node and large intestine.
a. Sex- and age- matched Il2f/f and Lckcre-Il2f/f mice were examined for the deletion efficiency of IL-2 in CD4+ T cells in the large and small intestines. b. Mice in a were examined for the frequency of Tregs (b) and Ki-67+ CD4+ T cells (c) from the mLN by flow cytometry (n=6). d-g. Mice in a were analyzed for the frequencies and numbers of Tregs (d), Ki-67+ CD4+ T cells (e), Th1 cells (f) and Th17 cells (g) of LI-LPs by flow cytometry (n=6). h-k. Mice in a were analyzed for the frequencies and numbers of Tregs (h), Ki-67+ CD4+ T cells (i), Th1 cells (j) and Th17 cells (k) of SI-LPs by flow cytometry (n=6). Data in a is representative of two independent experiments with similar results. Data in b-k are pooled from two independent experiments. Results are shown as the means ± s.e.m. All statistics are calculated by unpaired two-tailed Student’s t-test. P values are indicated on the figure.
Extended Data Figure 3.
Extended Data Figure 3.. Gating strategy to analyze innate lymphoid cells subsets and CD4+ T cells in the small intestine.
Gating strategy for flow cytometry analysis of innate lymphoid cells and CD4+ T cells in SI-LPs. Lineage 1: CD11b, CD11c and B220; lineage 2: CD3ε, CD5 and CD8α. CD4+ T cells were identified as CD45+Lineage 2+ CD4+, ILC1 were identified as CD45+Lineage-CD127+CD90.2+T-bet+RORγt-, ILC2 were identified as CD45+Lineage-CD127+CD90.2+GATA3+, ILC3 were identified as CD45+Lineage-CD127+CD90.2+RORγt+, ILC3 subsets were further identified as CCR6+T-bet- ILC3 or CCR6-T-bet+ ILC3.
Extended Data Figure 4.
Extended Data Figure 4.. IL-2+ cells in the large intestine of WT mice and in the small and large intestines of Rag1−/− mice.
a. Flow cytometry plots with graph of frequency and numbers of IL-2 in ILC3 and Effector/memory (E/M) CD4+ T cells (CD3+CD4+Foxp3-CD44hiCD62Llo) in SI-LPs of WT mice (n=8). b. Flow cytometry plots show IL-2+ cells in LI-LPs of C57BL/6 mice. Lineage 1: CD11b, CD11c and B220; lineage 2: CD3ε, CD5 and CD8α. c, d. Flow cytometry plots with graph of frequency (c) and absolute numbers (d) of IL-2+ cells in LI-LPs of C57BL/6 mice (n=6). e. The frequency and number of IL-2+ ILC3 subsets in SI-LPs of C57BL/6 mice (n=8). f. Flow cytometry plots show IL-2+ cells in SI-LPs of Rag1−/− mice. g, h. Flow cytometry plots with graph of frequency (g) and absolute numbers (h) of IL-2+ cells in SI-LPs of Rag1−/− mice (n=5). i, j. Flow cytometry plots with graph of frequency (i) and absolute numbers (j) of IL-2+ ILC3 subsets in SI-LPs of Rag1−/− mice (n=5). k. Flow cytometry plots show IL-2+ cells in LI-LPs of Rag1−/− mice. Lineage 1: CD11b, CD11c and B220; lineage 2: CD3ε, CD5 and CD8α. Data in b and f-k are representative of two independent experiments with similar results. Data in a and c-e are pooled from two independent experiments. Results are shown as the means ± s.e.m. Statistics are calculated by paired or unpaired two-tailed Student’s t-test. P values are indicated on the figure.
Extended Data Figure 5.
Extended Data Figure 5.. NK cells and ILC1 are dispensable for maintenance of Tregs in small intestine.
a. IL-2 was assessed in T-bet+ ILC3, total ILC3, CD4+ T cells, NK cells, ILC1 and DCs in SI-LPs of Il2f/f and Ncr1cre-Il2f/f mice. b. The number of IL-2+ cells were quantified in SI-LPs of Il2f/f and Ncr1cre-Il2f/f mice (n=4). c, d. Sex- and age- matched C57BL/6 mice were treated with anti-NK1.1 monoclonal antibody every 3 days for two weeks and examined for NK cell depletion efficiency (c) and the frequency and number of Tregs in SI-LPs (d) (n=7). Data in a-c are representative of two independent experiments with similar results. Data in d is pooled from two independent experiments. Results are shown as the means ± s.e.m. Statistics are calculated by unpaired two-tailed Student’s t-test. P values are indicated on the figure.
Extended Data Figure 6.
Extended Data Figure 6.. ILC3-derived IL-2 is dispensable for the maintenance of small intestinal Th17 cells, ILC3 homeostasis and large intestinal Tregs.
a-d. Il2f/f and Ncr1cre-Il2f/f mice were analyzed for the percentage of Tregs (a), Th1 cells (b), Ki-67+ CD4+ T cells (c) and the frequency and cell number of Th17 cells (d) in SI-LPs at steady state by flow cytometry (n=8). e. Il2f/f and Ncr1cre-Il2f/f mice were examined for the frequency and number of Tregs in LI-LPs by flow cytometry (n=8). f. Il2f/f and Ncr1cre-Il2f/f mice were examined for the frequency and number of ILC3 in SI-LPs by flow cytometry (n=8). g. IL-22 was assessed in ILC3 from SI-LPs of Il2f/f or Ncr1cre-Il2f/f mice. h. Representative histograms and bar graph examination of CD25 staining on Tregs and IL-2+ ILC3. i. Representative histograms demonstrating IL-2 binding capacity and quantification of bound IL-2 MFI in Tregs and ILC3. j. Experimental design of the DTH model. Data in f-h are representative of two independent experiments with similar results (at least 3 mice per group). Data in a-e and i are pooled from two independent experiments. Results are shown as the means ± s.e.m. Statistics are calculated by paired or unpaired two-tailed Student’s t-test. P values are indicated on the figure.
Extended Data Figure 7.
Extended Data Figure 7.. Deletion of ILC3-intrinsic IL-2 affects the population size of peripherally-induced Tregs, but not their suppressive capacity.
a, b. The frequency of peripheral Tregs (Nrp-1lo pTregs) and Thymic Tregs (Nrp-1hi tTregs) were characterized in SI-LPs of Il1rf/f and Ncr1cre-Il1rf/f mice (a) or Il2f/f and Ncr1cre-Il2f/f mice (b) (n=5). c, d. The frequency of Treg subsets were analyzed in SI-LPs of Il2f/f and Ncr1cre-Il2f/f mice (n=5). e. Small intestinal Tregs were examined for expression of Lag3, Tgfb1, Ctla4, Ebi3 and Il10 in Il2f/f and Ncr1cre-Il2f/f mice (n=7). f, g. Sort-purified small intestinal CD45+CD3+CD4+CD25+ regulatory T cells were co-cultured with sort-purified CFSE-labeled splenic effector T cells (CD3+CD4+CD25-CD45RBhi) in the presence of purified splenic DCs and soluble anti-CD3 for 3 days. CFSE dilution was analyzed and quantified (n=6). Data in a-d and f are representative of two independent experiments with similar results. Data in e and g are pooled from two independent experiments. Results are shown as the means ± s.e.m. Statistics are calculated by unpaired two-tailed Student’s t-test. P values are indicated on the figure.
Extended Data Figure 8.
Extended Data Figure 8.. ILC3-derived IL-2 does not exhibit functional redundancy or hierarchies with ILC3-specific GM-CSF or MHCII.
a. Flow cytometry plots with graph of frequency and quantification of cell numbers of IL-2+ ILC3 in SI-LPs of WT and Csf2−/− mice (n=8). b, c. Flow cytometry plots with graph of frequency and quantification of cell numbers of Tregs (b) and IL-2+ ILC3 (c) in SI-LPs of H2-Ab1f/f and MHCIIΔILC3 mice (n=7). d, e. Flow cytometry plots with graph of frequency and quantification of cell numbers of MHCII+ ILC3 (d) and GM-CSF+ ILC3 (e) in SI-LPs of Il2f/f and Ncr1cre-Il2f/f mice (n=7). Data are pooled from two independent experiments. Results are shown as the means ± s.e.m. Statistics are calculated by unpaired two-tailed Student’s t-test. P values are indicated on the figure.
Extended Data Figure 9.
Extended Data Figure 9.. ILC3-derived IL-2 promotes essential immune regulation in the intestine.
a-h. CD4+ T cells were adoptively transferred into Il2f/f-Rag1−/− or Rorccre-Il2f/f-Rag1−/− recipient mice. Recipients were examined for changes in weight (a), colon length (b), histological H&E staining in the terminal colon (c) and Lipocalin-2 presence in fecal samples (d) (n=8). e. Flow cytometry plots with graph of percentage and absolute cell number of Tregs in LI-LPs in defined recipients. f. Absolute cell number of Tregs in SI-LPs in defined recipients. g. Flow cytometry plots and graph of frequency and absolute number of IFNγ-IL-17A+ and IFNγ+IL-17A+ cells in LI-LPs in defined recipients. h. Cell number of Th1 and Th17 cells in SI-LPs in defined recipients. N=7 of Il2f/f-Rag1−/− group and n=8 of Rorccre-Il2f/f-Rag1−/− group are the details of mice in e-h. Data in a-h are pooled from two independent experiments. Results are shown as the means ± s.e.m. Statistics are calculated by unpaired two-tailed Student’s t-test. P values are indicated on the figure.
Extended Data Figure 10.
Extended Data Figure 10.. A novel IL-1β-ILC3-IL-2 circuit is essential for the maintenance of Tregs and immunologic homeostasis uniquely within the small intestine.
In this manuscript we define a novel pathway of immune regulation in the small intestine. This pathway is continuously required and involves MyD88- and Nod2-dependent microbial sensing by macrophages, production of IL-1β and induction of ILC3-derived IL-2 to support the maintenance of peripherally-induced intestinal Tregs. Consequently, this is essential to maintain immunologic homeostasis and oral tolerance, and becomes dysregulated in human IBD.
Figure 1.
Figure 1.. IL-2 is dominantly produced by ILC3 in the small intestine.
a. Flow cytometry plots show IL-2 staining in cells from the SI-LPs of C57BL/6 mice. Lineage 1: CD11b, CD11c and B220; lineage 2: CD3ε, CD5 and CD8α. b. Heatmap showing expression Z-scores of the indicated genes in CD4+ T cells (CD45+CD3+CD4+) and ILC3 (CD45+CD3-RORγtGFP+CD127+) from SI-LPs of Rorc(γt)-GfpTG mice, as measured by RNA-seq. c. Transcription of Il2 in the sort-purified CD4+ T cells, ILC3, DCs (CD45+CD11chiMHCII+CD64-) and B cells (CD45+CD19+) from SI-LPs of Rorc(γt)-GfpTG mice, as determined by qPCR analysis (n=6). Il2 expression was normalized to Hprt1, then further normalized to the CD4+ T cells within each mouse. n.d., not detectable. d-f. Flow cytometry plots (d), graph of frequency (e) and quantification of cell number (f) of IL-2+ cells in SI-LPs of C57BL/6 mice (n=8). g. Flow cytometry plots show IL-2 staining in SI-LPs from noted mice. Bar graph shows percentages in each group of mice (n=4). Data in c, e and f are pooled from two independent experiments. Data in a or g are representative of four or two independent experiments with similar results, respectively, at least 3 mice per group. Results are shown as the means ± s.e.m. Statistics are calculated by paired or unpaired two-tailed Student’s t-test. P values are indicated on the figure.
Figure 2.
Figure 2.. Sensing of the microbiota and production of IL-1β induces ILC3-derived IL-2.
a. Flow cytometry plots with graph of frequency of IL-2+ ILC3 in SI-LPs of conventional (SPF), antibiotics treated (ABX) and germ free (GF) mice (n=4). b. qPCR examination of Il2 transcript in sort-purified ILC3 in the presence of various stimulus (n=6). Il2 expression was normalized to Hprt1, then further normalized to the medium control within each mouse. c. Flow cytometry plots with graph of frequency of IL-2+ ILC3 from the SI-LPs of SPF mice following ex vivo culture (n=4). d. SI-LPs from SPF mice were cultured ex vivo for 4h with or without IL-1α and examined for IL-2+ ILC3 by flow cytometry (n=7). e, f. SI-LPs from ABX (e) or GF (f) mice were cultured ex vivo with or without IL-1β and examined for IL-2 in ILC3 by flow cytometry (n=4). g. qPCR analysis of Il1b transcript in sort-purified macrophages (CD45+CD11b+CD64+F4/80+), conventional DC1 (cDC1) (CD45+CD11c+MHCII+CD64-XCR1+CD172a-) and cDC2 (CD45+CD11c+MHCII+CD64-XCR1-CD172a+) in SI-LPs (n=6). Il1b expression was normalized to Gapdh. h, i. qPCR analysis of Il1b transcript in sort-purified small intestinal macrophages (h) or flow cytometry analysis of ILC3-derived IL-2 expression (i) in SPF, GF and SFB mono-colonized mice (n=6). j. qPCR analysis of Il1b transcript in sort-purified small intestinal macrophages in wild-type (WT), Myd88−/− and Nod2−/− mice (n=3). k. Flow cytometry analysis of small intestinal IL-2+ ILC3 in WT, Nod2−/− mice and Nod2−/− mice following ex vivo culture (n=8). Data in a, c, e, f and j are representative of two or three independent experiments with similar results (at least 3 mice per group). Data in b, d, g-i and k are pooled from two independent experiments. Results are shown as the means ± s.e.m. Statistics are calculated by paired or unpaired two-tailed Student’s t-test. P values are indicated on the figure.
Figure 3.
Figure 3.. ILC3-derived IL-2 is essential for Tregs maintenance, immunological homeostasis and oral tolerance to dietary antigen in the small intestine.
a, b. Flow cytometry plots with graph of the frequencies of IL-2+ ILC3 (a) or Tregs (b) in SI-LPs of Il1rf/f and Ncr1cre-Il1rf/f mice (n=8). c, d. Flow cytometry plots and quantification of cell numbers of Tregs (c) and Th1 cells (d) in SI-LPs of Il2f/f and Ncr1cre-Il2f/f mice at steady state (n=8). e. Naïve OT-II CD4+ T cells were transferred into Il2f/f and Ncr1cre-Il2f/f mice and recipient mice were fed with OVA for 12 days. Donor T cells were analyzed for Foxp3 staining in the SI-LPs (n=5). f, g. DTH response was assessed in designated mice by ear swelling (f) and serum concentration of anti-OVA IgG1 was tested by ELISA (g) (n=5 of non-tolerized group and n=8 of tolerized group). Data in a-d, f and g are pooled from two independent experiments. Data in e is representative of two independent experiments with similar results (at least 4 mice per group). Results are shown as the means ± s.e.m. Statistics are calculated by unpaired two-tailed Student’s t-test (a-e) or two-way ANOVA (f, g). P values are indicated on the figure.
Figure 4.
Figure 4.. ILC3 production of IL-2 is impaired in the intestine of Crohn’s disease patients.
a-f. Lamina propria cells were isolated from terminal ileum biopsies from healthy or Crohn’s disease (CD) patients, and the frequency of Tregs (CD45+CD3+CD4+Foxp3+ of CD4+ T cells) (a) and ILC3 (CD45+Lin-CD127+CD117+NKp44+ of total ILCs) (b) were quantified. The frequency of ILC3 was correlated with the frequency of Tregs in (c) (n=16 healthy and n=20 CD patients). d. Human ILC3 were sort-purified from resected tissues of CD patients and IL2 transcript was examined by qPCR. e, f. The frequency of IL-2+ ILC3 (e) or IL-2+ CD4+ T cells (f) were analyzed in healthy controls (n=11) and CD patients (n=11) by flow cytometry. Data in a-c, e and f, statistical analyses performed using a Mann-Whitney test (unpaired). Correlative analyses were compared by parametric Pearson’s rank correlation coefficient (r). Data in d is performed using Wilcoxon matched-pairs test (paired). Results are shown as the means ± s.e.m. Statistics are calculated by two-tailed test. P values are indicated on the figure.

Comment in

References

    1. Boyman O & Sprent J The role of interleukin-2 during homeostasis and activation of the immune system. Nature reviews. Immunology 12, 180–190, 10.1038/nri3156 (2012). - DOI - PubMed
    1. Malek TR The biology of interleukin-2. Annual review of immunology 26, 453–479, 10.1146/annurev.immunol.26.021607.090357 (2008). - DOI - PubMed
    1. Sadlack B et al. Ulcerative colitis-like disease in mice with a disrupted interleukin-2 gene. Cell 75, 253–261 (1993). - PubMed
    1. Josefowicz SZ, Lu LF & Rudensky AY Regulatory T cells: mechanisms of differentiation and function. Annu Rev Immunol 30, 531–564, 10.1146/annurev.immunol.25.022106.141623 (2012). - DOI - PMC - PubMed
    1. Belkaid Y & Tarbell K Regulatory T cells in the control of host-microorganism interactions (*). Annual review of immunology 27, 551–589, 10.1146/annurev.immunol.021908.132723 (2009). - DOI - PubMed

MeSH terms

LinkOut - more resources