. 2019 Apr;568(7751):193-197.
doi: 10.1038/s41586-019-1064-z. Epub 2019 Apr 3.

Genetic compensation triggered by mutant mRNA degradation

Affiliations

Genetic compensation triggered by mutant mRNA degradation

Mohamed A El-Brolosy et al. Nature. 2019 Apr.

Abstract

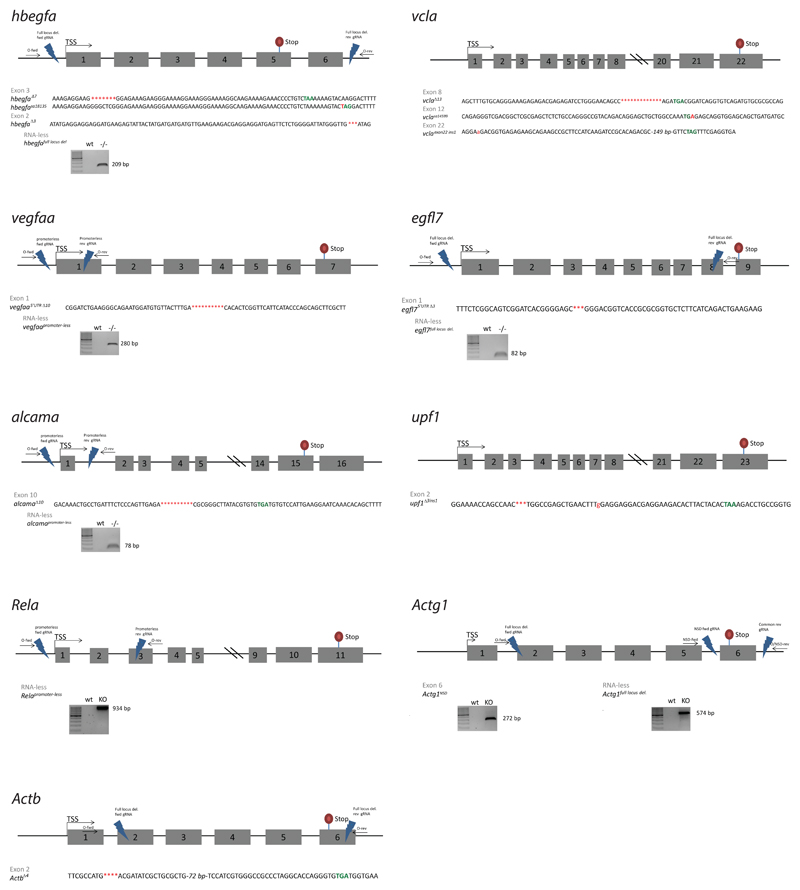
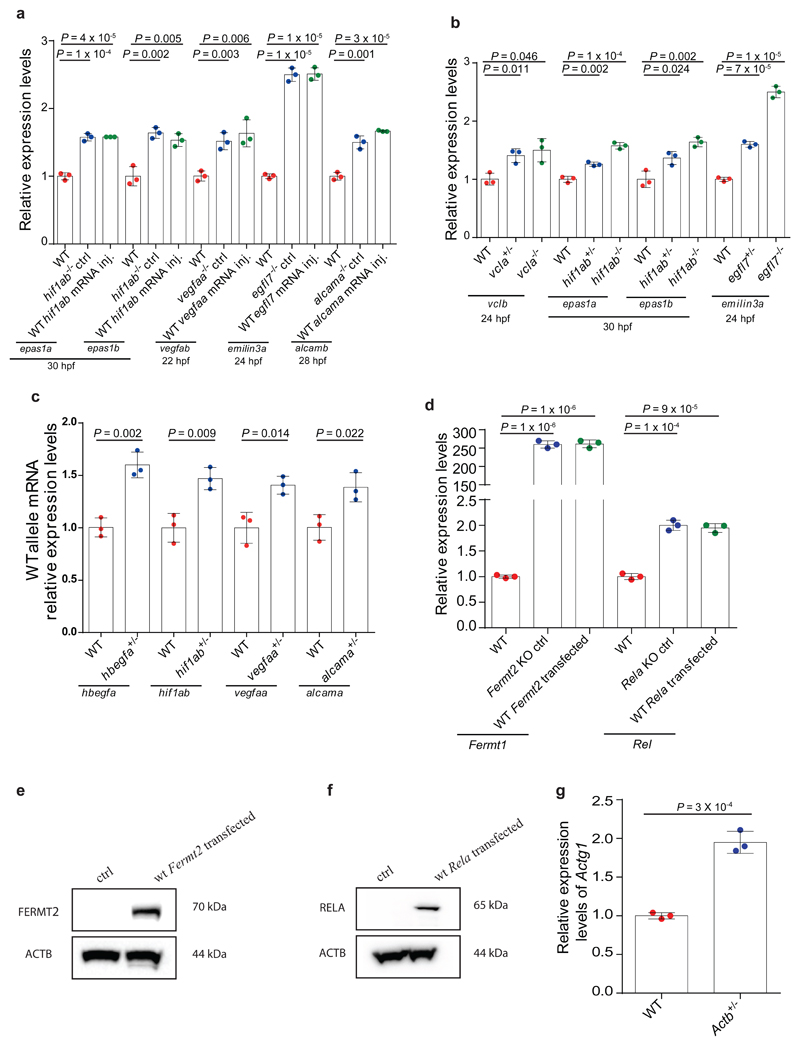
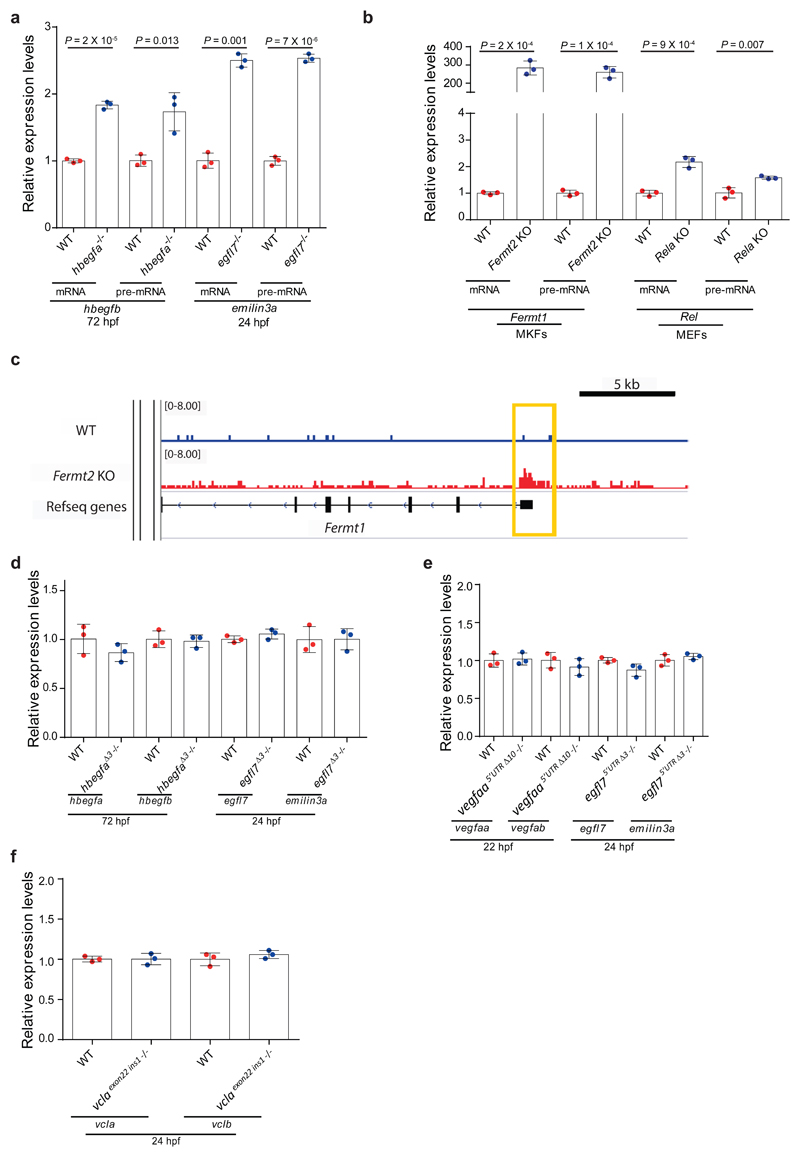
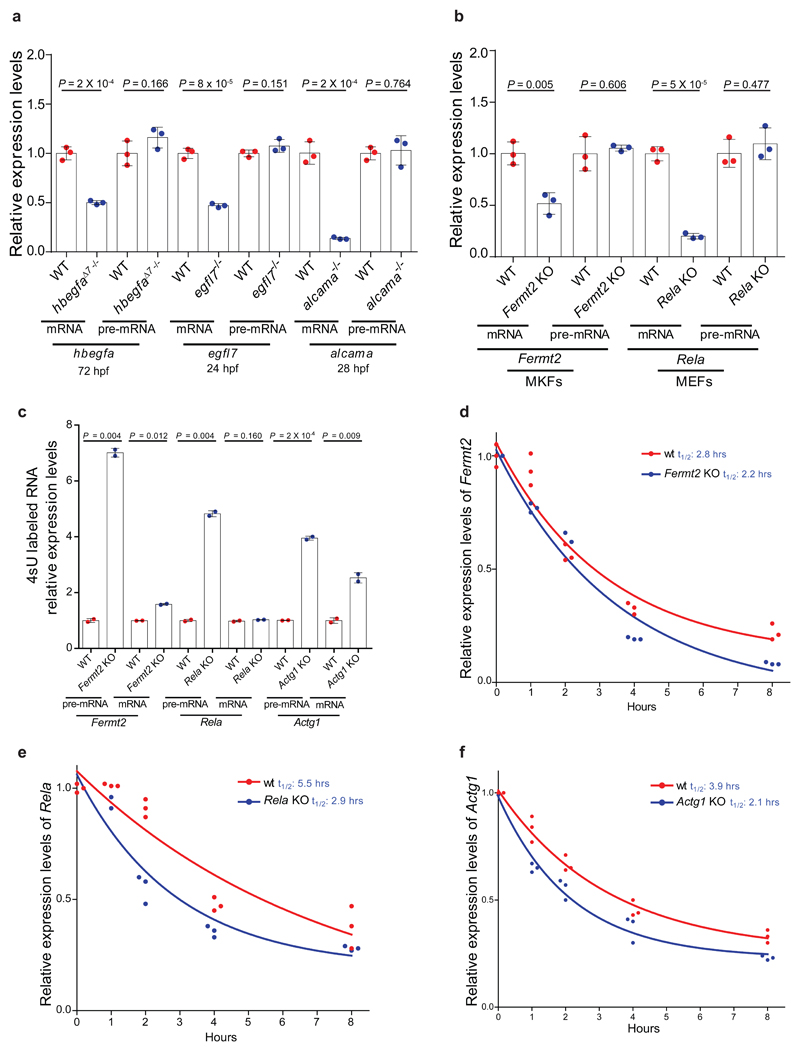
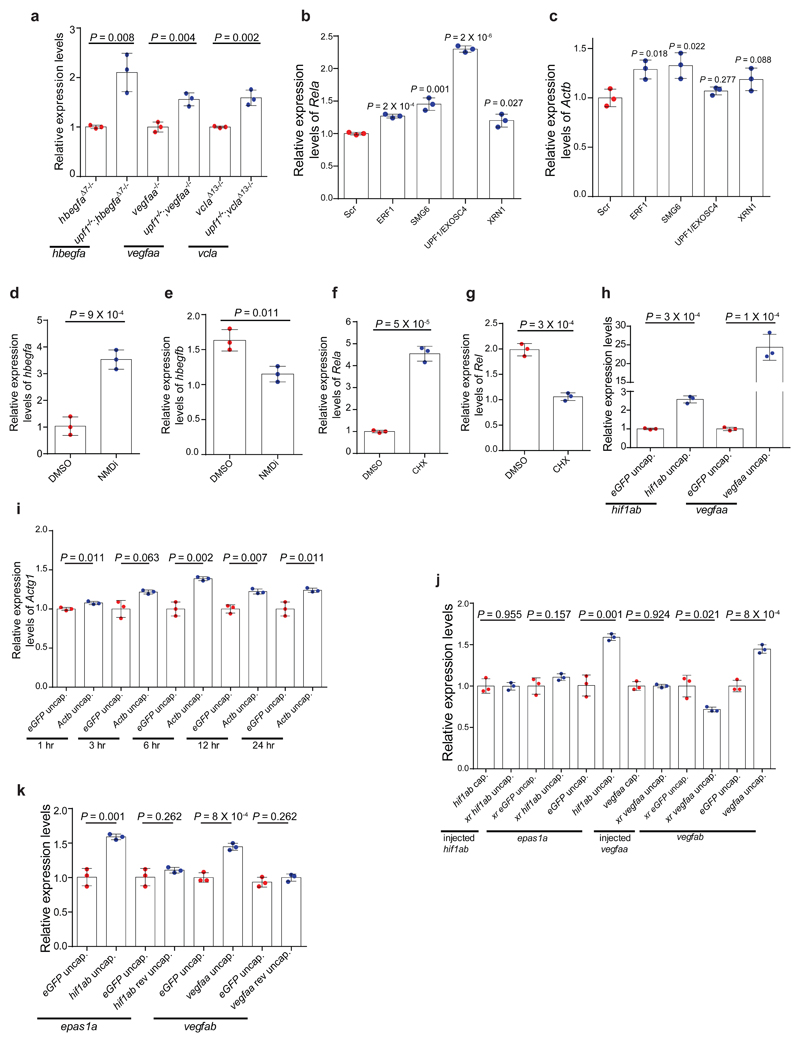
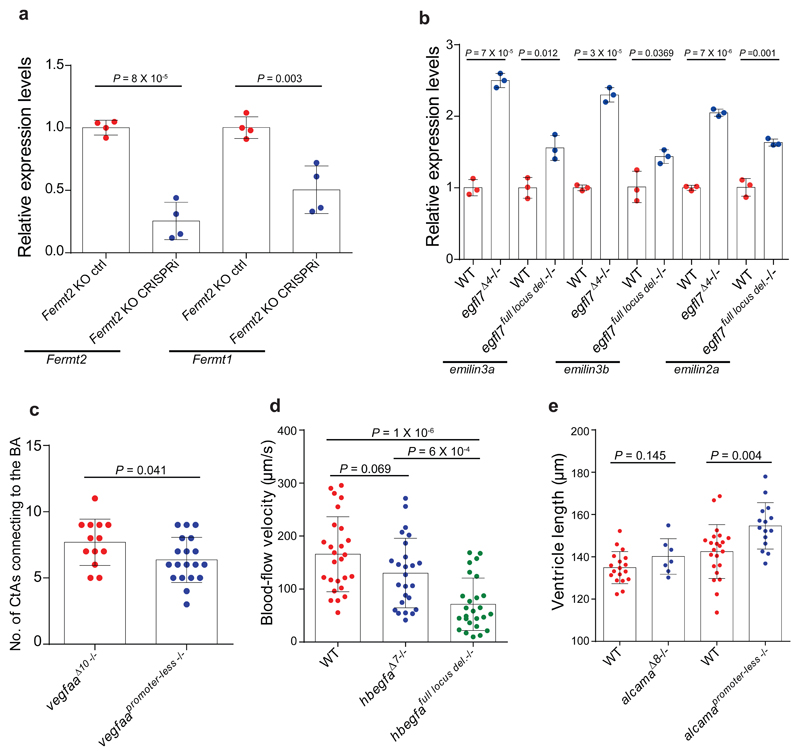
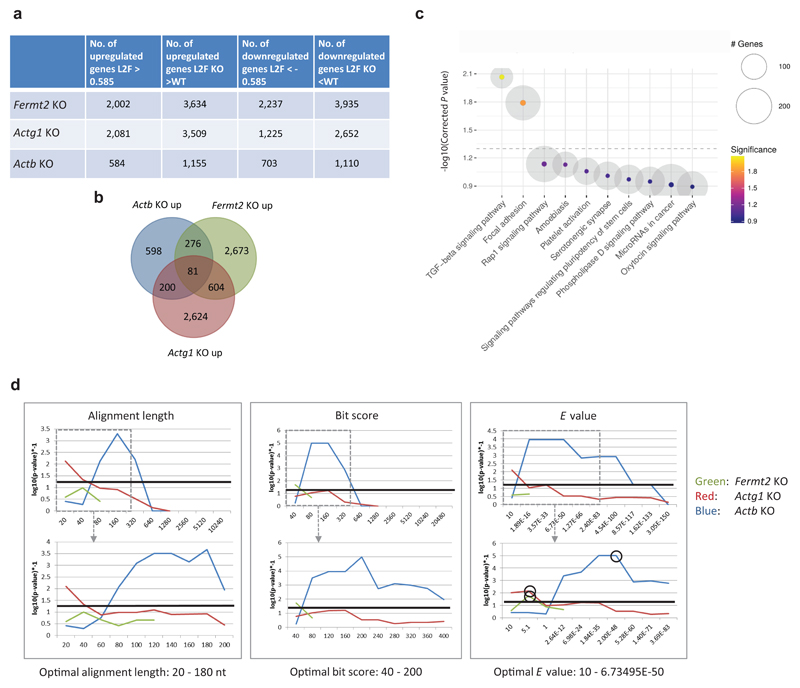
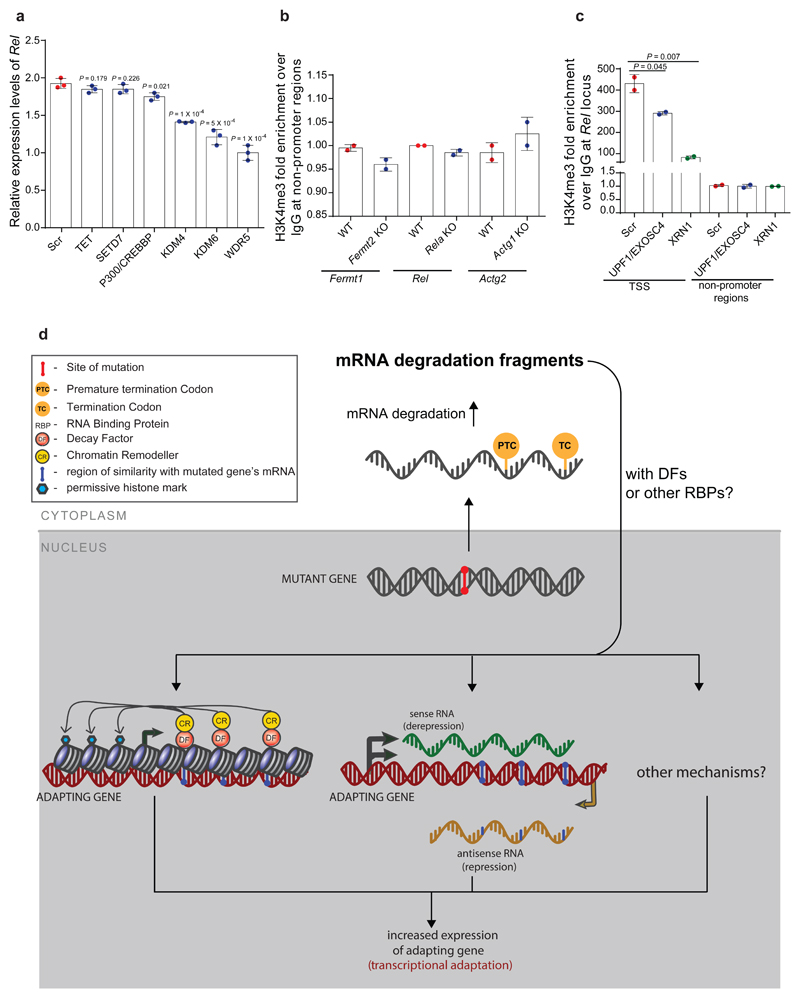
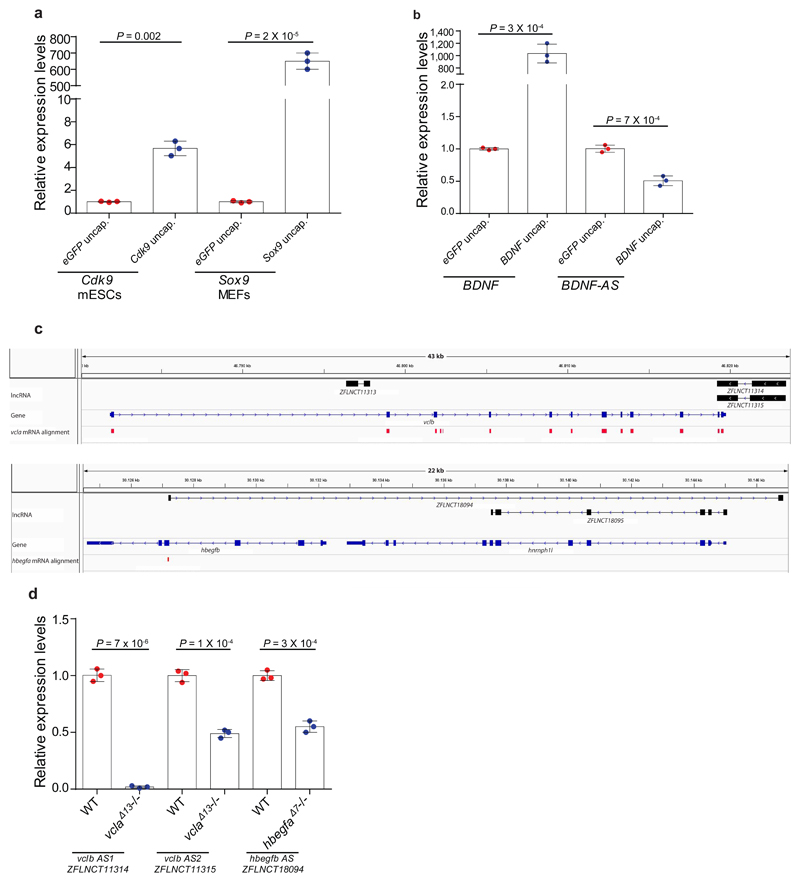
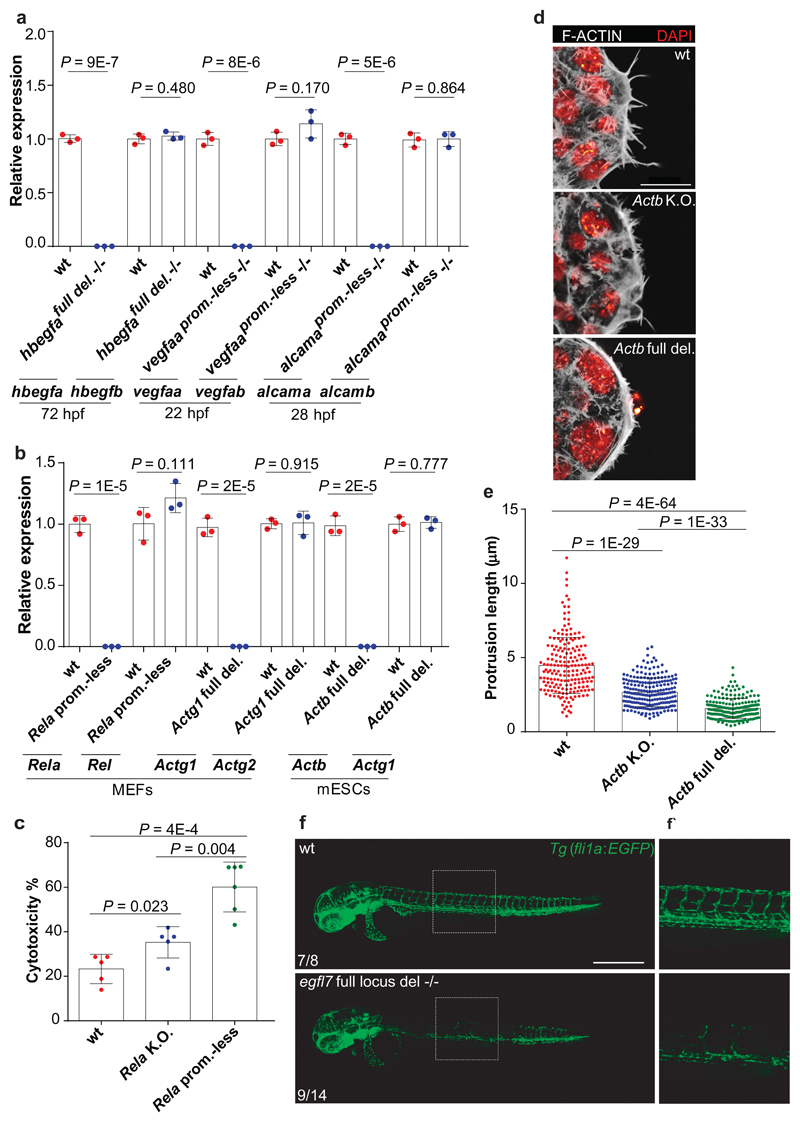
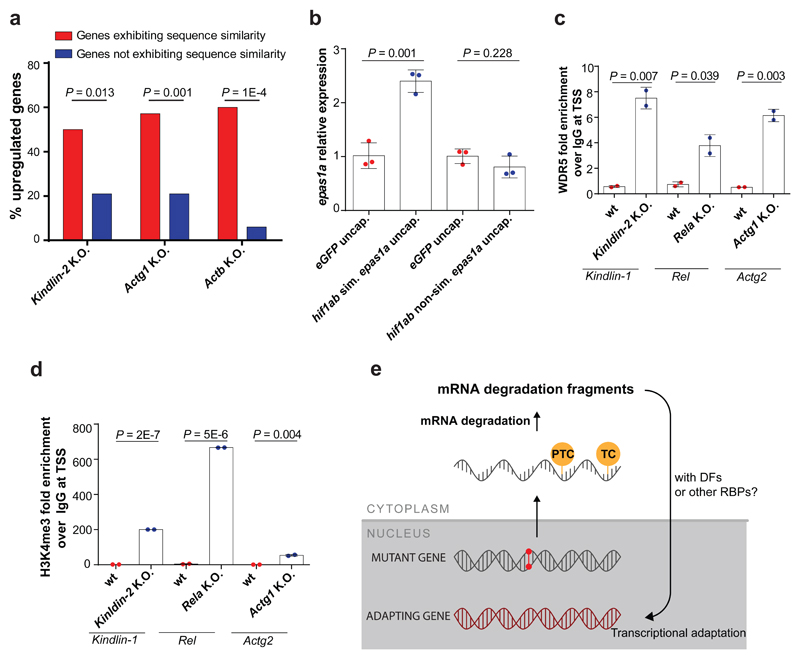
Genetic robustness, or the ability of an organism to maintain fitness in the presence of harmful mutations, can be achieved via protein feedback loops. Previous work has suggested that organisms may also respond to mutations by transcriptional adaptation, a process by which related gene(s) are upregulated independently of protein feedback loops. However, the prevalence of transcriptional adaptation and its underlying molecular mechanisms are unknown. Here, by analysing several models of transcriptional adaptation in zebrafish and mouse, we uncover a requirement for mutant mRNA degradation. Alleles that fail to transcribe the mutated gene do not exhibit transcriptional adaptation, and these alleles give rise to more severe phenotypes than alleles displaying mutant mRNA decay. Transcriptome analysis in alleles displaying mutant mRNA decay reveals the upregulation of a substantial proportion of the genes that exhibit sequence similarity with the mutated gene's mRNA, suggesting a sequence-dependent mechanism. These findings have implications for our understanding of disease-causing mutations, and will help in the design of mutant alleles with minimal transcriptional adaptation-derived compensation.


Conflict of interest statement

The authors declare no competing interests.

Figures

Extended Data Figure 1
Extended Data Figure 1. Schematic illustration of the mutant alleles generated for this study.
Partial DNA sequences of the different mutant alleles generated for this study, and images of gels providing evidence for deletions in RNA-less alleles. Red: mutation; green: stop codon in alleles with a PTC; arrows: genotyping primers.
Extended Data Figure 2
Extended Data Figure 2. Transcriptional adaptation is independent of the loss of protein function.
a, qPCR analysis of epas1a and epas1b, vegfab, emilin3a and alcamb mRNA levels in wt and hif1ab, vegfaa, egfl7 and alcama mutant embryos injected with eGFP mRNA (control) or wt hif1ab, vegfaa, egfl7 or alcama mRNA. b, qPCR analysis of vclb, epas1a and epas1b and emilin3a mRNA levels in vcla, hif1ab and egfl7 wt, heterozygous and mutant zebrafish. c, qPCR analysis of hbegfa, hif1ab, vegfaa and alcama mRNA levels in hbegfa, hif1ab, vegfaa and alcama wt and heterozygous zebrafish using primers specific for the wt allele. d, qPCR analysis of Fermt1 and Rel mRNA levels in wt and Fermt2 and Rela K.O. cells transfected with empty vectors (control) or plasmids encoding wt Fermt2 or RELA. e, Western blot analysis of Fermt2 and ACTB levels in Fermt2 K.O. cells transfected with empty vectors (control) or plasmids encoding wt Fermt2. f, Western blot analysis of RELA and ACTB levels in Rela K.O. cells transfected with empty vectors (control) or plasmids encoding wt RELA. g, qPCR analysis of Actg1 mRNA levels in wt and heterozygous Actb mESCs. a-d, g, n = 3 biologically independent samples. wt or control expression set at 1 for each assay. Error bars, mean, s.d. Two-tailed student’s t-test used to assess P values. e, f, These experiments were repeated twice independently with similar results. For western blots’ source data, see Supplementary Figure 1.
Extended Data Figure 3
Extended Data Figure 3. Transcriptional adaptation involves enhanced transcription and is independent of the DNA lesion itself.
a, qPCR analysis of hbegfb and emilin3a mRNA and pre-mRNA levels in hbegfa and egfl7 wt and mutant zebrafish. b, qPCR analysis of Fermt1 and Rel mRNA and pre-mRNA levels in Fermt2 and Rela wt and K.O. cells. c, Integrated genome viewer tracks of Fermt1 (Fermt1) locus showing ATAC-seq signals in wt and Fermt2 K.O. cells. d, qPCR analysis of hbegfa, hbegfb and egfl7, emilin3a mRNA levels in hbegfa and egfl7 wt and Δ3 mutant zebrafish. e, qPCR analysis of vegfaa, vegfab and egfl7, emilin3a mRNA levels in vegfaa and egfl7 wt and 5’UTR mutant zebrafish. f, qPCR analysis of vcla and vclb mRNA levels in vcla wt and last exon (exon 22) mutant zebrafish. a, b, d-f, n = 3 biologically independent samples. wt expression set at 1 for each assay. Error bars, mean, s.d. Two-tailed student’s t-test used to assess P values.
Extended Data Figure 4
Extended Data Figure 4. Reduction in mutant transcript levels is due to mRNA decay.
a, qPCR analysis of hbegfa, egfl7 and alcama mRNA and pre-mRNA levels in hbegfa, egfl7 and alcama wt and mutant zebrafish. b, qPCR analysis of Fermt2 and Rela mRNA and pre-mRNA levels in Fermt2 and Rela wt and K.O. cells. c, qPCR analysis of 4sU labeled Fermt-2, Rela and Actg1 mRNA and pre-mRNA levels in Fermt-2, Rela and Actg1 wt and K.O. cells. d, Fitted exponential decay curves of Fermt2 mRNA levels in wt and Fermt2 K.O. cells. e, Fitted exponential decay curves of Rela mRNA levels in wt and Rela K.O. cells. f, Fitted exponential decay curves of Actg1 mRNA levels in wt and Actg1 K.O. cells. a-f, n = 3 (a, b, d-f); 2 (c) biologically independent samples. a-c, wt expression set at 1 for each assay. Error bars, mean, s.d. Two-tailed student’s t-test used to assess P values.
Extended Data Figure 5
Extended Data Figure 5. RNA decay induces transcriptional adaptation.
a, qPCR analysis of hbegfa, vegfaa, and vcla mRNA levels in upf1;hbegfa, upf1;vegfaa and upf1;vcla double mutant zebrafish. b, qPCR analysis of Rela mRNA levels after siRNA mediated knockdown of indicated proteins in Rela K.O. cells. c, qPCR analysis of Actb mRNA levels after siRNA mediated knockdown of indicated proteins in Actb K.O. cells. d, qPCR analysis of hbegfa mRNA levels in 6 dpf hbegfa mutants treated with NMD inhibitor (NMDi). e, qPCR analysis of hbegfb mRNA levels in 6 dpf hbegfa mutants treated with NMDi. f, qPCR analysis of Rela mRNA levels in Rela K.O. cells treated with cycloheximide (CHX). g, qPCR analysis of Rel mRNA levels in Rela K.O. cells treated with CHX. h, qPCR analysis of endogenous hif1ab and vegfaa mRNA levels in 6 hpf wt embryos injected with uncapped hif1ab or vegfaa RNA. i, qPCR analysis of Actg1 mRNA levels in mESCs transfected with uncapped Actb RNA at different times post-transfection. j, qPCR analysis of injected hif1ab, epas1a and injected vegfaa, vegfab RNA levels in 6 hpf wt embryos injected with uncapped hif1ab or vegfaa transcripts with or without a 5’ xrFRAG sequence. hr, hour. k, qPCR analysis of epas1a and vegfab mRNA levels in 6 hpf wt zebrafish embryos injected with uncapped sense or antisense hif1ab or vegfaa RNA. b, c, Scr: Scrambled siRNA control. a-d, f, h-k, wt or control expression set at 1 for each assay. a-k, n = 3 biologically independent samples. Error bars, mean, s.d. Two-tailed student’s t-test used to assess P values.
Extended Data Figure 6
Extended Data Figure 6. Mutant mRNA decay helps confer genetic robustness
a, qPCR analysis of Fermt2 and Fermt1 mRNA levels following CRISPRi mediated knockdown of Fermt2 transcription in Fermt2 K.O. cells. b, qPCR analysis of emilin3a, emilin3b and emilin2a mRNA levels in wt, egfl7Δ4 mutant and egfl7full locus del. mutant 20 hpf zebrafish. c, Number of CtAs connecting to the basilar artery (BA) in 58 hpf vegfaaΔ10 and vegfaapromoter-less mutants. d, Blood flow velocity in 78 hpf wt, hbegfaΔ7 and hbegfafull locus del. mutants. e, Quantification of the cardiac ventricle length in 100 hpf wt, alcama Δ8 and alcamapromoter-less mutant larvae. a, b, wt or control expression set at 1 for each assay. a-e, n = 3 (a, b); 13 and 19 (c); 25 (d); 18, 7, 22 and 15 (e) animals. Error bars, mean, s.d. Two-tailed student’s t-test used to assess P values.
Extended Data Figure 7
Extended Data Figure 7. Analysis of sequence similarity parameters in models of transcriptional adaptation.
a, Numbers of differentially expressed genes in the different K.O. cell line models; P ≤ 0.05; these genes are distributed throughout the genome (data not shown). b, Venn diagram of genes upregulated in the three different cell line models with Log2 Fold (L2F) K.O. > wt and P ≤ 0.05. c, KEGG pathway enrichment analysis for genes commonly upregulated in Fermt2, Actg1 and Actb K.O. cells compared to wt. The top 10 pathways based on P value are displayed. The dashed line marks a P value of 0.05. Circle sizes aim to provide scale; outer gray circles represent the total number of genes in the pathway while centered colored circles represent the number of genes in the pathway that are commonly upregulated. d, Impact of various values of three different BLASTn alignment quality parameters (alignment length, Bit score, E-value) on the significance of the observed correlation between up-regulation and sequence similarity and thereby the identification/predication of putative adapting genes. E-value describes the probability of the match resulting from chance (lower = better), while Bit score evaluates the combination of alignment quality and length (higher = better). Each diagram shows the negative log10 of the significance P value (higher = better) on the Y-axis, and the respective parameter value on the X-axis. A P value of 0.05 is marked with a black horizontal line. The E-value thresholds used in our analyses are highlighted with a circle. Lines ending preliminarily indicate a lack of any remaining alignments after that point. The first row of diagrams explores large variations of thresholds in an attempt to identify the total range, while the second row focuses on the most relevant window for the three genes investigated. The optimal thresholds differ considerably depending on the gene analyzed. a-d, n = 2 biologically independent samples. DESeq2 tests for significance of coefficients in a negative binomial GLM (Generalized Linear Model) with the Wald test. P values were not multiple testing corrected.
Extended Data Figure 8
Extended Data Figure 8. Expression level of genes exhibiting sequence similarity in the different mouse cell line models.
a-c, RNA-seq analysis of genes exhibiting sequence similarity with Fermt2 (a), Actg1 (b) or Actb (c) in K.O. cells compared to wt. L2F: Log2 Fold change. Bold: Significantly upregulated in K.O. cells relative to wt. Red: L2F>0, blue: L2F<0. Green: P value or P adjusted value ≤ 0.05. Purple: Genes that exhibit sequence similarity with the mutated gene’s mRNA in their promoter region. Yellow: Genes that exhibit sequence similarity with the mutated gene’s mRNA in their 3’UTR region. Other non-colored genes exhibit sequence similarity with the mutated gene’s mRNA in their exons or introns. Boxed: upregulated in K.O. but not RNA-less cells; no Fermt2 RNA-less allele was analyzed. d, qPCR analysis of Ubapl, Fmnl2, Cdk12 and Actr1a pre-mRNA levels in Actg1 K.O. cells relative to wt. e, qPCR analysis of actb1 mRNA levels in 6 hpf wt zebrafish injected with uncapped mouse Actb RNA. f, Schematic representation of regions of sequence similarity between hif1ab mRNA and epas1a locus. TSS: transcription start site. Grey shaded triangles represent the alignments; intensity represents alignment quality and width at the base represents length of the similarity region. g, qPCR analysis of epas1a mRNA levels in 6 hpf wt zebrafish embryos injected with uncapped RNA composed solely of the hif1ab sequences similar to epas1a promoter, exons, introns, or 3’UTR. a-e, g, n = 2 (a-c); 3 (d, e, g) biologically independent samples. a-c, DESeq2 tests for significance of coefficients in a negative binomial GLM (Generalized Linear Model) with the Wald test. P values were not multiple testing corrected. d, e, g, wt or control expression set at 1 for each assay. Error bars, mean, s.d. Two-tailed student’s t-test used to assess P values.
Extended Data Figure 9
Extended Data Figure 9. Transcriptional adaptation involves chromatin remodeling dependent on decay factor activity.
a, qPCR analysis of Rel mRNA levels after siRNA mediated knockdown of the indicated proteins in Rela K.O. cells. b, ChIP-qPCR analysis of H3K4me3 occupancy at non-promoter regions (as a control) of Fermt1, Rel and Actg2 in Fermt-2, Rela and Actg1 K.O. cells, respectively, compared to wt. c, ChIP-qPCR analysis of H3K4me3 occupancy near the Rel TSS and a non-promoter region (as a control) after siRNA mediated knockdown of the indicated proteins in Rela K.O. cells. Scr: Scrambled siRNA control. d, Current expanded model of transcriptional adaptation to mutations. RNA decay fragments may act as intermediates to bring decay factors, and chromatin remodelers, to adapting gene loci, thereby triggering increased gene expression. Alternatively, RNA decay fragments may function to repress antisense RNAs at the adapting gene loci allowing for increased sense mRNA expression. It is, however, likely that additional mechanisms are involved in transcriptional adaptation, and possibly in a gene-dependent manner. a-c, n = 3 (a); 2 (b, c) biologically independent samples. Error bars, mean, s.d. Two-tailed student’s t-test used to assess P values.
Extended Data Figure 10
Extended Data Figure 10. Antisense transcripts as potential players in the transcriptional adaptation response.
a, qPCR analysis of Cdk9 and Sox9 mRNA levels in cells transfected with uncapped Cdk9 or Sox9 RNA. b, qPCR analysis of BDNF and BDNF-AS mRNA levels in HEK293T cells transfected with uncapped BDNF RNA. c, Integrated genome viewer tracks of vclb and hbegfb loci showing the location of the annotated antisense transcripts. Two alignments of 105 and 147 bp were observed between vcla mRNA and vclb AS RNAs, and an alignment of 39 bp was observed between hbegfa mRNA and hbegfb AS RNA. d, qPCR analysis of vclb and hbegfb antisense RNA levels in vcla and hbegfa wt and mutant zebrafish. a, b, d, Control expression set at 1 for each assay. n = 3 biologically independent samples. Error bars, mean, s.d. Two-tailed student’s t-test used to assess P values.
Figure 1
Figure 1. Transcriptional adaptation in zebrafish and mouse correlates with mutant mRNA decay.
a, qPCR analysis of hbegfb, vclb, epas1a and epas1b, vegfab, emilin3a and alcamb mRNA levels in hbegfa, vcla, hif1ab, vegfaa, egfl7 and alcama wt and mutant zebrafish. b, qPCR analysis of Fermt1, Rel, Actg2 and Actg1 mRNA levels in Fermt-2, Rela, Actg1 and Actb wt and K.O. cells. c, d, qPCR analysis of hbegfb and vclb (c) and hbegfa and vcla (d) mRNA levels in the indicated hbegfa and vcla mutant alleles. e, qPCR analysis of hif1ab, vegfaa, egfl7 and alcama mRNA levels in hif1ab, vegfaa, egfl7 and alcama wt and mutant zebrafish. f, qPCR analysis of Fermt-2, Rela, Actg1 and Actb mRNA levels in Kindlin-2, Rela, Actg1 and Actb wt and K.O. cells. a-f, n = 3 biologically independent samples. wt expression set at 1. Error bars, mean, s.d. Two-tailed student’s t-test used to assess P values.
Figure 2
Figure 2. Mutant mRNA decay is required for transcriptional adaptation.
a, qPCR analysis of hbegfb, vegfab, and vclb mRNA levels in upf1;hbegfa, upf1;vegfaa and upf1;vcla double mutant zebrafish. b, qPCR analysis of Rel mRNA levels after siRNA mediated knockdown of indicated proteins in Rela K.O. cells. c, qPCR analysis of Actg1 mRNA levels after siRNA mediated knockdown of indicated proteins in Actb K.O. cells. d, qPCR analysis of injected hif1ab, epas1a, injected vegfaa, and vegfab RNA levels in 6 hpf wt embryos injected with the indicated RNA. b, c, Scr: Scrambled siRNA control. d, wt or control expression set at 1. a-d, n = 3 biologically independent samples. Error bars, mean, s.d. Two-tailed student’s t-test used to assess P values.
Figure 3
Figure 3. Alleles that fail to transcribe the mutated gene do not display transcriptional adaptation.
a, qPCR analysis of hbegfa, hbegfb, vegfaa, vegfab, alcama and alcamb mRNA levels in zebrafish lacking the full hbegfa locus or the vegfaa or alcama promoter compared to wt siblings. b, qPCR analysis of Rela, Rel, Actb, Actg1, Actg1 and Actg2 mRNA levels in MEFs and mESCs lacking the Rela promoter or the full Actg1 or Actb locus compared to wt cells. c, Cytotoxicity assay following treatment with TNFα of wt, Rela K.O. and Rela promoter-less MEFs. Percentages normalized relative to DMSO-treated cells. d, Confocal micrographs of wt, Actb K.O. and Actb full locus deletion mESCs. Actin filaments are depicted in white, nuclei in red. e, Actin filament protrusion length in wt, Actb K.O. and Actb full locus deletion mESCs. f, Confocal micrographs of 48 hpf Tg(fli1a:eGFP) wt and egfl7 full locus deletion mutant siblings; lateral views, anterior to the left. Higher magnifications of dashed boxes shown in f’. Scale bars: e, 20 µm; f, 500 µm. a, b, wt expression set at 1. a-c, e, n = 3 (a, b); 5 (c); 189, 219 and 205 (e) independent experiments. Error bars, mean, s.d. Two-tailed student’s t-test used to assess P values. d, f, These experiments were repeated twice independently with similar results.
Figure 4
Figure 4. Transcriptional adaptation favors genes exhibiting sequence similarity to the mutated gene’s mRNA and is associated with permissive histone marks.
a, Percentage of significantly upregulated (Log2 Fold Change K.O. > wt and P ≤ 0.05) protein-coding genes exhibiting sequence similarity with Fermt-2, Actg1 or Actb and those not exhibiting sequence similarity. b, qPCR analysis of epas1a mRNA levels in 6 hpf wt zebrafish injected with uncapped RNA composed solely of the hif1ab mRNA sequences similar to epas1a or uncapped RNA composed solely of the hif1ab mRNA sequences not similar to epas1a. c, d, ChIP-qPCR analysis of Wdr5 (c) and H3K4me3 (d) occupancy near the TSS of Fermt1, Rel and Actg2 in Fermt-2, Rela and Actg1 K.O. cells, respectively, compared to wt. Quantification of enrichment shown as fold-enrichment over IgG control. e, Current putative simplified model of transcriptional adaptation to mutations. TC: termination codon; DFs: decay factors; RBPs: RNA binding proteins. b, Control expression set at 1. b-d, n = 3 (b); 2 (c, d); biologically independent samples. Error bars, mean, s.d. Two-tailed student’s t-test used to assess P values.

Comment in

References

    1. Tautz D. Redundancies, development and the flow of information. BioEssays : news and reviews in molecular, cellular and developmental biology. 1992;14:263–266. doi: 10.1002/bies.950140410. - DOI - PubMed
    1. Barabasi AL, Oltvai ZN. Network biology: understanding the cell's functional organization. Nat Rev Genet. 2004;5:101–113. doi: 10.1038/nrg1272. - DOI - PubMed
    1. Teng X, et al. Genome-wide consequences of deleting any single gene. Molecular cell. 2013;52:485–494. doi: 10.1016/j.molcel.2013.09.026. - DOI - PMC - PubMed
    1. Rossi A, et al. Genetic compensation induced by deleterious mutations but not gene knockdowns. Nature. 2015;524:230–233. doi: 10.1038/nature14580. - DOI - PubMed
    1. El-Brolosy MA, Stainier DYR. Genetic compensation: A phenomenon in search of mechanisms. PLoS Genet. 2017;13:e1006780. doi: 10.1371/journal.pgen.1006780. - DOI - PMC - PubMed

Publication types