

Alterations in EEG connectivity in healthy young adults provide an indicator of sleep depth
- PMID: 30944934
- PMCID: PMC6559174
- DOI: 10.1093/sleep/zsz081
Alterations in EEG connectivity in healthy young adults provide an indicator of sleep depth
Abstract
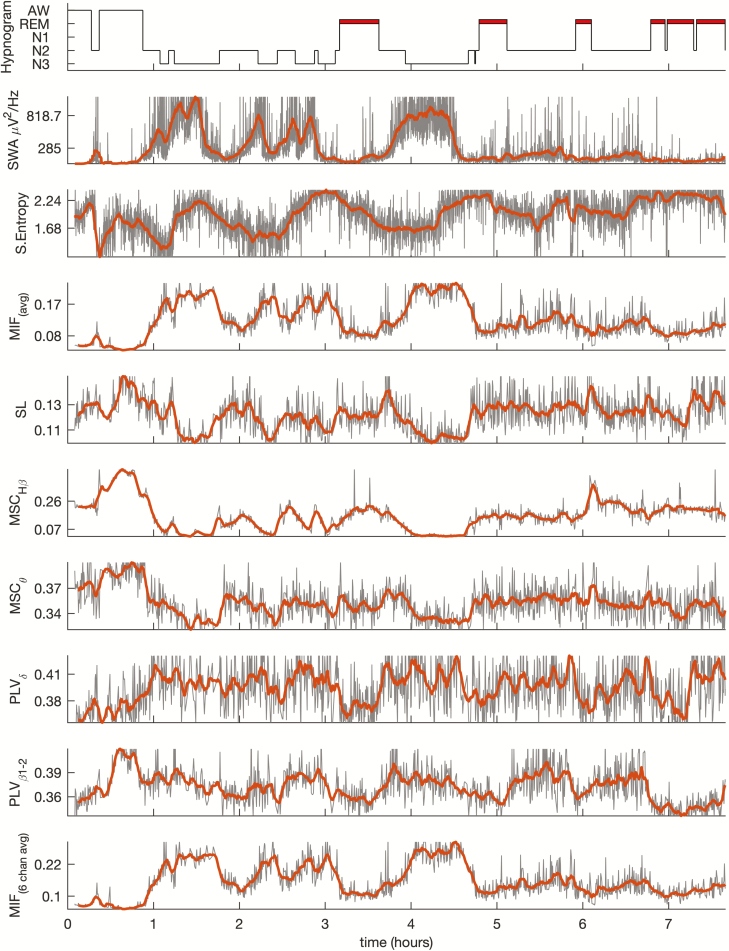
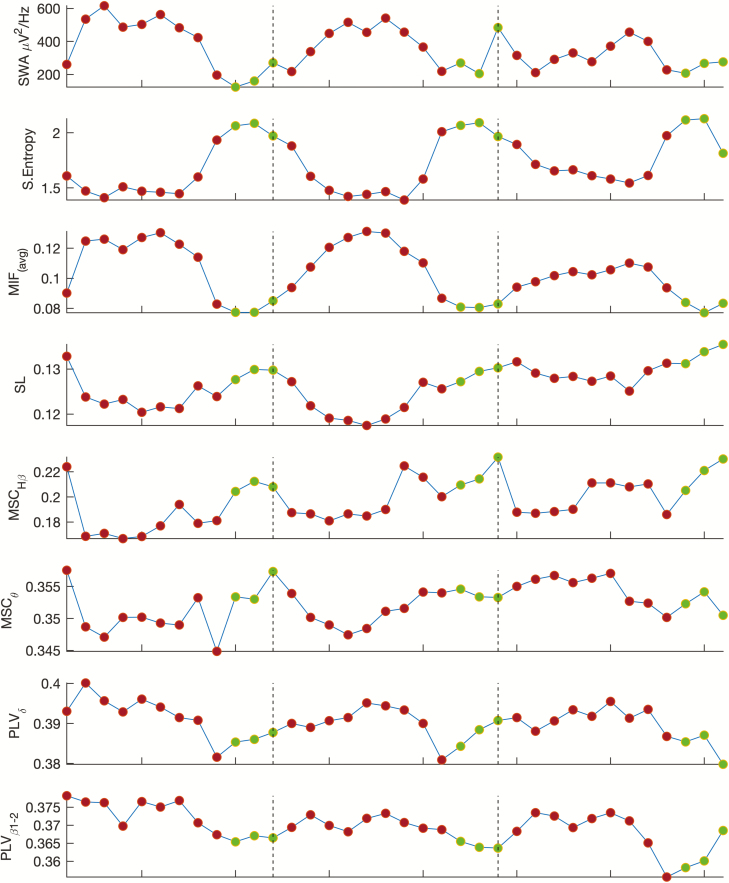
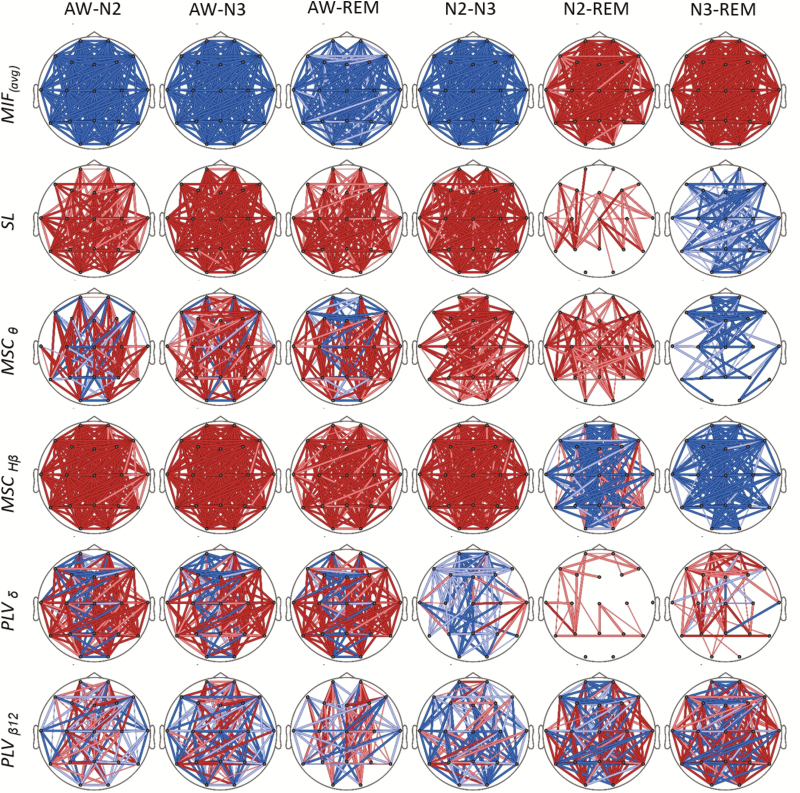
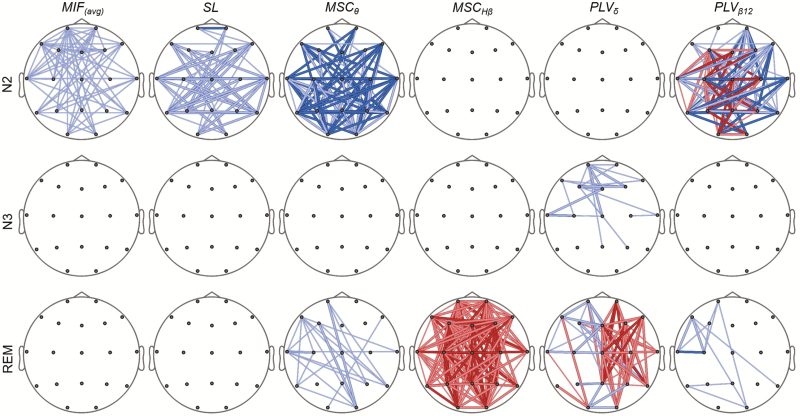
Current sleep analyses have used electroencephalography (EEG) to establish sleep intensity through linear and nonlinear measures. Slow wave activity (SWA) and entropy are the most commonly used markers of sleep depth. The purpose of this study is to evaluate changes in brain EEG connectivity during sleep in healthy subjects and compare them with SWA and entropy. Four different connectivity metrics: coherence (MSC), synchronization likelihood (SL), cross mutual information function (CMIF), and phase locking value (PLV), were computed focusing on their correlation with sleep depth. These measures provide different information and perspectives about functional connectivity. All connectivity measures revealed to have functional changes between the different sleep stages. The averaged CMIF seemed to be a more robust connectivity metric to measure sleep depth (correlations of 0.78 and 0.84 with SWA and entropy, respectively), translating greater linear and nonlinear interdependences between brain regions especially during slow wave sleep. Potential changes of brain connectivity were also assessed throughout the night. Connectivity measures indicated a reduction of functional connectivity in N2 as sleep progresses. The validation of connectivity indexes is necessary because they can reveal the interaction between different brain regions in physiological and pathological conditions and help understand the different functions of deep sleep in humans.
Keywords: electroencephalography; entropy; functional connectivity; slow wave activity.
© Sleep Research Society 2019. Published by Oxford University Press on behalf of the Sleep Research Society. All rights reserved. For permissions, please email: journals.permissions@oup.com.
Figures
References
-
- Walsh JK, et al. . Tiagabine is associated with sustained attention during sleep restriction: evidence for the value of slow-wave sleep enhancement? Sleep. 2006;29(4):433–443. - PubMed
-
- Marshall L, et al. . Boosting slow oscillations during sleep potentiates memory. Nature. 2006;444(7119):610–613. - PubMed
-
- Tononi G, et al. . Sleep function and synaptic homeostasis. Sleep Med Rev. 2006;10(1):49–62. - PubMed
-
- Benington JH, et al. . Restoration of brain energy metabolism as the function of sleep. Prog Neurobiol. 1995;45(4):347–360. - PubMed
-
- Born J, et al. . Hypothalamus-pituitary-adrenal activity during human sleep: a coordinating role for the limbic hippocampal system. Exp Clin Endocrinol Diabetes. 1998;106(3):153–163. - PubMed
