. 2019 Jun 17;32(6):1040-1050.
doi: 10.1021/acs.chemrestox.8b00375. Epub 2019 Apr 15.

Differential Activation of TRPA1 by Diesel Exhaust Particles: Relationships between Chemical Composition, Potency, and Lung Toxicity

Affiliations

Differential Activation of TRPA1 by Diesel Exhaust Particles: Relationships between Chemical Composition, Potency, and Lung Toxicity

Cassandra E Deering-Rice et al. Chem Res Toxicol. .

Abstract

Diesel exhaust particulate (DEP) causes pulmonary irritation and inflammation, which can exacerbate asthma and other diseases. These effects may arise from the activation of transient receptor potential ankyrin-1 (TRPA1). This study shows that a representative DEP can activate TRPA1-expressing pulmonary C-fibers in the mouse lung. Furthermore, DEP collected from idling vehicles at an emissions inspection station, the tailpipe of an on-road "black smoker" diesel truck, waste DEP from a diesel exhaust filter regeneration machine, and NIST SRM 2975 can activate human TRPA1 in lung epithelial cells to elicit different biological responses. The potency of the DEP, particle extracts, and selected chemical components was compared in TRPA1 over-expressing HEK-293 and human lung cells using calcium flux and other toxicologically relevant end-point assays. Emission station DEP was the most potent and filter DEP the least. Potency was related to the percentage of ethanol extractable TRPA1 agonists and was equivalent when equal amounts of extract mass was used for treatment. The DEP samples were further compared using scanning electron microscopy, energy-dispersive X-ray spectroscopy, gas chromatography-mass spectrometry, and principal component analysis as well as targeted analysis of known TRPA1 agonists. Activation of TRPA1 was attributable to both particle-associated electrophiles and non-electrophilic agonists, which affected the induction of interleukin-8 mRNA via TRPA1 in A549 and IMR-90 lung cells as well as TRPA1-mediated mucin gene induction in human lung cells and mucous cell metaplasia in mice. This work illustrates that not all DEP samples are equivalent, and studies aimed at assessing mechanisms of DEP toxicity should account for multiple variables, including the expression of receptor targets such as TRPA1 and particle chemistry.


Conflict of interest statement

The authors declare no competing financial interest.

Figures

Figure 1
Figure 1
Average peak action potential discharge values for pulmonary C-fiber neurons stimulated with the TRPA1 agonist AITC (300 μM) or a suspension of “black smoker” DEP (1 mg/mL), perfused into lungs.
Figure 2
Figure 2
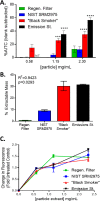
(A) Activation of human TRPA1 (cellular Ca2+ influx) by equivalent concentrations of DEP suspended in treatment media using HEK-293 cells stably overexpressing the human TRPA1 channel and loaded with the fluorogenic calcium indicator Fluo-4AM. (B) Ethanol extractable content of the four DEP samples. (C) Activation of TRPA1 by equivalent masses of ethanol extracted DEP residues using HEK-293 cells stably overexpressing the human TRPA1 channel and loaded with the fluorogenic calcium indicator Fluo-4AM. N.T.: not tested. Single asterisks indicate a significant increase in calcium flux relative to HEK-293 treated controls (triple asterisks indicate p < 0.005; quadruple asterisks indicate p < 0.0001) using a two-way ANOVA with Bonferroni multiple comparisons test.
Figure 3
Figure 3
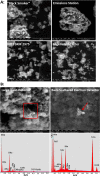
(A) Scanning electron micrograph (SEM) images (500×) of the four DEP samples used as TRPA1 agonists. (B) Comparison of SEM images of emissions station DEP using (left) a large field detector or (right) back-scattered electron detector showing the presence of an electron dense iron-rich particle associated with the larger soot material. Below are the representative screen-capture images from EDS analysis of the emissions station DEP, showing the enrichment of iron associated with the highlighted (red arrow) small particle associated with the soot.
Figure 4
Figure 4
(A) PCA plot comparing the chemical composition of equal masses (1.0 mg) of ethanol extracts from the four DEP samples. The plot was generated using Metaboanalyst software. (B) Results showing the average GC–MS peak areas of 17 PAHs and 3 additional preliminarily identified compounds (by spectral data similarity) in equivalent masses of extract for the four DEP samples. (C) GC–MS peak area values of known TRPA1 agonists in extracts of the four DEP samples. Single asterisks indicate that the “black smoker” was greater than all other DEP (p < 0.001). A single pound sign indicates NIST SRM2975 was greater than the emissions station; double pound sign indicate NIST was greater than regenerated filter DEP (p < 0.01). The two-way ANOVA with Bonferroni multiple comparisons test was used. (D) Relative abundance of specific TRPA1 agonists in a given extract material, normalized to the sum of all agonist peak areas in a given sample. Single asterisks indicate that “black smoker” was greater or lower than all other DEP (p < 0.001). Single pound signs indicate that NIST SRM2975 was greater or less than the emissions station. Carats indicate that the emissions station DEP was greater than all others (p < 0.001). The two-way ANOVA with Bonferroni multiple comparisons test was used.
Figure 5
Figure 5
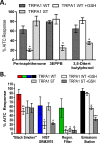
(A) Activation of TRPA1 and TRPA1 mutants by selected TRPA1 agonists (250 μM) with and without GSH pretreatment in TRPA1-over-expressing HEK-293 cells loaded with Fluo-4. Results are normalized to the response of cells to AITC (200 μM). Single asterisks indicate the significant inhibition (p < 0.05) of the response by cells expressing the menthol-binding site mutant TRPA1-S873 V/T874L or using glutathione pretreatment (20 mM; 10 min) of the agonist prior to application to cells using two-way ANOVA with Bonferroni multiple comparisons test. (B) Activation of TRPA1 by ethanol extracted residues of “black smoker” (1.0 mg/mL), NIST SRM 2975 (2.3 mg/mL), emissions station (1.0 mg/mL), and regenerated filter DEP (2.3 mg/mL) and differential inhibition of the responses in TRPA1-S873V/T874L-expressing cells, upon GSH pretreatment of the DEPs, or both. Single asterisks indicate significant inhibition (p < 0.05) using the two-way ANOVA with Bonferroni multiple comparisons test.
Figure 6
Figure 6
(A) Expression of IL-8 mRNA in A549 cells treated with either a vehicle control, “black smoker,” or regenerated filter DEP extracts (0.64 mg/mL) for 4 h in the presence or absence of the TRPA1 antagonist HC-030031 (20 μM). (B) Expression of IL-8 mRNA in A549 cells treated with either a vehicle control, 1,2-napthoquinone (40 μM) or 2,4-ditert butylphenol (40 μM) for 4 h in the presence or absence of the TRPA1 antagonist HC-030031 (20 μM). Asterisks indicate significant induction relative to the control group (p < 0.05) using the two-way ANOVA with Bonferroni multiple comparisons test. (C, D) Changes in IL-8 mRNA expression in IMR-90 cells as above but at (0.38 mg/mL). Single asterisks indicate significant induction relative to the control, while pound symbols signify the inhibition of induction using the TRPA1 antagonist HC-030031 (p < 0.05) using the two-way ANOVA with Bonferroni multiple comparisons test.
Figure 7
Figure 7
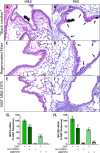
Representative photomicrographs of H&E (panels A, C, and E) and PAS (panels B, D, and F) lung tissue from mice collected after treatment with “black smoker” (panels A and B), regenerated filter (panels C and D), or NIST SRM 2975 DEP (panels E and F). The images were captured at 40× using an EVOS FL auto imaging system. (G, H) Relative expression of mRNA for mucin 4 and 5B (MUC4 and MUC5B) by primary human lobar bronchial epithelial cells treated with regenerated filter DEP for 24 h in the presence of absence of the TRPA1 antagonists HC-030031 (20 μM) or A967079 (20 μM). Double asterisks indicate significant inhibition relative to DEP induced mucin mRNA (p < 0.01) using the one-way ANOVA with Bonferroni’s multiple comparison test.
Figure 8
Figure 8
Representative photomicrographs of H&E-stained distal airway tissue from mice collected after treatment with “black smoker” (panels A and B), regenerated filter (panels C and D), or NIST SRM 2975 DEP (panels E and F). Panels A, C, and E were captured at 40× using an EVOS FL auto imaging system. Panels B, D, and E are expanded from the corresponding images to the left, as indicated by the box.

References

    1. Hammond D. M.; Dvonch J. T.; Keeler G. J.; Parker E. A.; Kamal A. S.; Barres J. A.; Yip F. Y.; Brakefield-Caldwell W. (2008) Sources of ambient fine particulate matter at two community sites in Detroit, Michigan. Atmos. Environ. 42, 720–732. 10.1016/j.atmosenv.2007.09.065. - DOI
    1. Mauderly J. L. (2010) Current Status of the Toxicology of Diesel Engine Exhaust - and the ACES Project. Zentralbl. Arbeitsmed., Arbeitsschutz Ergon. 60, 412–417. 10.1007/BF03346132. - DOI
    1. Hazari M. S.; Haykal-Coates N.; Winsett D. W.; Krantz Q. T.; King C.; Costa D. L.; Farraj A. K. (2011) TRPA1 and Sympathetic Activation Contribute to Increased Risk of Triggered Cardiac Arrhythmias in Hypertensive Rats Exposed to Diesel Exhaust. Environ. Health Perspect. 119, 951.10.1289/ehp.1003200. - DOI - PMC - PubMed
    1. Venkatachalam K.; Montell C. (2007) TRP Channels. Annu. Rev. Biochem. 76, 387–417. 10.1146/annurev.biochem.75.103004.142819. - DOI - PMC - PubMed
    1. Voets T.; Talavera K.; Owsianik G.; Nilius B. (2005) Sensing with TRP channels. Nat. Chem. Biol. 1, 85–92. 10.1038/nchembio0705-85. - DOI - PubMed

Publication types