

A growing socioeconomic divide: Effects of the Great Recession on perceived economic distress in the United States
- PMID: 30947252
- PMCID: PMC6448893
- DOI: 10.1371/journal.pone.0214947
A growing socioeconomic divide: Effects of the Great Recession on perceived economic distress in the United States
Abstract
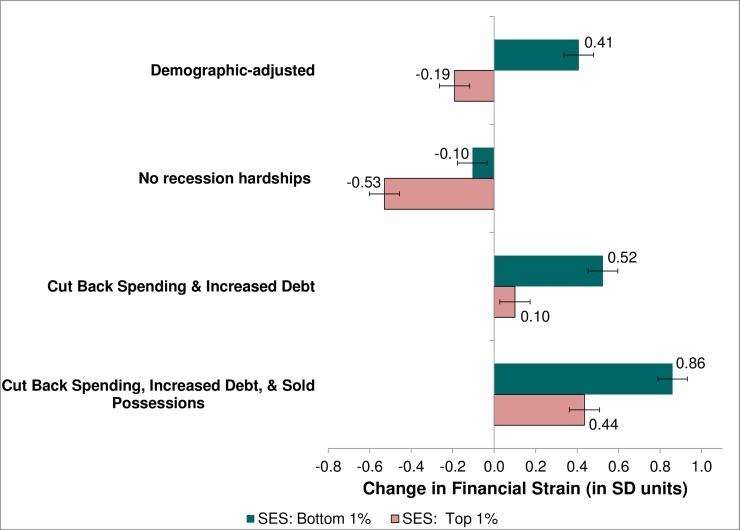
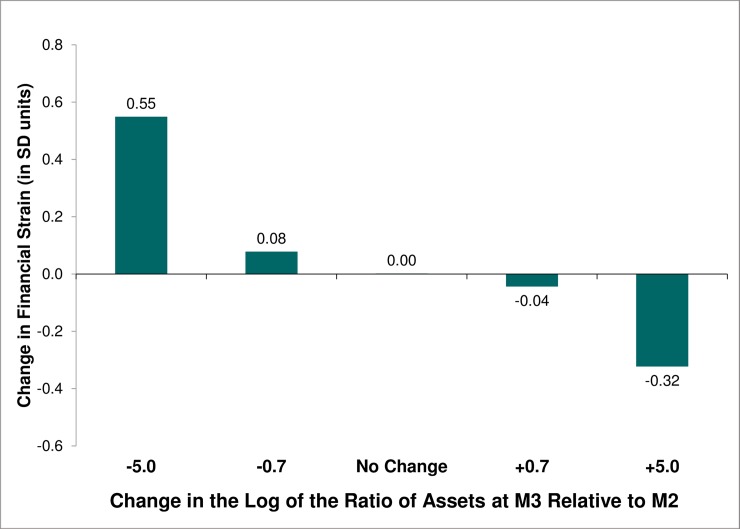
We demonstrate widening socioeconomic disparities in perceived economic distress among Americans, characterized by increasing distress at the bottom and improved perceptions at the top of the socioeconomic ladder. We then assess the extent to which hardships related to the Great Recession account for the growing social disparity in economic distress. Based on the concept of loss aversion, we also test whether the psychological pain associated with a financial loss is greater than the perceived benefit of an equivalent gain. Analyses are based on longitudinal survey data from the Midlife Development in the US study. Results suggest that widening social disparities in perceived economic distress between the mid-2000s and mid-2010s are explained in part by differential exposure to hardships related to the Great Recession, the effects of which have lingered even four to five years after the recession officially ended. Yet, auxiliary analyses show that the socioeconomic disparities in economic distress widened by nearly as much (if not more) during the period from 1995-96 to 2004-05 as they did during the period in which the recession occurred, which suggests that the factors driving these trends may have already been in motion prior to the recession. Consistent with the loss aversion hypothesis, perceptions of financial strain appear to be somewhat more strongly affected by losses in income/assets than by gains, but the magnitude of the differentials are small and the results are not robust. Our findings paint a dismal portrait of a growing socioeconomic divide in economic distress throughout the period from the mid-1990s to the mid-2010s, although we cannot say whether these trends afflict all regions of the US equally. Spatial analysis of aggregate-level mortality and objective economic indicators could provide indirect evidence, but ultimately economic "despair" must be measured subjectively by asking people how they perceive their financial situations.
Conflict of interest statement
The authors have declared that no competing interests exist.
Figures
References
-
- Engemann KM, Wall H, J. The effects of recessions across demographic groups. Federal Reserve Bank of St Louis Review. 2010;92(1): 1–26.
-
- Hipple SF. The labor market in 2009: recession drags on. Monthly Labor Review. 2010;March: 3–22.
-
- Hoynes HW, Miller DL, Schaller J. Who suffers during recessions? The Journal of Economic Perspectives. 2012;26(3): 27–47.
-
- Hurd MD, Rohwedder S. Effects of the financial crisis and Great Recession on American households. Cambridge, MA: National Bureau of Economic Research; 2010
-
- Taylor P, Morin R, Wang W. One Recession, Two Americas: Those Who Lost Ground Slightly Outnumber Those Who Held Their Own. Washington, DC: Pew Research Center; 2010
Publication types
MeSH terms
Grants and funding
LinkOut - more resources
Full Text Sources
Medical
