. 2019 Apr 4;15(4):e1007611.
doi: 10.1371/journal.ppat.1007611. eCollection 2019 Apr.

Gut microbiota from high-risk men who have sex with men drive immune activation in gnotobiotic mice and in vitro HIV infection

Affiliations

Gut microbiota from high-risk men who have sex with men drive immune activation in gnotobiotic mice and in vitro HIV infection

Sam X Li et al. PLoS Pathog. .

Abstract

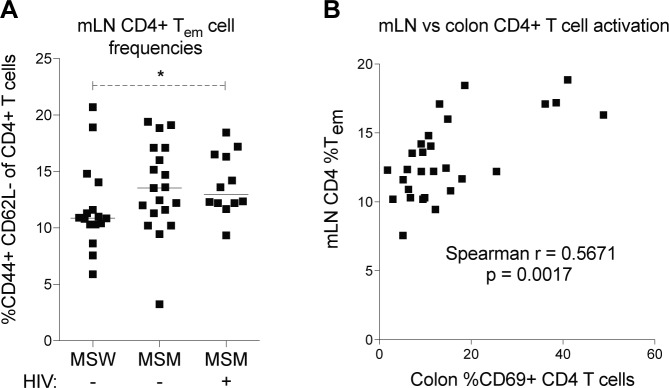
Men who have sex with men (MSM) have differences in immune activation and gut microbiome composition compared with men who have sex with women (MSW), even in the absence of HIV infection. Gut microbiome differences associated with HIV itself when controlling for MSM, as assessed by 16S rRNA sequencing, are relatively subtle. Understanding whether gut microbiome composition impacts immune activation in HIV-negative and HIV-positive MSM has important implications since immune activation has been associated with HIV acquisition risk and disease progression. To investigate the effects of MSM and HIV-associated gut microbiota on immune activation, we transplanted feces from HIV-negative MSW, HIV-negative MSM, and HIV-positive untreated MSM to gnotobiotic mice. Following transplant, 16S rRNA gene sequencing determined that the microbiomes of MSM and MSW maintained distinct compositions in mice and that specific microbial differences between MSM and MSW were replicated. Immunologically, HIV-negative MSM donors had higher frequencies of blood CD38+ HLADR+ and CD103+ T cells and their fecal recipients had higher frequencies of gut CD69+ and CD103+ T cells, compared with HIV-negative MSW donors and recipients, respectively. Significant microbiome differences were not detected between HIV-negative and HIV-positive MSM in this small donor cohort, and immune differences between their recipients were trending but not statistically significant. A larger donor cohort may therefore be needed to detect immune-modulating microbes associated with HIV. To investigate whether our findings in mice could have implications for HIV replication, we infected primary human lamina propria cells stimulated with isolated fecal microbiota, and found that microbiota from MSM stimulated higher frequencies of HIV-infected cells than microbiota from MSW. Finally, we identified several microbes that correlated with immune readouts in both fecal recipients and donors, and with in vitro HIV infection, which suggests a role for gut microbiota in immune activation and potentially HIV acquisition in MSM.


Conflict of interest statement

The authors have declared that no competing interests exist.

Figures

Fig 1
Fig 1. HIV-negative and HIV-positive untreated MSM have higher frequencies of activated and mucosal homing T cells in the blood.
PBMC from HIV-negative MSW (n = 18), HIV-negative MSM (n = 19), and HIV-positive MSM (n = 13) were stained for T cell activation and mucosal homing markers and analyzed by flow cytometry. (A) T cell activation gating strategy. (B–E) Comparison of frequencies of CD38+ HLADR+ (B) CD8+ and (C) CD4+ T cells, and frequencies of CD103+ (D) CD8+ and (E) CD4+ T cells between HIV-negative MSW, HIV-negative MSM, and HIV-positive MSM. Each data point represents an individual, and lines represent median values. Statistical analyses were performed using t-tests to compare groups if data from both groups had normal distributions and Mann-Whitney tests to compare groups if data from at least one group had a non-parametric distribution. **** = p <0.0001, *** = p<0.001, ** = p<0.01, * = p<0.05. (F–G) Spearman correlations between (F) CD8+ T cell activation, plotted on a log scale axis but correlated using linear data, and CD103+ CD8+ T cell frequency, and between (G) CD103+ CD4+ T cell frequency and CCR5+ CD4+ T cell frequency. Dotted lines represent non-linear semi-log (F) and linear (G) regression analysis.
Fig 2
Fig 2. Microbiome composition differences between MSW and MSM are transferred to mouse recipients by fecal transplant.
(A) Gnotobiotic mice were gavaged with feces from HIV-negative MSW (n = 16), HIV-negative MSM (n = 19), and HIV-positive MSM (n = 12) donors and sacrificed 21 days post-gavage for immunological analysis and 16S rRNA gene sequencing. (B) Bacterial load in donor stool. Isolated stool bacteria from a subset of donors (8 HIV-negative MSW, 12 HIV-negative MSM, 11 HIV-positive MSM) were stained and counted by flow cytometry. Each data point represents an individual donor, and lines represent medians. Mann-Whitney tests were performed to compare groups, and no statistically significant differences were detected. (C) Unweighted UniFrac clustering of donor (large dots) and recipient (small dots) microbiome compositions. Green dots represent HIV-negative MSW donor/recipient pairs, red dots represent HIV-negative MSM donor/recipient pairs, and blue dots represent HIV-positive MSM donor/recipient pairs. Lines connect donors to recipients and recipient replicates when applicable. (D) Taxa bar chart showing relative abundance of bacterial families in each donor and recipient. Legend identifies the top 20 most abundant families across all samples. P. copri refers to mice colonized with pure culture of Prevotella copri, and B. uniformis refers to mice colonized with pure culture of Bacteroides uniformis. f__ = unclassified bacterial family.
Fig 3
Fig 3. Gut T cell activation and homing in mouse recipients.
Ileum and colon tissues were collected from mouse recipients at 21 days post gavage and analyzed for frequencies of CD69+ and CD103+ T cells. (A) Gating strategy for CD69+ T cells. Representative plots from ileum tissues are shown. (B-C) Frequencies of (B) CD69+ CD8+ T cells, (C) CD103+ CD8+ T cells, and (D) CD103+ CD4+ T cells in the ileum. (E) Frequencies of CD69+ CD4+ T cells in the colon. Each data point represents a single mouse gavaged with an individual donor’s feces, and a representative mouse was used for stools tested in replicate mice. Lines represent medians. Statistical analyses were performed using t-tests to compare groups if data from both groups had normal distributions and Mann-Whitney tests to compare groups if data from at least one group had a non-parametric distribution. ** = p<0.01, * = p<0.05.
Fig 4
Fig 4. Frequencies of effector memory CD4+ T cells in the mesenteric lymph nodes of mouse recipients.
mLN from mouse recipients were collected and analyzed for effector memory CD4+ T cell frequency (CD44+ CD62L-) using flow cytometry. (A) Comparison of frequencies of CD44+ CD62- CD4+ T cells in the mLN across recipient groups. (B) Spearman correlations of effector memory CD4+ T cell (Tem) frequencies in the mLN with frequencies of CD69+ CD4+ T cells in the colon. Each data point represents a single mouse gavaged with an individual donor’s feces, and a representative mouse was used for stools tested in replicate mice. Lines represent medians. Statistical analyses were performed using t-tests to compare groups if data from both groups had normal distributions and Mann-Whitney tests to compare groups if data from at least one group had a non-parametric distribution. * = p<0.05.
Fig 5
Fig 5. Absence of inflammation, epithelial damage, and bacterial translocation in mouse recipients.
(A) Formalin-fixed ileum and colon sections from mouse recipients (5 HIV-negative MSW, 7 HIV-negative MSM, 6 HIV-positive MSM) were paraffin-embedded and H&E stained, and then analyzed by a blinded pathologist for inflammation and epithelial integrity. Representative images of ileum and colon tissue are shown. Arrows point to the epithelium. All tissues analyzed were scored with the minimal inflammation rating of 1, on a scale of 1–4. (B) Myeloperoxidase concentrations measured by ELISA in colon tissues (12 HIV-negative MSW, 11 HIV-negative MSM, 11 HIV-positive MSM). (C) sCD14 levels measured by ELISA in plasma (11 HIV-negative MSW, 15 HIV-negative MSM, 9 HIV-positive MSM). For (B) and (C), each data point represents an individual mouse, lines represent medians, dotted lines represent the limit of detection. Statistical analyses were performed using t-tests to compare groups if data from both groups had normal distributions and Mann-Whitney tests to compare groups if data from at least one group had a non-parametric distribution. No statistically significant differences were detected.
Fig 6
Fig 6. Fecal bacterial communities isolated from HIV-negative and HIV-positive MSM promote HIV infection of primary human lamina propria cells.
Primary lamina propria cells (LPCs) were isolated from human jejunum tissue, stimulated with isolated fecal bacterial communities (FBCs) from HIV-negative MSW (n = 12), HIV-negative MSM (n = 15), and HIV-positive MSM (n = 9) donor feces, and infected with HIVbal. LPCs were stained for intracellular HIV-1gag expression and T cell activation markers at 5 days post-infection using flow cytometry. (A) Gating strategy for HIVgag+ T cells. (B–C) Comparison of levels of (B) HIV-1gag+ cells and (C) CD38+ HLADR+ CD8+ T cells following infection. Each data point represents the median value of one FBC tested across 3 different individuals’ LPCs. Lines represent medians within groups. Statistical analyses were performed using t-tests to compare groups if data from both groups had normal distributions and Mann-Whitney tests to compare groups if data from at least one group had a non-parametric distribution. * = p<0.05. (D–E) Spearman correlations between frequencies of HIV-1gag+ cells and frequencies of (D) CD38+ HLADR+ CD4+ T cells, and (E) CD38+ HLADR+ CD8+ T cells. Dotted lines represent linear regression analyses.

References

    1. CDC. HIV and Gay and Bisexual Men: Centers for Disease Control and Prevention; 2018 [updated September 26, 2018]. Available from: https://www.cdc.gov/hiv/group/msm/index.html.
    1. Noguera-Julian M, Rocafort M, Guillén Y, Rivera J, Casadellà M, Nowak P, et al. Gut Microbiota Linked to Sexual Preference and HIV Infection. eBioMedicine. 2016. Epub 1-28-2016. - PMC - PubMed
    1. Kelley CF, Kraft CS, de Man TJ, Duphare C, Lee HW, Yang J, et al. The rectal mucosa and condomless receptive anal intercourse in HIV-negative MSM: implications for HIV transmission and prevention. Mucosal Immunol. 2016. 10.1038/mi.2016.97 . - DOI - PMC - PubMed
    1. Armstrong AJS, Shaffer M, Nusbacher NM, Griesmer C, Fiorillo S, Schneider JM, et al. An exploration of Prevotella-rich microbiomes in HIV and men who have sex with men. Microbiome. 2018;6 ARTN 198 10.1186/s40168-018-0580-7 WOS:000449433000001. - DOI - PMC - PubMed
    1. Gianella S, Strain MC, Rought SE, Vargas MV, Little SJ, Richman DD, et al. Associations between virologic and immunologic dynamics in blood and in the male genital tract. J Virol. 2012;86(3):1307–15. 10.1128/JVI.06077-11 - DOI - PMC - PubMed

Publication types

MeSH terms