. 2019 Jun:24:44-63.
doi: 10.1016/j.molmet.2019.03.003. Epub 2019 Mar 14.

Targeted deletion of Tcf7l2 in adipocytes promotes adipocyte hypertrophy and impaired glucose metabolism

Affiliations

Targeted deletion of Tcf7l2 in adipocytes promotes adipocyte hypertrophy and impaired glucose metabolism

Gisela Geoghegan et al. Mol Metab. 2019 Jun.

Abstract

Objective: Activation of the Wnt-signaling pathway is known to inhibit differentiation in adipocytes. However, there is a gap in our understanding of the transcriptional network regulated by components of the Wnt-signaling pathway during adipogenesis and in adipocytes during postnatal life. The key intracellular effectors of the Wnt-signaling pathway occur through TCF transcription factors such as TCF7L2 (transcription factor-7-like 2). Several genetic variants in proximity to TCF7L2 have been linked to type 2 diabetes through genome-wide association studies in various human populations. Our work aims to functionally characterize the adipocyte specific gene program regulated by TCF7L2 and understand how this program regulates metabolism.

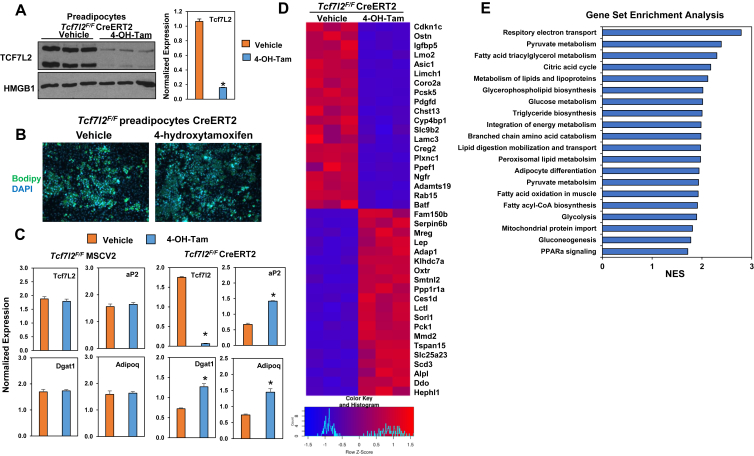
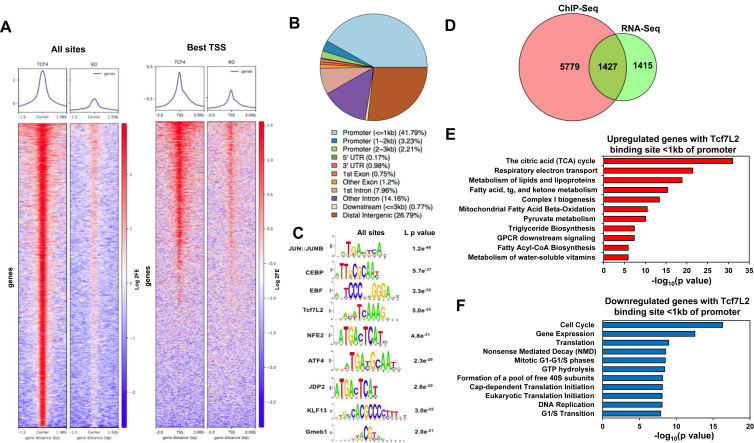
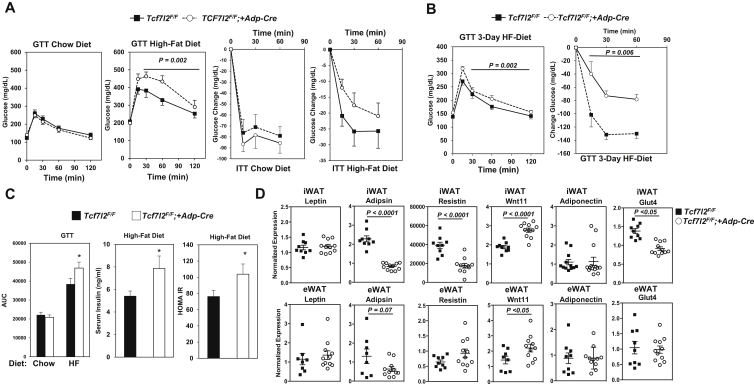
Methods: We generated Tcf7l2F/F mice and assessed TCF7L2 function in isolated adipocytes and adipose specific knockout mice. ChIP-sequencing and RNA-sequencing was performed on the isolated adipocytes with control and TCF7L2 knockout cells. Adipose specific TCF7L2 knockout mice were challenged with high fat diet and assessed for body weight, glucose tolerance, and lipolysis.

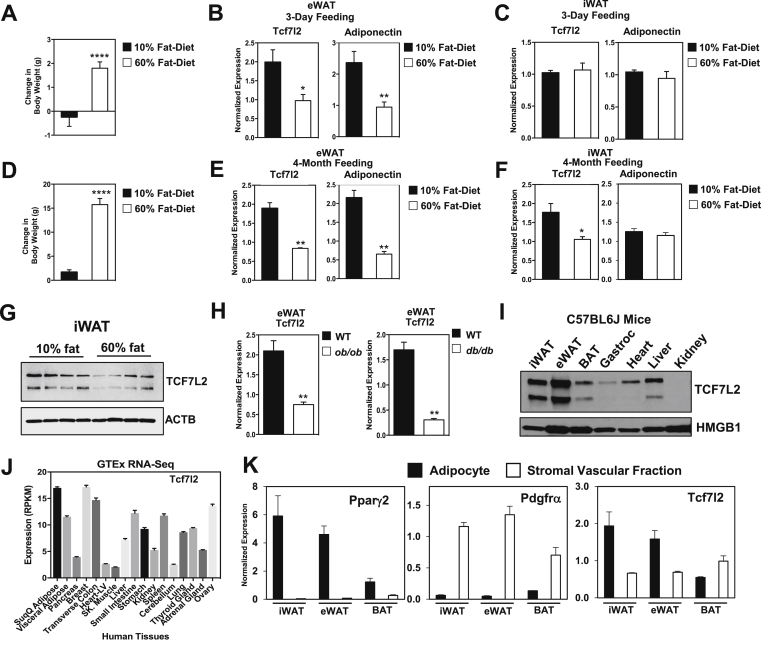
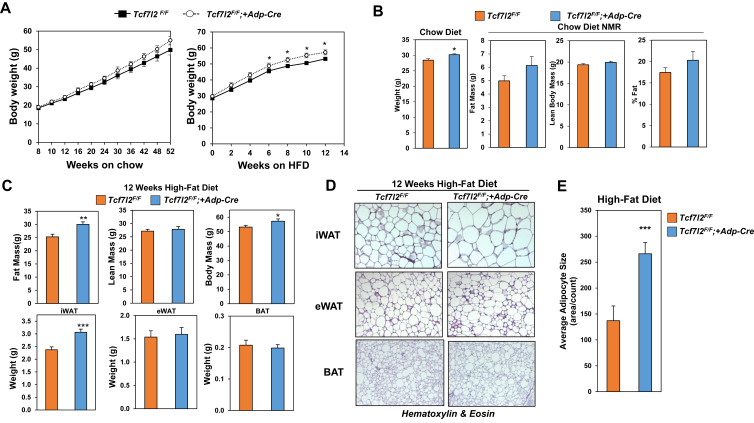
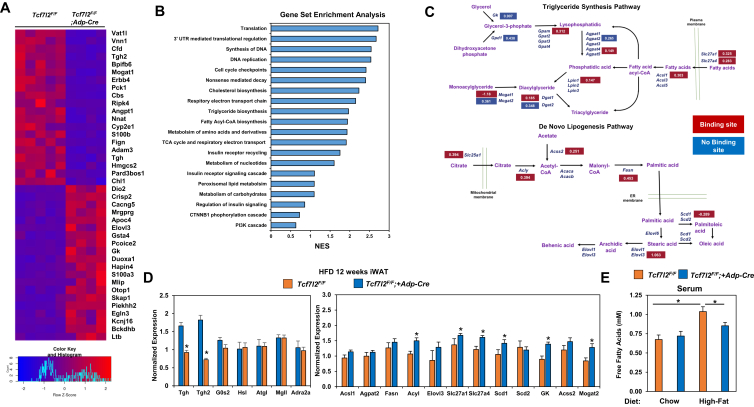
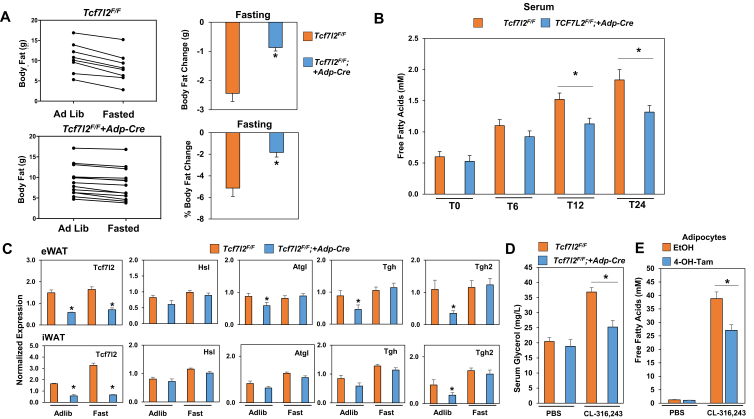
Results: Here we report that TCF7L2 regulates adipocyte size, endocrine function, and glucose metabolism. Tcf7l2 is highly expressed in white adipose tissue, and its expression is suppressed in genetic and diet-induced models of obesity. Genome-wide distribution of TCF7L2 binding and gene expression analysis in adipocytes suggests that TCF7L2 directly regulates genes implicated in cellular metabolism and cell cycle control. When challenged with a high-fat diet, conditional deletion of TCF7L2 in adipocytes led to impaired glucose tolerance, impaired insulin sensitivity, promoted weight gain, and increased adipose tissue mass. This was accompanied by reduced expression of triglyceride hydrolase, reduced fasting-induced free fatty acid release, and adipocyte hypertrophy in subcutaneous adipose tissue.

Conclusions: Together our studies support that TCF7L2 is a central transcriptional regulator of the adipocyte metabolic program by directly regulating the expression of genes involved in lipid and glucose metabolism.

Keywords: Adipose tissue; Diabetes; Lipolysis; Obesity; Wnt signaling.


Figures

Figure 1
Figure 1
TCF7L2 expression is reduced in white adipose tissue with high-fat diet and genetic models of obesity. (A) Change in body weight of C57Bl/6J mice placed on 10% or 60% HFD for 3 days (males, n = 5, 3-months of age). (B) Tcf7l2 and adipoq (adiponectin) gene expression in eWAT and (C) iWAT. (D) Change in body weight of C57Bl/76J mice placed on 60% HFD for 4 months. (males, n = 5 for each group, 60% HFD started at 14 weeks old) (E) Tcf7l2 and adipoq gene expression in eWAT and (F) in iWAT, gene expression normalized to Rps3 expression.(G) Western blot analysis in iWAT of TCF7L2 and ACTB (β-actin) after 4-month HFD. (H) Tcf7l2 expression in eWAT of control, ob/ob mice and db/db mice, gene expression was normalized to Rps3 expression. (I) Western blot analysis of TCF7L2 and HMGB1 expression in mouse tissues. (J) Tcf7l2 expression in human tissues from publicly available GTEx RNA-Seq data set. (K) Gene expression in fractionated adipose tissue depots from C57BL6/J 3-month old male mice. P-values were determined using Student's t-test, *p < 0.05.
Figure 2
Figure 2
Inducible deletion of TCF7L2 results in enhanced adipocyte differentiation and lipid accumulation. (A) Western blot of TCF7L2 and HMGB1 expression in preadipocytes harvested from Tcf7l2F/F mice. CreERT2 expressing preadipocytes were treated with vehicle (ethanol) or 50 nM 4-hydroxytamoxifen, n = 3. Corresponding changes in Tcf7l2 transcript (bar graph). (B) Bodipy and DAPI staining of differentiated Tcf7l2F/F preadipocytes expressing CreERT2. (C) Gene expression changes were measured by real-time PCR and normalized to Rps3 expression. (D) Heat map of differential gene expression changes in control and TCF7L2-null cells (E) Gene Set Enrichment Analysis of differentially expressed genes in control and TCF7L2-null cells. n = 3. P-values were determined using Student's t-test, *p < 0.05.
Figure 3
Figure 3
Genome wide analysis of TCF7L2 binding sites shows direct regulation of metabolic and proliferative pathways. (A) Heat map of ChIP-seq data of TCF7L2 binding in proximity to the transcriptional start site. (B) Genomic distribution of TCF7L2 occupancy. (C) Motif analysis of TCF7L2 ChIP fragments using JASPAR. (D) Venn diagram showing overlap between differential gene expression and genes occupied by TCF7L2. (E) GO analysis of upregulated genes with TCF7L2 binding within 1 kb of promoter region. (F) GO analysis of downregulated genes with TCF7L2 binding within 1 kb of promoter region. n = 3.
Figure 4
Figure 4
Tcf7l2 expression correlates with HOMA-IR, fat mass, and metabolic genes across mouse populations (A) Analysis of Hybrid Mouse Diversity Panel (HMDP) fed a high-fat/high-sucrose diet for 8 weeks for correlation of Tcf7l2 expression in male mice with HOMA-IR and fat mass in female mice (B). ((C) Gene ontology of principle component analysis prioritized two vectors which explained the total HMDP variance in gene expression of the top 500-enriched genes from the ChIP-Seq profiles and Gene Ontology (D). Tcf7l2 gene and ChIP signature integrated with metabolic traits across HMDP.
Figure 5
Figure 5
Adipocyte specific deletion of TCF7L2 leads to glucose intolerance, insulin resistance and altered adipokine expression on HFD. (A) Glucose tolerance test (GTT) and insulin tolerance test (ITT) of Tcf7l2F/F and Tcf7l2F/F;+Adp-Cre mice on control and HFD for 12 weeks (males n = 9 for contols and n = 11 for Tcf7l2F/F;+Adp-Cre at age 6 months) (B) GTT and ITT for Tcf7l2F/F and Tcf7l2F/F;+Adp-Cre mice on control and HFD for 3 days. (males n = 9 for contols and n = 11 for Tcf7l2F/F;+Adp-Cre at age 3 months) (C) AUC for GTT, fasting insulin, and HOMA IR. (D) gene expression in iWAT and eWAT of adipokines and Glut4, gene expression normalized to Rps3 expression. (males n = 9 for contols and n = 11 for Tcf7l2F/F;+Adp-Cre at age 6 months) P-values were determined using ANOVA o student T-test, *p < 0.05.
Figure 6
Figure 6
Selective deletion of TCF7L2 in adipocytes promotes weight gain and subcutaneous adipocyte hypertrophy. (A) Body weights of Tcf7l2F/F and Tcf7l2F/F;+Adp-Cre mice on Chow (males, n = 6 per group) and HFD (males n = 9 for controls and n = 11 for Tcf7l2F/F;Adp-Cre mice at age 6 months). (B) NMR on chow diet (males n = 9 for controls and n = 11 for Tcf7l2F/F;Adp-Cre mice at age 3 months). (C) NMR and tissue weight on 12 week HFD. (D) H + E staining of eWAT, iWAT and BAT after 12 weeks HFD. (E) Average adipocyte size in iWAT of mice fed HFD. P-values were determined using Student's t-test, *p < 0.05.
Figure 7
Figure 7
TCF7L2 regulates lipogenic and lipolytic gene expression programs. (A) Heat map of differential gene expression changes in iWAT of Tcf7l2F/F and Tcf7l2F/F;+Adp-Cre mice on 12 week HFD (males, n = 5 for control and n = 4 for Tcf7l2F/F;+Adp-Cre mice at age 6 months). (B) Gene Set Enrichment Analysis of gene expression changes in iWAT. (C) Schematic of triglyceride synthesis and de novo lipogeneis pathway with gene expression changes from RNA-Seq analysis. Red boxes indicate TCF7L2 occupancy within 1 kb of the promoter, while blue boxes indicate that there is a lack of nearby TC7L2 binding site. (D) Gene expression of lipolytic and lipogenic genes in iWAT, gene expression normalized to Rps3 expression. (E) Free fatty acid levels in serum. P-values were determined using student's t-test, *p < 0.05.
Figure 8
Figure 8
Loss of TCF7L2 leads to impaired adipocyte lipolysis. (A) Body weight of TCF7L2F/F and TCF7L2F/F;+Adp-Cre mice fasted for 24 h compares to Ad Lib controls. (B) Fasting time course of serum free fatty acid levels. (C) Gene expression of lipolytic genes in eWAT and iWAT, gene expression normalized to Rps3 expression. (males n = 8 for controls and n = 12 for TCF7L2F/F;+Adp-Cre mice at age 5 months). (D) TCF7L2F/F and TCF7L2F/F;+Adp-Cre were administered 1 mg/kg of CL-316,243 or vehicle control. Serum glycerol was measured 30 min after treatment. (E) Immortalized TCF7L2F/F preadipocytes retrovirally expressing CreERT2 were treated with vehicle or 500 nM 4-hydroxytamoxifen for 24 h 10 days post differentiation. Cells were then treated with either PBS or 100 nM CL316,243 for 4 h and media was measured for concentration of free fatty acids. P-values were determined using Student's t-test or in the case of multiple group comparison an ANOVA with a Tukey Posthoc Analysis, *p < 0.05.

References

    1. Morin P.J., Sparks A.B., Korinek V., Barker N., Clevers H., Vogelstein B. Activation of beta-catenin-Tcf signaling in colon cancer by mutations in beta-catenin or APC. Science. 1997;275(5307):1787–1790. - PubMed
    1. Nusse R., Varmus H.E. Many tumors induced by the mouse mammary tumor virus contain a provirus integrated in the same region of the host genome. Cell. 1982;31(1):99–109. - PubMed
    1. Behrens J., von Kries J.P., Kuhl M., Bruhn L., Wedlich D., Grosschedl R. Functional interaction of beta-catenin with the transcription factor LEF-1. Nature. 1996;382(6592):638–642. - PubMed
    1. Li V.S., Ng S.S., Boersema P.J., Low T.Y., Karthaus W.R., Gerlach J.P. Wnt signaling through inhibition of beta-catenin degradation in an intact Axin1 complex. Cell. 2012;149(6):1245–1256. - PubMed
    1. Cavallo R.A., Cox R.T., Moline M.M., Roose J., Polevoy G.A., Clevers H. Drosophila Tcf and Groucho interact to repress Wingless signalling activity. Nature. 1998;395(6702):604–608. - PubMed

Publication types