. 2019 May 6;218(5):1743-1763.
doi: 10.1083/jcb.201811174. Epub 2019 Apr 4.

GPCR-independent activation of G proteins promotes apical cell constriction in vivo

Affiliations

GPCR-independent activation of G proteins promotes apical cell constriction in vivo

Arthur Marivin et al. J Cell Biol. .

Abstract

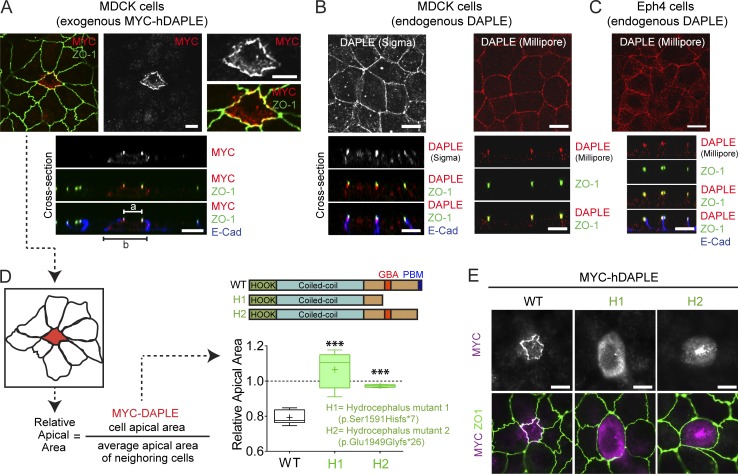
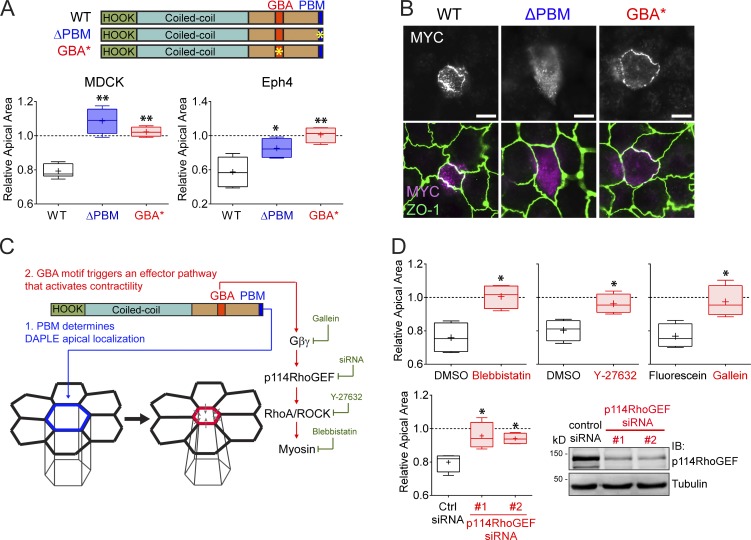
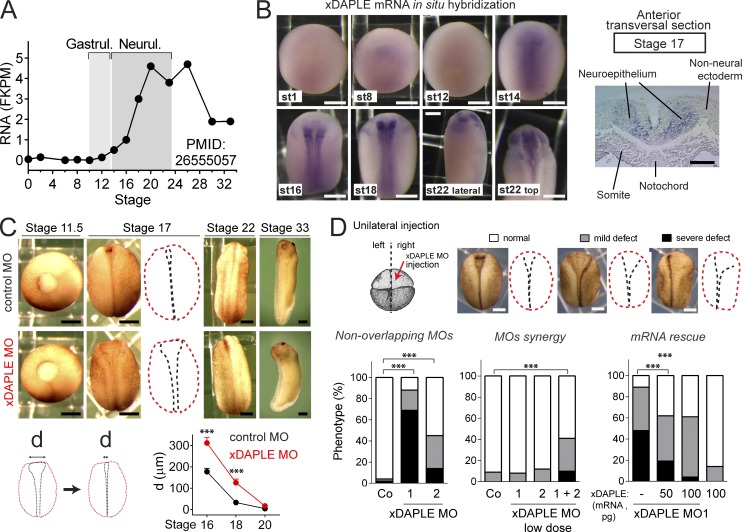
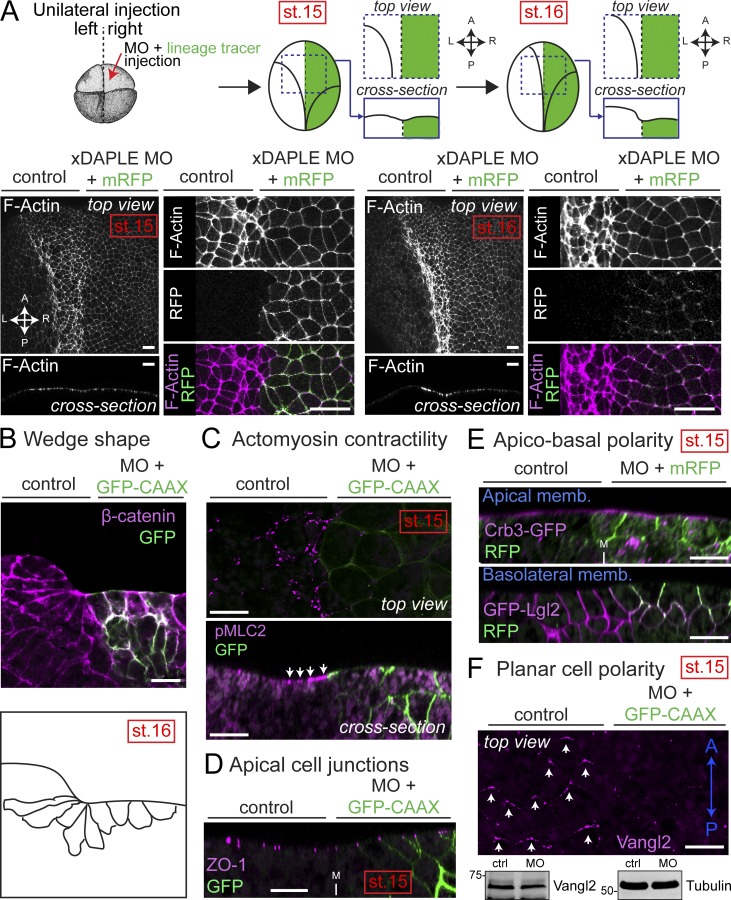
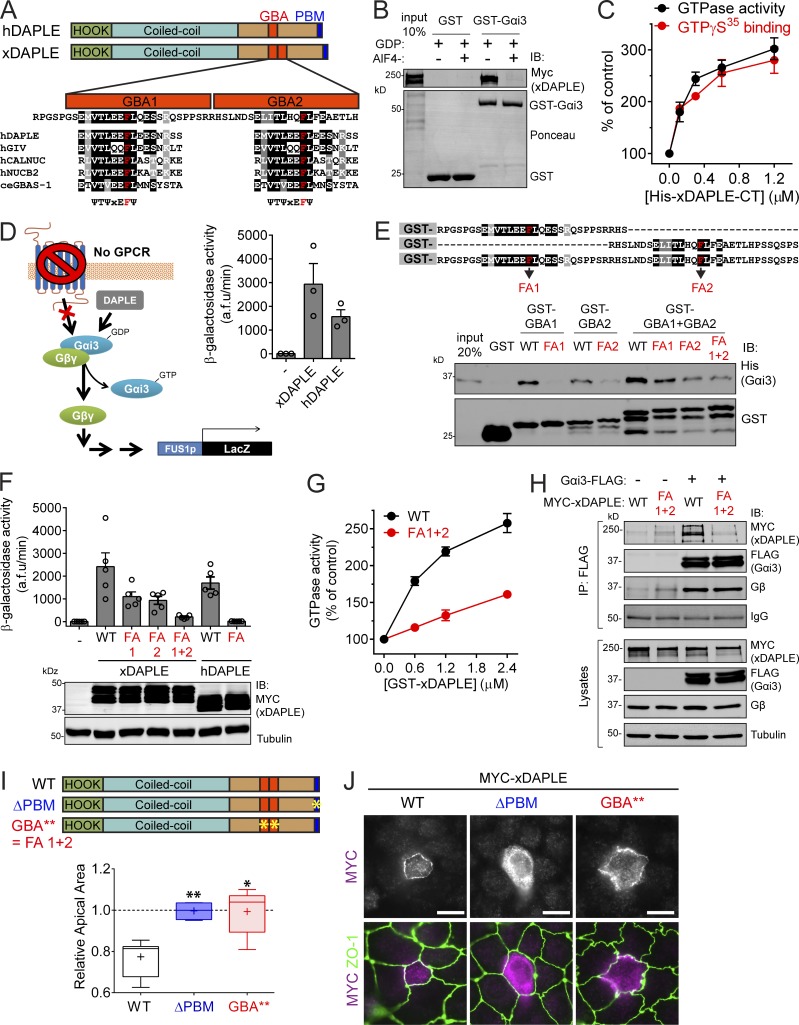
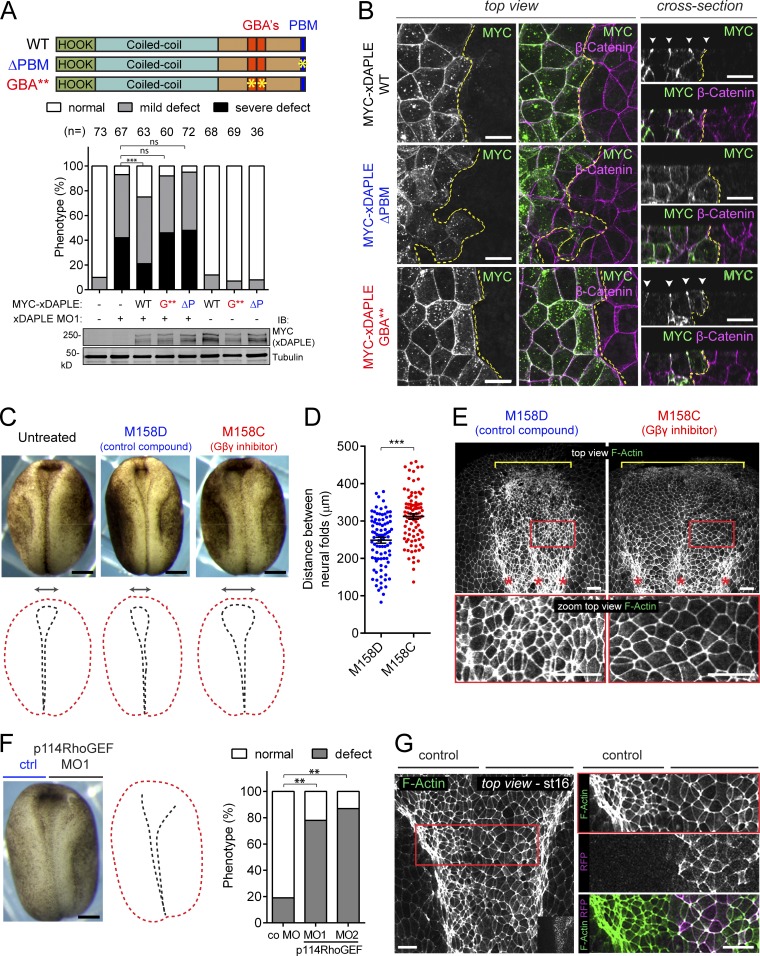
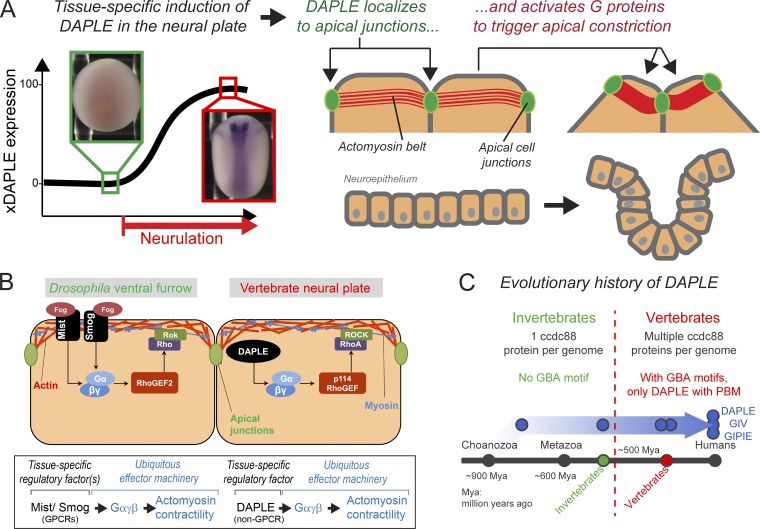
Heterotrimeric G proteins are signaling switches that control organismal morphogenesis across metazoans. In invertebrates, specific GPCRs instruct G proteins to promote collective apical cell constriction in the context of epithelial tissue morphogenesis. In contrast, tissue-specific factors that instruct G proteins during analogous processes in vertebrates are largely unknown. Here, we show that DAPLE, a non-GPCR protein linked to human neurodevelopmental disorders, is expressed specifically in the neural plate of Xenopus laevis embryos to trigger a G protein signaling pathway that promotes apical cell constriction during neurulation. DAPLE localizes to apical cell-cell junctions in the neuroepithelium, where it activates G protein signaling to drive actomyosin-dependent apical constriction and subsequent bending of the neural plate. This function is mediated by a Gα-binding-and-activating (GBA) motif that was acquired by DAPLE in vertebrates during evolution. These findings reveal that regulation of tissue remodeling during vertebrate development can be driven by an unconventional mechanism of heterotrimeric G protein activation that operates in lieu of GPCRs.


Figures

Figure 1.
Figure 1.
DAPLE localizes to apical cell junctions and promotes apical cell constriction. (A) Confocal fluorescence microscopy pictures of MDCK cells sparsely expressing ectopic MYC-hDAPLE costained for MYC (red), ZO-1 (green), and E-cadherin (blue). Top panels correspond to a view on the monolayer from the top, and panels on the bottom are optical cross sections of the monolayer. a and b segments correspond to the width of the apical and basal cell membrane domains. (B and C) Confocal fluorescence microscopy pictures of MDCK (B) or EpH4 (C) cell monolayers stained for DAPLE (Sigma-Aldrich or Millipore antibody, red), ZO-1 (green), and E-cadherin (blue) as indicated. The top panels correspond to views on the cell monolayers from the top, and panels on the bottom are optical cross sections of the monolayers. (D) Quantification of the relative apical area of DAPLE-transfected cells compared with neighboring, untransfected cells shows that hDAPLE WT, but not hydrocephalus-associated mutants (H1 and H2), cause apical constriction in MDCK cells. Results are presented as box-and-whiskers plots (minimum to maximum) of n = 5–9 independent experiments per condition. ***, P < 0.001 using the Mann–Whitney U test. (E) Fluorescence microscopy pictures of MDCK cells sparsely expressing the indicated MYC-hDAPLE constructs and costained for MYC (magenta) and ZO-1 (green) show that H1 and H2 mutants are not enriched at apical cell junctions like WT. Scale bars, 10 µm.
Figure 2.
Figure 2.
Both the PBM and GBA motif of DAPLE are required to promote apical cell constriction. (A) Quantification of the relative apical area of DAPLE-transfected cells compared with neighboring, untransfected cells shows that hDAPLE ΔPBM and hDAPLE GBA* mutants fail to promote apical constriction in MDCK (left) or EpH4 (right) cells. Results are presented as box-and-whiskers plots (error bars indicate minimum to maximum range) of n = 4–9 independent experiments per condition. *, P < 0.05; **, P < 0.01 using the Mann–Whitney U test. (B) Confocal fluorescence microscopy pictures of MDCK cells sparsely expressing the indicated MYC-hDAPLE constructs and costained for MYC (magenta) and ZO-1 (green) show that hDAPLE GBA* mutant is enriched at apical junctions like WT, while hDAPLE ΔPBM mutant is not. Scale bars, 10 µm. (C) Diagram depicting the different functions of the PBM and the GBA motif in DAPLE-induced apical cell constriction. A possible effector pathway to promote apical cell constriction though G protein activation is shown on the right, along with the treatments used in D to test it (green). (D) Box-and-whiskers plots (error bars indicate minimum to maximum range) for the quantification of relative apical area show that DAPLE-mediated apical constriction requires the activity of myosin (inhibited by blebbistatin), ROCK (inhibited by Y-27632), free Gβγ (inhibited by Gallein, but not its inactive analogue, fluorescein) and p114RhoGEF (inhibited by siRNA). n = 4 independent experiments per condition. *, P < 0.05 using the Mann–Whitney U test. The immunoblot (IB) on the bottom right shows the reduction of p114RhoGEF expression upon siRNA treatments.
Figure 3.
Figure 3.
Loss of DAPLE delays NT closure in Xenopus. (A) Quantification of DAPLE mRNA abundance in whole Xenopus embryos at different stages by RNA sequencing showing induction during neurulation. Extracted from Peshkin et al. (2015). (B) Left: Whole-mount RNA in situ Hybridization for xDAPLE showing restricted expression in neural tissues from the onset of neurulation, but not at earlier stages (st). Right: anterior transversal section on the right shows specific expression in neuroepithelial cells. (C) xDAPLE morphants at different stages of development showing a delay in the closure of the neural plate compared with controls. Graph at the bottom shows a quantification of the distance between neural folds from 10 embryos at the indicated stages (average ± SEM). ***, P < 0.001 using the t test (two-tailed, unpaired). (D) Quantification of neural plate bending defects in embryos unilaterally injected with xDAPLE MOs and/or xDAPLE mRNA. n = 50–100 embryos per condition analyzed at stage 17. ***, P < 0.001 using the χ2 test. Validation of xDAPLE MOs is shown in Fig. S2. All scale bars represent 250 µm, except the one in the transversal section in B, which represents 50 µm.
Figure 4.
Figure 4.
Loss of DAPLE in Xenopus causes apical constriction defects during neurulation. (A) Whole-mount F-actin staining (magenta) of Xenopus embryos unilaterally coinjected with xDAPLE MO and a lineage tracer (mRFP or GFP-CAAX, green) showing enlarged apical surface of DAPLE-depleted neuroepithelial cells compared with uninjected control sides at stages 15 and 16. (B) Transversal cryosection stained for β-catenin (magenta) of the anterior neural plate of an embryo at stage 16 unilaterally coinjected with xDAPLE MO and a lineage tracer (GFP-CAAX, green). Outlines of cell borders are depicted in the bottom to show the lack of wedge shape morphology in the outer layer of neuroepithelial cells depleted of DAPLE. (C–F) Whole-mount pMLC2 (C), ZO-1 (D), GFP (E), and Vangl2 (F) staining (magenta) of Xenopus embryos unilaterally coinjected with xDAPLE MO and a lineage tracer (GFP-CAAX or mRFP; green). In E, embryos were bilaterally injected with Crb3-GFP (top) or GFP-Lgl2 (bottom). In F, staining for the lineage tracer (mRFP) is not shown for clarity, and an immunoblot from dissected neural plates is shown in the bottom. xDAPLE depleted sides show defective staining for actomyosin contractility and PCP markers at stage 15, while markers of apical cell junctions or apicobasal polarity are not changed. All images presented in this figure are representative results of n ≥ 3 experiments. All scale bars represent 25 µm, except those in A, which represent 50 µm.
Figure 5.
Figure 5.
xDAPLE promotes G protein signaling and apical cell constriction via two GBA motifs in tandem. (A) Comparison of domain composition of hDAPLE and xDAPLE, and alignment of xDAPLE GBA1 and GBA2 with other GBA motifs. ce, C. elegans; h, Homo sapiens. (B) Full-length xDAPLE from HEK293T cell lysates binds to immobilized GST-Gαi3 when the G protein is loaded with GDP (inactive), but not when it is loaded with GDP-AlF4. (C) Steady-state GTPase (black) and GTPγS binding (red) experiments showing that purified His-xDAPLE-CT accelerates nucleotide exchange of purified His-Gαi3. Results are the average ± SEM of n = 3 experiments. (D) xDAPLE-CT and hDAPLE-CT activate G protein signaling in a yeast-based β-galactosidase reporter assay. Diagram on the left depicts the pathway activated by DAPLE in yeast lacking the cognate GPCR and with the endogenous G protein replaced by human Gαi3. Results on the right are the average ± SEM of n = 3 experiments. (E) Protein–protein binding experiment showing that purified His-Gαi3 binds to both GBA1 and GBA2 of xDAPLE. Diagram on the top shows a detail of the sequence of the purified GST-fused xDAPLE constructs used in the experiment and the position of FA point mutations (in red). (F) G protein activity assays in yeast (as in D) show that both GBA1 and GBA2 have to be mutated simultaneously to abolish xDAPLE-mediated activation. Results are the average ± SEM of n = 5 experiments. (G) Steady-state GTPase experiments showing that activation of purified His-Gαi3 by GST-xDAPLE FA1+2 (red) is impaired compared GST-xDAPLE WT (black). Results are the average ± SEM of n = 3 experiments. Basal activity = 0.16 mol Pi/mol Gαi3/15 min. (H) Coimmunoprecipitation (IP) experiments showing that xDAPLE WT, but not xDAPLE FA1+2 mutant, binds to Gαi3-FLAG when expressed in HEK293T cells. Immunoblots (IB) of the FLAG IPs are shown on the top and equal aliquots of the starting lysates used for it are shown on the bottom. (I) Box-and-whiskers plots (minimum to maximum) for the quantification of relative apical area show xDAPLE ΔPBM and xDAPLE GBA** (FA1+2) mutants fail to promote apical constriction in MDCK cells compared with xDAPLE WT. Results are from n = 4–9 independent experiments. *, P < 0.05; **, P < 0.01 using the Mann–Whitney U test. (J) Fluorescence microscopy pictures of MDCK cells sparsely expressing the indicated MYC-xDAPLE constructs and costained for MYC (magenta) and ZO-1 (green) show that xDAPLE GBA** mutant is enriched at apical junctions like WT, while xDAPLE ΔPBM mutant is not. Scale bars, 10 µm.
Figure 6.
Figure 6.
Activation of G protein signaling by xDAPLE is required for apical cell constriction during neurulation. (A) Quantification of neural plate bending defects in embryos unilaterally injected with xDAPLE MO and/or xDAPLE mRNAs as in Fig. 3 D shows that xDAPLE WT, but neither ΔPBM (ΔP) nor GBA** (G**), rescues neural plate bending defects upon xDAPLE depletion. The number (n) of embryos per condition in indicated above the bars. ***, P < 0.001 or not significant (ns) using the χ2 test. (B) Confocal fluorescence microscopy pictures of the neural plate of Xenopus embryos unilaterally injected with MYC-xDAPLE mRNA and costained for MYC (green) and β-catenin (magenta). The left and middle panels correspond to a view on the neuroepithelium from the top, and panels on the right are optical cross sections. The yellow dotted line separates the injected from the uninjected side of the neuroepithelium. Scale bars, 20 µm. (C) Morphology of Xenopus embryos at stage 16 after treatment with the Gβγ inhibitor M158C or its inactive analogue, M158D. Scale bars, 250 µm. (D) Scatterplot for the quantification of the distance between neural folds from 90 embryos treated with M158D or M158C (average ± SEM). ***, P < 0.001 using the t test (two-tailed, unpaired). (E) Whole-mount F-actin staining of Xenopus embryos at stage 17 after treatment with the Gβγ inhibitor M158C or its inactive analogue, M158D. Red boxes in the top panels are magnified in the bottom panels to show the enlarged area of the neuroepithelial cells treated with M158D compared with M158C. Scale bars, 50 µm. (F) Quantification of neural plate bending defects in embryos unilaterally injected with p114RhoGEF MO1 (splicing-interfering, validated in Fig. S5) and p114RhoGEF MO2 (translation blocking). n = 80 embryos analyzed at stage 17. ***, P < 0.001 using the Fisher exact test. Scale bars, 250 µm. (G) Whole-mount F-actin staining (green) of Xenopus embryos unilaterally coinjected with p114RhoGEF MO1 and a lineage tracer (GFP-CAAX, magenta). The red box in the left panel is magnified in the panels on the right to show the enlarged area of the neuroepithelial cells depleted on p114RhoGEF compared with the control sides. Scale bars, 50 µm. All images presented in this figure are representative results of n ≥ 3 experiments.
Figure 7.
Figure 7.
Mechanism of G protein–mediated regulation of apical cell constriction during neurulation by the non-GPCR protein DAPLE. (A) Expression of DAPLE is specifically induced during neurulation. Upon expression, DAPLE localizes to apical cell junctions of neuroepithelial cells, where it triggers G protein activation that leads to apical cell constriction and the subsequent bending of the neural plate. (B) Theme and variations of G protein–regulated apical cell constriction during epithelial tissue morphogenesis in vertebrates versus invertebrates. Heterotrimeric G proteins are part of a conserved ubiquitous machinery that controls actomyosin contractility, but they are regulated differently across species. In vertebrates, DAPLE fulfills the role performed by GPCRs in invertebrates as tissue-specific activators of signaling that drives apical cell constriction. (C) The G protein regulatory function of DAPLE (i.e., its GBA motif) was acquired during evolution in the transition from invertebrates to vertebrates, suggesting that the unconventional mechanism of G protein activation described here is an evolutionary innovation for epithelial remodeling in vertebrates.

References

    1. Aittaleb M., Boguth C.A., and Tesmer J.J.. 2010. Structure and function of heterotrimeric G protein-regulated Rho guanine nucleotide exchange factors. Mol. Pharmacol. 77:111–125. 10.1124/mol.109.061234 - DOI - PMC - PubMed
    1. Aznar N., Midde K.K., Dunkel Y., Lopez-Sanchez I., Pavlova Y., Marivin A., Barbazán J., Murray F., Nitsche U., Janssen K.P., et al. 2015. Daple is a novel non-receptor GEF required for trimeric G protein activation in Wnt signaling. eLife. 4:e07091 10.7554/eLife.07091 - DOI - PMC - PubMed
    1. Barrett K., Leptin M., and Settleman J.. 1997. The Rho GTPase and a putative RhoGEF mediate a signaling pathway for the cell shape changes in Drosophila gastrulation. Cell. 91:905–915. 10.1016/S0092-8674(00)80482-1 - DOI - PubMed
    1. Blum M., De Robertis E.M., Wallingford J.B., and Niehrs C.. 2015. Morpholinos: Antisense and Sensibility. Dev. Cell. 35:145–149. 10.1016/j.devcel.2015.09.017 - DOI - PubMed
    1. Bonacci T.M., Mathews J.L., Yuan C., Lehmann D.M., Malik S., Wu D., Font J.L., Bidlack J.M., and Smrcka A.V.. 2006. Differential targeting of Gbetagamma-subunit signaling with small molecules. Science. 312:443–446. 10.1126/science.1120378 - DOI - PubMed

Publication types

MeSH terms

Substances