. 2019 Apr 19;364(6437):253.
doi: 10.1126/science.aav3932. Epub 2019 Apr 4.

Thirst regulates motivated behavior through modulation of brainwide neural population dynamics

Affiliations

Thirst regulates motivated behavior through modulation of brainwide neural population dynamics

William E Allen et al. Science. .

Abstract

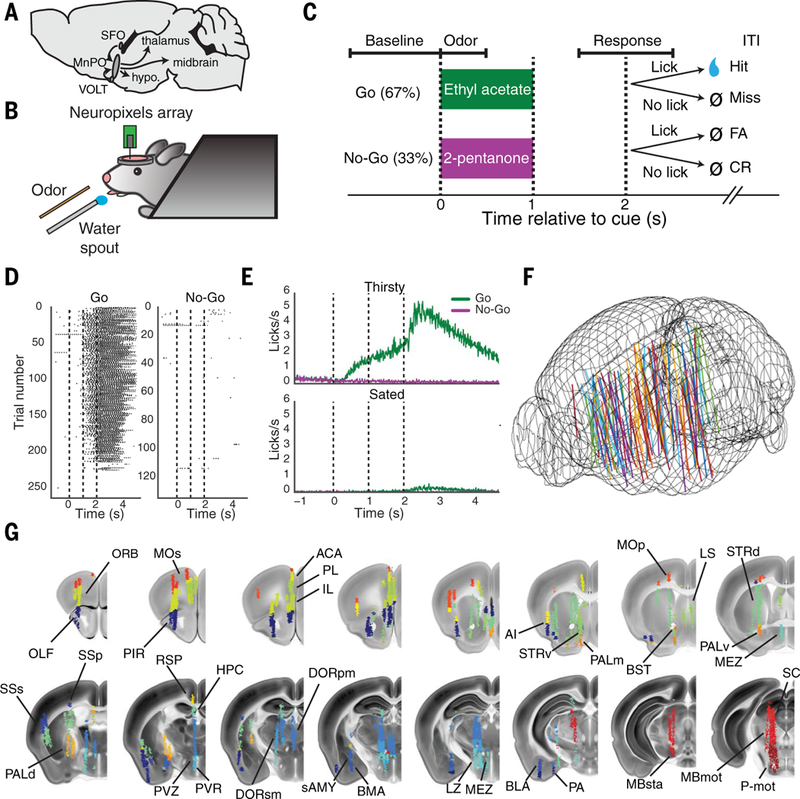
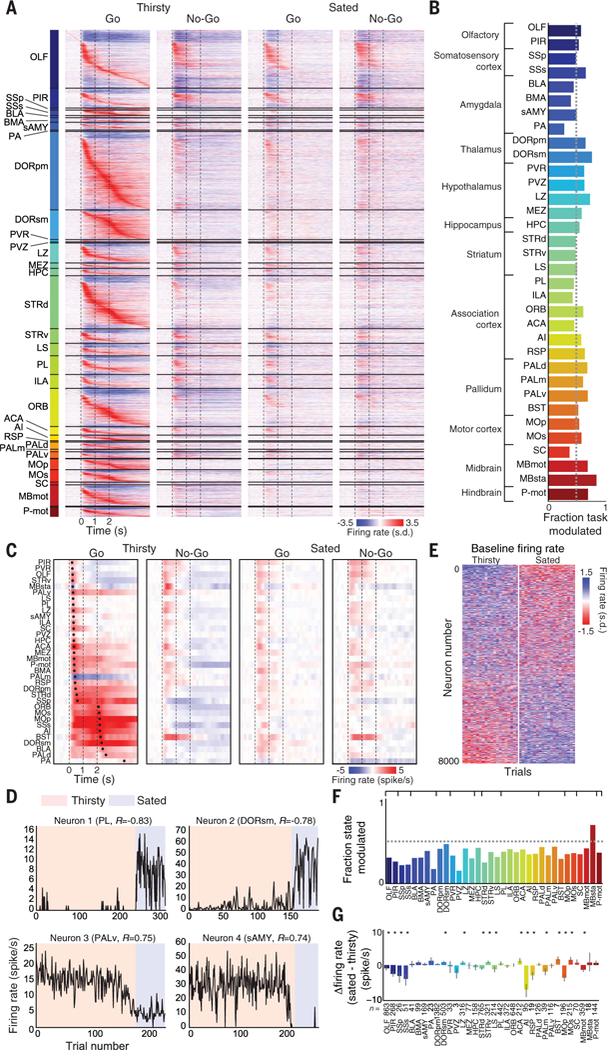
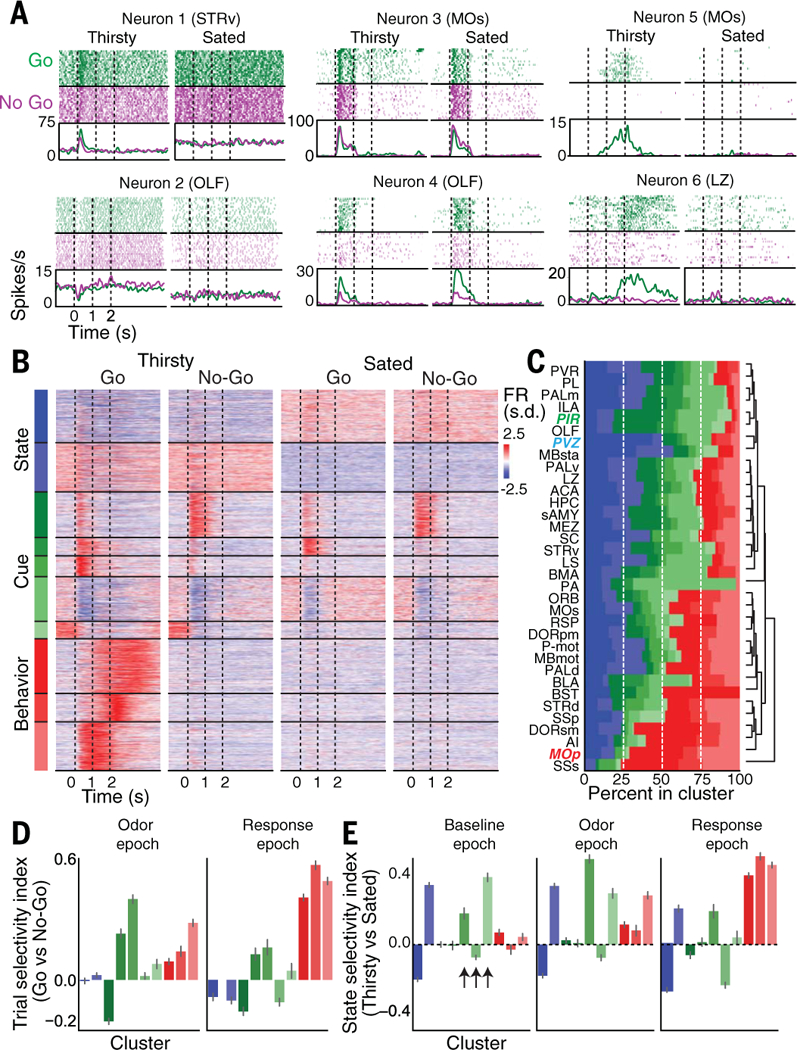
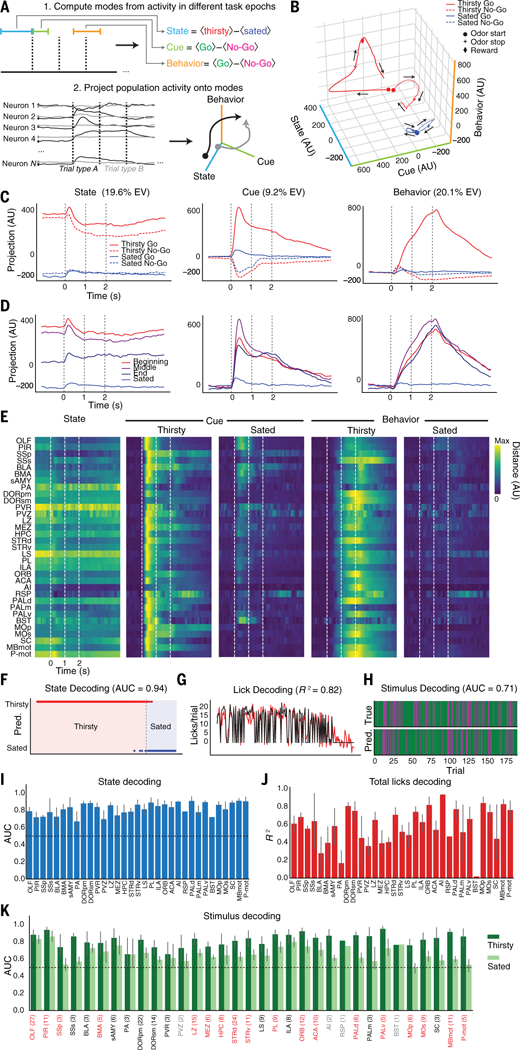
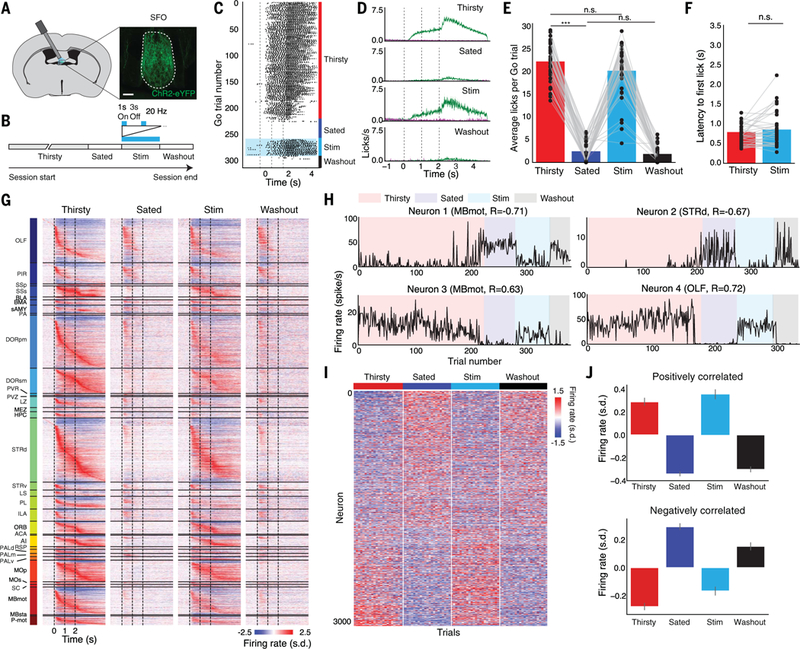
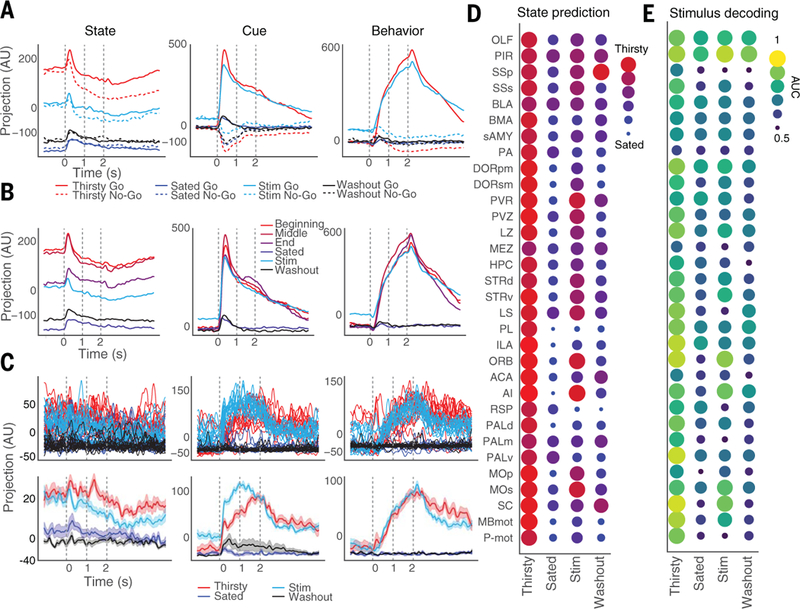
Physiological needs produce motivational drives, such as thirst and hunger, that regulate behaviors essential to survival. Hypothalamic neurons sense these needs and must coordinate relevant brainwide neuronal activity to produce the appropriate behavior. We studied dynamics from ~24,000 neurons in 34 brain regions during thirst-motivated choice behavior in 21 mice as they consumed water and became sated. Water-predicting sensory cues elicited activity that rapidly spread throughout the brain of thirsty animals. These dynamics were gated by a brainwide mode of population activity that encoded motivational state. After satiation, focal optogenetic activation of hypothalamic thirst-sensing neurons returned global activity to the pre-satiation state. Thus, motivational states specify initial conditions that determine how a brainwide dynamical system transforms sensory input into behavioral output.


Figures

Fig. 1.
Fig. 1.. Brainwide neuronal recording during thirst-motivated behavior.
(A) Diagram of the output of the hypothalamic thirst circuit to other brain regions. SFO, subfornical organ; VOLT, vascular organ of the lamina terminalis; MnPO, median preoptic nucleus; hypo., hypothalamus. (B) Schematic drawing of the experimental setup. (C) Diagram of olfactory Go/No-Go task structure and different task epochs: baseline epoch (−1.1 to 0 s before odor period), odor epoch (0 to 0.5 s after odor onset), and response epoch (1.5 to 2.5 s after odor onset). FA, false alarm; CR, correct rejection; ITI, intertrial interval. (D) Example behavioral data from a single behavioral session, showing individual licks on Go and No-Go trials over the course of the session. (E) Average licking behavior on Go and No-Go trials while thirsty and sated (mean ± SEM, N = 87 sessions). (F) Electrode tracks from all 87 recording sessions, co-registered into the Allen common reference space. Mouse brain is outlined in wire mesh. (G) Locations of all recorded neurons in Allen Brain Atlas space, colored by brain region. See table S1 for brain region abbreviations (from Allen Brain Atlas ontology) used here and in subsequent figures.
Fig. 2.
Fig. 2.. Widespread task- and state-related activity dynamics.
(A) Baseline subtracted, Z-scored trial-averaged firing rates for all task-modulated recorded neurons (N = 12,986 of 23,881) from 21 mice, averaged from all thirsty Go and No-Go trials. Neurons are sorted first by brain region, and then by time to peak within Go trial; s.d., standard deviation. (B) Fraction of task-modulated neurons per brain region. (C) Per-region population firing rate during thirsty and sated Go and No-Go trials. Regions are sorted by average time to peak change in population firing rate during the thirsty Go condition, relative to baseline, across all neurons from all mice. Dots indicate times of maximal change in firing rate for each region in each trial type. (D) Example state-modulated neurons (baseline firing rate significantly correlated with state) showing baseline firing rate over trials across session, with brain region and correlation with state (R value) indicated. (E) All state-modulated neurons, Z-scored and sorted by correlation with state, showing the last 20 consecutive trials of thirsty and sated blocks (N = 8395). (F) Fraction of state- modulated neurons per brain region. (G) Average change in baseline firing rate per brain region between thirsty and sated conditions. *P < 0.05 (Wilcoxon signed-rank test, Bonferroni correction). Data are means ± 95% confidence interval.
Fig. 3.
Fig. 3.. Representations of sensory processing, behavioral output, and internal state at the single-neuron level across the brain.
(A) Example neurons correlated with different aspects of the task or state. Top: Spike raster during Go/No-Go trials while thirsty and sated within a single session. Bottom: Average firing rate during same trials. Neurons 1 and 2 are primarily state-related, neurons 3 and 4 are primarily cuerelated, and neurons 5 and 6 are primarily behavior- related. Brain region is indicated in parentheses for each neuron. (B) Unsupervised clustering of all 12,986 task-modulated neurons. Behavior-related clusters are red; cue-related clusters are green; state-related clusters are blue. Individual neurons are trial-averaged per condition and Z-scored across conditions. FR, firing rate. (C) Hierarchically clustered cluster composition by brain region, showing fraction of total task-modulated neurons within each region that comes from all clusters. Regions in colored italics: PVZ (periventricular zone of the hypothalamus) contains mostly state-related neurons, PIR mostly cue-related neurons, and MOp mostly behavior-related neurons. (D) Trial selectivity index per cluster during odor epoch (0 to 0.5 s after odor onset) and response epoch (1.5 to 2.5 s after odor onset). Trial selectivity index is computed as (〈Go〉 – 〈No-Go〉)/(〈Go〉 + 〈No-Go〉) during a particular task epoch, where Go is the average on thirsty Go trials and 〈No-Go〉 is the average on thirsty No-Go trials. (E) State selectivity index per cluster during different task epochs. Trial selectivity index is computed as (〈Thirsty〉 – 〈Sated〉)/ (〈Thirsty〉 + 〈Sated〉) during a particular task epoch, where 〈Thirsty〉 is the average on thirsty Go trials and 〈Sated〉 is the average on sated Go trials. Data in (D) and (E) are means ± 95% confidence interval. Arrows indicate sensory clusters with large changes in firing rate during the task as a function of state.
Fig. 4.
Fig. 4.. Thirst motivational state regulation of brainwide neural population dynamics.
(A) Top: Schematic of how state-, cue-, and behavior-related modes are defined from population activity in different task epochs. Cue and Behavior modes are only computed from thirsty trials. Bottom: Schematic of how neural population activity is projected into a three-dimensional space. (B) Brainwide neural population activity projected onto activity modes (State, Cue, and Behavior) defined by trial-averaged activity during Go and No-Go trials while thirsty and sated. (C) Same as (B), but showing activity along each mode individually. EV, total explained variance. (D) Brainwide population dynamics on Go trials projected onto State, Cue, and Behavior modes over course of session (beginning, middle, end of thirsty block and sated). (E) Per-region average projections of simultaneously recorded population activity onto task axes. State: average absolute difference between thirsty and sated trials projected onto State mode. Thirsty/sated Cue: average absolute difference between Go and No-Go trials projected onto Cue mode. Thirsty/sated Behavior: average absolute difference between Go and No-Go trials projected onto Behavior mode. Each trace is normalized to the maximum across all conditions. (F) Example decoding of state from baseline epoch activity (1 s before odor) of simultaneously recorded neurons in OLF. Prediction on held-out data is shown in dots; observed state values are shown in shaded background. AUC, area under curve. (G) Example decoding of total number of licks from response epoch activity (1 s around potential reward time), from same population as (F). Black, observed; red, predicted. (H) Example decoding of trial type from odor epoch activity (first 500 ms of odor response) over session, from same population as (F). Green, Go trial; magenta, No-Go trial. (I) Per-region average decoding from baseline epoch. (J) Perregion lick decoding over whole session from response epoch. (K) Per-region decoding of stimulus from odor epoch, in thirsty and sated states. Regions labeled in red have a statistically significant decrease in decoding (P < 0.05, two-tailed t test, FDR correction across all regions with three or more recordings). Regions labeled in gray have fewer than three recordings. Numbers of recordings per region for (I) to (K) are indicated in parentheses in (K). Decoder was trained only on thirsty trials. For (I) and (K), chance performance (0.5) is indicated by dashed line. Data in (I) to (K) are means ± 95% confidence interval.
Fig. 5.
Fig. 5.. Causal manipulation of hypothalamic thirst-sensitive neurons recovers brainwide thirst state and global task-related neuronal dynamics.
(A) Expression of ChR2-eYFP in Nos1+ SFO neurons. Scale bar, 100 μm. (B) Experimental timeline for optogenetic stimulation sessions. Mice first perform as in previous figures (“Thirsty” and “Sated”), then are optogenetically stimulated for a block of trials (“Stim”), then stimulation is turned off for a block of trials (“Washout”). (C) Example licking per trial for all Go trials within a session, with different trial blocks labeled. (D) Average licking within each trial block. Data are means ± SEM; N = 36 sessions. (E) Average number of licks per Go trial within each trial block. ***P < 0.001 (Wilcoxon signed-rank test, Bonferroni correction); n.s., not significant. The Hit rate was also not significantly different between Thirsty and Stim conditions (97 ± 1% versus 94 ± 2%, P = 0.67, Wilcoxon signed-rank test). (F) Average latency to first lick on Hit trials in Thirsty and Stim trial blocks (Wilcoxon signed-rank test). (G) Baseline-subtracted, Z-scored trial-averaged firing rates for all task-modulated neurons (N = 5323 of 10,288 total) from all 36 sessions, on Go trials in each trial block. Neurons are sorted by brain region, then by time to peak firing rate on thirsty Go trials. (H) Baseline firing rates across session of example state-modulated neurons in Thirsty, Sated, Stim, and Washout blocks. (I) Z-scored baseline firing rate of state-modulated neurons, sorted by each neuron’s correlation with satiety state. The last 20 trials from each block are shown. (J) Average Z-scored baseline firing rate from top 25% positively and negatively correlated state-modulated neurons. Data are means ± 95% confidence interval.
Fig. 6.
Fig. 6.. Optogenetic thirst induction recovers population activity dynamics and decoding in specific regions.
(A) Projections of average activity on Go and No-Go trials from each trial block onto State, Cue, and Behavior axes (defined using only Thirsty and Sated trials). (B) Projections of average activity on Go trials from trials at different points between Thirsty and Sated trials, and during Stim and Washout blocks, onto different axes. (C) Top: Projections of single trials of simultaneously recorded neurons from ORB onto State, Cue, and Behavior axes. Bottom: Averages of trials in top panels. Data are means ± SEM. (D) Per-region average predictions of satiety state (Thirsty versus Sated) in each trial block, using decoder trained on baseline epoch in Thirsty and Sated trials. (E) Per-region average decoding accuracy of trial type (Go versus No-Go) in each trial block, using decoder trained on odor epoch in Thirsty and Sated trials, using last 40 trials from each block. AUC, area under curve; 0.5 = chance performance. Predictions in Thirsty and Sated blocks in (D) and (E) are on held-out test data. Number of recordings per region: OLF, 12; PIR, 6; SSp, 1; SSs, 3; BLA, 2; BMA, 3; sAMY, 3; PA, 2; DORpm, 7; DORsm, 4; PVR, 1; PVZ, 1; LZ, 5; MEZ, 3; HPC, 4; STRd, 13; STRv, 3; LS, 2; PL, 2; ILA, 3; ORB, 2; ACA, 1; AI, 2; RSP, 1; PALd, 2; PALm, 2; PALv, 1; MOp, 6; MOs, 1; SC, 1; MBmot, 6; P-mot, 2.

Comment in

  • Parsing signal and noise in the brain.
    Huk AC, Hart E. Huk AC, et al. Science. 2019 Apr 19;364(6437):236-237. doi: 10.1126/science.aax1512. Epub 2019 Apr 18. Science. 2019. PMID: 31000652 No abstract available.

References

    1. Hull C, Principles of Behavior: An Introduction to Behavior Theory (Appleton-Century, 1943).
    1. Bolles RC, Theory of Motivation (Harper & Row, 1967).
    1. Toates F, Motivational Systems (Cambridge Univ. Press, 1986).
    1. Berridge KC, Motivation concepts in behavioral neuroscience. Physiol. Behav. 81, 179–209 (2004). doi: 10.1016/j.physbeh.2004.02.004; pmid: - DOI - PubMed
    1. Sternson SM, Eiselt A-K, Three Pillars for the Neural Control of Appetite. Annu. Rev. Physiol. 79, 401–423 (2017). doi: 10.1146/annurev-physiol-021115-104948; pmid: - DOI - PubMed

Publication types