Gadd45α modulates aversive learning through post-transcriptional regulation of memory-related mRNAs
- PMID: 30948457
- PMCID: PMC6549022
- DOI: 10.15252/embr.201846022
Gadd45α modulates aversive learning through post-transcriptional regulation of memory-related mRNAs
Abstract
Learning is essential for survival and is controlled by complex molecular mechanisms including regulation of newly synthesized mRNAs that are required to modify synaptic functions. Despite the well-known role of RNA-binding proteins (RBPs) in mRNA functionality, their detailed regulation during memory consolidation is poorly understood. This study focuses on the brain function of the RBP Gadd45α (growth arrest and DNA damage-inducible protein 45 alpha, encoded by the Gadd45a gene). Here, we find that hippocampal memory and long-term potentiation are strongly impaired in Gadd45a-deficient mice, a phenotype accompanied by reduced levels of memory-related mRNAs. The majority of the Gadd45α-regulated transcripts show unusually long 3' untranslated regions (3'UTRs) that are destabilized in Gadd45a-deficient mice via a transcription-independent mechanism, leading to reduced levels of the corresponding proteins in synaptosomes. Moreover, Gadd45α can bind specifically to these memory-related mRNAs. Our study reveals a new function for extended 3'UTRs in memory consolidation and identifies Gadd45α as a novel regulator of mRNA stability.
Keywords: Gadd45a; Grin2a; RNA stability; memory.
© 2019 The Authors. Published under the terms of the CC BY 4.0 license.
Conflict of interest statement
The authors declare that they have no conflict of interest.
Figures

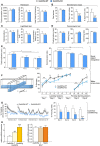
No genotype differences were found in the holeboard test in terms of locomotion (total ambulation). Similarly, general exploration (% of internal ambulation and head dipping frequency) was equal between genotypes. Values shown are mean ± SEM; unpaired t‐test.
The elevated plus‐maze showed no significant differences in terms of locomotion (total entries), but a tendency toward increased anxiety (reduced % of open arm entries and time) in Gadd45a‐KO mice. Values shown are mean ± SEM; unpaired t‐test.
The light/dark test corroborated the absence of significant genotype differences in anxiety‐like behavior, measuring transitions between compartments, time in lit compartment, and latency to first visit the lit compartment. Values shown are mean ± SEM; unpaired t‐test.
Differences in depressive‐like behavior (characterized by a decrease in swimming and increase in floating) were not found between genotypes. Values shown are mean ± SEM; unpaired t‐test.
Gadd45a‐KO mice displayed normal recognition learning. Discrimination index (right panel) was significantly reduced in both genotypes during the retrieval sessions (1 and 24 h after object exposure), indicating the recognition of the familiar object. Total exploration (left) of both objects was reduced as a result of task habituation. Values shown are mean ± SEM; two‐way ANOVA and Bonferroni post hoc test: *P < 0.05, **P < 0.01.
Gadd45a‐KO mice showed a reduced spatial navigation capability. Schematic representation of the water cross‐maze setup (left panel). Learning curves of Gadd45a‐WT and Gadd45a‐KO mice (right panel) were similar during the acquisition phase (sessions 1 and 2), but differed significantly during the consolidation phase (sessions 2–3, and sessions 4–5). Values shown are mean ± SEM; Bonferroni post hoc test showing significant differences between sessions in both genotypes: ## P < 0.01 or t‐test showing significant differences between genotypes for the sessions indicated: *P < 0.05, **P < 0.01.
Gadd45a‐KO mice showed a decreased amygdala‐dependent fear memory. Left panel shows % of freezing of Gadd45a‐WT and their Gadd45a‐KO littermates during the 200‐s tone presented in the extinction sessions plotted in 20‐s time bins. Total percentage of freezing for each extinction session is depicted on the right panel. Note that the absence of Gadd45α leads to a consistent reduction in memory retention. Values shown are mean ± SEM; two‐way ANOVA and Bonferroni post hoc test: *P < 0.05, **P < 0.01, ***P < 0.001.
mRNA levels of Gadd45 gene family and memory‐related genes in hippocampal wild‐type tissue (n = 6) measured by qPCR. Compared to Gadd45a, Gadd45b (t 10 = 3.521) and Gadd45g (t 10 = 4.601) showed significantly increased mRNA levels. Gadd45a mRNA levels are similar to other memory‐related genes such as Bdnf and Reelin. Values shown are mean ± SEM; one‐way ANOVA and unpaired t‐test: **P < 0.01, ***P < 0.001.

Experimental apparatus of the passive avoidance (PA) test to assess context‐dependent associative learning. In this paradigm, the animal receives a foot shock immediately after entering the dark compartment. This leads to hippocampal‐dependent aversive learning, which can be assessed by the latency of subjects to enter the dark compartment in subsequent phases of the experiment.
Latency to enter dark compartment for Gadd45a‐WT (white bars, n = 11) and Gadd45a‐KO (blue bars, n = 11). A significant reduction was found in the Gadd45a‐KO at 24 h and 7 days after the training. Values shown are mean ± SEM; two‐way ANOVA and Bonferroni post hoc test: *P < 0.05.
In situ hybridization to detect Gadd45a mRNA in adult wild‐type hippocampus (n = 8 animals; antisense, left panel; sense, middle panel) and in Gadd45a‐KO sections (n = 6 animals; right panel). Scale bars: 500 μm (black bar).
Experience‐dependent changes in mRNA levels were evaluated under control conditions (home cage) and exposed to the PA (context and context + shock groups; n = 6 for all groups), respectively. Hippocampal Gadd45a mRNA levels remained unchanged, while Gadd45b was induced (context: t 10 = 2.427, context + shock: t 10 = 2.319). Concomitantly, mRNA levels of activity‐regulated cytoskeleton protein (Arc), as a proxy of neuronal activation, were increased in mice exposed to the PA context (t 10 = 3.406) and context + shock (t 10 = 3.141). Values shown are mean ± SEM; one‐way ANOVA and unpaired t‐test: *P < 0.05, ***P < 0.001.

Diagram of the virally mediated approach to induce Gadd45a overexpression in hippocampal glutamatergic neurons of Nex‐Cre (+/−) mice.
Gadd45a mRNA level in the hippocampus of Gadd45a‐overexpressing mice (red, n = 7) was significantly increased (t 10 = 4.189) as compared to Gadd45a‐WT (n = 5). Values shown are mean ± SEM; unpaired t‐test: **P < 0.01.
Immunohistochemistry for hemagglutinin (HA, fused to Gadd45α) in Gadd45a‐WT (Nex‐Cre (−/−), n = 5) and Gadd45a‐overexpressing hippocampi (Nex‐Cre (+/−), n = 5) 8 weeks after AAV injection. Note that the Gadd45α‐HA signal in Gadd45a‐overexpressing mice is predominantly found not only in the stratum pyramidale (sp) but also in the stratum oriens and stratum radiatum (so and sr, respectively). Scale bar: 250 μm.
Cellular distribution of Gadd45α was analyzed by HA‐Western blot on nuclear and cytoplasmic protein fractions of Gadd45a‐WT‐ and Gadd45a‐overexpressing mice (n = 2 for both groups). HA was found predominantly in the nuclear fraction of Gadd45a‐overexpressing hippocampi, with a smaller but recognizable expression also in the cytoplasm.
Latency to enter the dark compartment for Gadd45a‐WT (white bars, n = 10) and Gadd45a‐overexpressing mice (red bars, n = 12) in the PA test. A significant increase was found 24 h and 7 days after the PA training in the Gadd45a‐overexpression group. Values shown are mean ± SEM; two‐way ANOVA and Bonferroni post hoc test: *P < 0.05.

Gadd45a‐overexpressing mice (n = 12) have an increased spatial navigation based on a constantly higher % of accuracy to locate the platform during the water cross‐maze, as compared to their Gadd45a‐WT littermates (n = 10). Values shown are mean ± SEM; Bonferroni post hoc test showing significant differences between sessions in Gadd45a‐overexpressing mice: ### P < 0.001 or t‐test showing significant differences between genotypes for the sessions indicated: *P < 0.05.
Minimum intensity at which mouse reacted to a foot shock (left panel) and latency to the first sign of discomfort in the hot plate test (right panel) were not significantly different between Gadd45a‐WT (n = 11, open bars) and Gadd45a‐KO mice (n = 11, blue bars). Values shown are mean ± SEM; unpaired t‐test.
Gadd45a‐overexpressing mice (n = 12, red bars) showed very similar pain thresholds in foot shock and hot plate tests as compared to their Gadd45a‐WT littermates (n = 10, open bars). Values shown are mean ± SEM; unpaired t‐test.

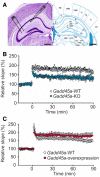
Nissl‐stained slice (left) and corresponding section from brain atlas (right). Left panel shows hippocampus and position of the stimulating (left) and recording (right) electrode. Scale bars: 500 μm (black bar).
LTP protocol was applied to 16 slices of Gadd45a‐WT mice (white dots, n = 5 animals) and 11 slices of Gadd45a‐KO mice (blue dots, n = 5 animals), resulting in a significantly (P < 0.05, Student's t‐test) lowered induction of LTP in Gadd45a‐KO mice as compared with Gadd45a‐WT. Values shown are mean ± SEM.
Gadd45a‐overexpressing mice (red dots, n = 8 slices from 6 animals) presented a slightly increased LTP as compared with Gadd45a‐WT (white dots, n = 10 slices from 6 animals), which became more pronounced during the late phase of the experiment. Values shown are mean ± SEM.

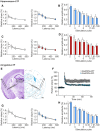
Paired‐pulse ratio before (triangles) and after (circles) LTP induction in hippocampi from Gadd45a‐WT (white symbols, n = 14) and Gadd45a‐KO (blue symbols, n = 11) at different stimulation intervals. Note that LTP did not change the paired‐pulse ratio, indicating that LTP was predominantly mediated by post‐synaptic mechanisms. Values shown are mean ± SEM.
Synaptic fatigue during the first stimulus train was similar in both genotypes, demonstrating that differences in LTP were not caused by differences in synaptic responsiveness to stimulation (n = 13 for Gadd45a‐WT, n = 11 for Gadd45a‐KO). Values shown are mean ± SEM.
The paired‐pulse ratio (before LTP induction: triangles, after LTP induction: circles) did not differ between Gadd45a‐overexpressing mice (red symbols, n = 11) and their corresponding Gadd45a‐WT littermates (white symbols, n = 10). Values shown are mean ± SEM.
Synaptic fatigue during the first stimulus train was similar in both genotypes, demonstrating that differences in LTP were not caused by differences in synaptic responsiveness to stimulation (n = 7 for Gadd45a‐WT, n = 10 for Gadd45a‐overexpression). Values shown are mean ± SEM.
Localization of the stimulating (cortical inputs of the amygdala) and recording (lateral nucleus of the amygdala) electrodes for LTP experiments in the amygdala. Scale bars: 500 μm (black bar).
Slope of field potential responses in the lateral nucleus of the amygdala from Gadd45a‐WT (n = 11 slices) and Gadd45a‐KO mice (n = 8 slices) during LTP induction. Note stable expression of LTP in both genotypes but significantly (P < 0.05, Student's t‐test) decreased LTP in Gadd45a‐KO. Values shown are mean ± SEM.
As in the hippocampus, paired‐pulse ratio before (triangle) and after (circles) LTP induction did not differ between Gadd45a‐WT (white symbols, n = 11) and Gadd45a‐KO mice (blue symbols, n = 8). Values shown are mean ± SEM.
Synaptic fatigue was not different in Gadd45a‐overexpressing mice (blue bars) and controls (white bars), indicating that differences in LTP were not caused by differences in synaptic responsiveness to stimulation. Values shown are mean ± SEM.

- A
MA plot of DESeq differential expression analysis with the 1% false discovery rate (FDR) hits in red (5/402 and with > 2‐fold change 1/65 up‐/down‐regulated, respectively). The affected genes are described in Dataset EV1.
- B
Gene ontology (GO) enrichment analysis of the 402 down‐regulated genes revealed gene classes related to memory formation and synaptic function. For a complete analysis of gene ontology, see Dataset EV2.
- C
Proportion of transcripts with extended 3′UTRs (at least 2 kb beyond the canonical polyadenylation site) among the top 100 Gadd45α hits.
- D
UCSC browser view of reads‐per‐million‐normalized RNA‐seq coverage for Grin2a in Gadd45a‐WT (black) and Gadd45a‐KO (blue) representative samples. Gene structure of Grin2a (colored in purple) and the direction of transcription (red arrow) are depicted. Upper panel covers the entire transcript while lower panel is an enlargement of exons 4–8.
- E
Detailed view of the extended 3′UTR of Grin2a showing a significant 5′<3′ gradient in RNA‐seq coverage. Note that the normalized read coverage is similar between genotypes at the actual 3′UTR end but differs significantly upstream including the annotated exons. For subsequent experiments, position of the designed primers covering proximal and distal parts of the 3′UTR is indicated below.
- F, G
Validation of Gadd45α‐regulated levels of Grin2a mRNA by qPCR with primers covering exons 3–4. Grin2a mRNA levels were analyzed in the hippocampus of mice under control conditions (white bars: Gadd45a‐WT = 7 and Gadd45a‐KO = 7) and 1 h after PA (Gadd45a‐WT = 5, black bars; Gadd45a‐KO = 6, blue bars). Random‐primed cDNA levels (F) were very similar in all the experimental groups. Oligo(dT)‐primed cDNA (G) revealed a significant increase in Grin2a 1 h after PA, which was only observed in Gadd45a‐WT mice. Values shown are mean ± SEM; two‐way ANOVA and Bonferroni post hoc test: **P < 0.01, ***P < 0.001.
- H, I
mRNA levels of proximal versus distal parts of the 3′UTR analyzed in the same set of oligo(dT)‐primed cDNA. (H) Significant increase in Grin2a mRNA levels was found for the proximal part only in Gadd45a‐WT. (I) Distal parts of the 3′UTR remained unchanged (n = 6 for all groups). Values shown are mean ± SEM; two‐way ANOVA and Bonferroni post hoc test: *P < 0.05.

- A, B
Read coverage profiles (y‐axis = reads per million reads) of representative Gadd45a‐WT (black) and Gadd45a‐KO (blue) samples for Map2K6 (A), and a detailed view of its 3′UTR (B). Note that Map2K6 contains an extended 3′UTR, but is not under Gadd45α‐dependent regulation of 3′UTR stability. Additionally, the absence of a 5′<3′ gradient despite the presence of a long unannotated 3′UTR suggests gene specificity in the action of Gadd45α.
- C
Normalized RNA‐seq read coverage of the annotated exons and introns of the indicated genes. Note that while exonic coverage is strongly reduced in Gadd45a‐KO mice, intronic coverage is not or is only mildly affected (for Grm5), indicating that Gadd45α mediates post‐transcriptional, rather than transcriptional regulation (n = 6 for all groups). Values shown are mean ± SEM; Student's t‐test: **P < 0.01.
- D
Pre‐mRNA analysis of Grin2a (upper panel) and Grm5 (lower panel) by intronic qPCR of Gadd45a‐WT (control: no PA, n = 6; PA + 1 h, n = 6) and Gadd45a‐KO hippocampal samples (control: no PA, n = 6; PA + 1 h, n = 6). Note that pre‐mRNA levels for both transcripts are very similar in all experimental groups, corroborating the absence of transcriptional effects. Values shown are mean ± SEM; two‐way ANOVA and Bonferroni post hoc test.
- E
qPCR analysis of Grin2a (left) and Grm5 (right) mRNA levels of Gadd45a‐WT (control: no PA, n = 6; PA + 1 h, n = 6) and Gadd45a‐overexpressing mice (control: no PA, n = 6; PA + 1 h, n = 6). Note that when using random‐primed cDNA, a significant increase only appeared for Grm5 (genotype effect, F 1,20 = 6.637). Values shown are mean ± SEM; two‐way ANOVA and Bonferroni post hoc test: *P < 0.05.
- F
Same qPCR analysis as in (E) but using oligo(dT)‐primed cDNA. Note in this case, significant differences appeared for both Grin2a (genotype effect, F 1,20 = 5.031) and Grm5 (genotype effect, F 1,20 = 12.94). Values shown are mean ± SEM; two‐way ANOVA and Bonferroni post hoc test: *P < 0.05, **P < 0.01.

- A
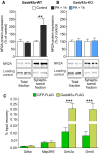
Representative Western blot analysis showing two wild‐type C57BL/6N hippocampal total and synaptosomal protein fractions, respectively. Proteins known to be expressed in membranes of synaptosomes (NR2A, PSD95, synaptotagmin) were enriched in synaptosomal fraction as compared to total fraction. Tubulin (55 kDa) and synaptotagmin (68 kDa) served as loading controls for the total and synaptosomal fractions, respectively.
- B, C
mGluR5 protein levels (150 kDa) were increased in synaptosomal fractions of Gadd45a‐WT hippocampi (B) 1 h after PA exposure (t 19 = 3.121). (C) In Gadd45a‐KO, mGluR5 levels were not altered during memory formation. The number of samples analyzed is the same as in Fig 5A and B. In control groups, 27 samples were analyzed (Gadd45a‐WT, n = 13; Gadd45a‐KO, n = 14), and in PA‐exposed groups, 28 samples were analyzed (Gadd45a‐WT = 14, Gadd45a‐KO = 14). Values shown are mean ± SEM; two‐way ANOVA and Bonferroni post hoc test: **P < 0.01.
- D
mRNA levels of Grin2a (left panel) and Grm5 (right panel) in synaptosomal fractions of Gadd45a‐WT (control, n = 6; PA + 1 h, n = 6) and Gadd45a‐KO (control, n = 6; PA + 1 h, n = 6) hippocampal samples. Note that mRNA levels of both transcripts were significantly decreased in Gadd45a‐KO samples (Grin2a, F 1,20 = 13.55; Grm5, F 1,20 = 23.9) under both control and PA + 1 h conditions. Values shown are mean ± SEM; two‐way ANOVA and Bonferroni post hoc test: **P < 0.01, ***P < 0.001.
- E
Sequence homology between mouse and human Gadd45α protein shows 94.5% identity with nine residue mismatches (yellow).
- F
Coomassie gel of purified Gadd45α‐FLAG and GFP‐FLAG, and increasing concentrations of BSA, which served as reference to estimate the amount of purified Gadd45α‐FLAG and GFP‐FLAG used for the pulldown experiments.
- G
Percentage of input recovery was significantly enhanced in the Gadd45α‐FLAG‐bound fraction (light green bars) for Grin2b (t 22 = 4.992) and Kcnq3 (t 22 = 3.267) mRNA as compared to GFP‐FLAG‐bound fraction (dark green bars) (n = 12 for all groups). Values shown are mean ± SEM; two‐way ANOVA and Bonferroni post hoc test: ***P < 0.001.

- A, B
NR2A protein levels were analyzed in the hippocampus of mice under control conditions (white bars: Gadd45a‐WT, n = 13; Gadd45a‐KO, n = 14) and 1 h after PA (black bars: Gadd45a‐WT = 14, Gadd45a‐KO = 14). NR2A signal (160 kDa) was normalized to the loading control (tubulin (55 kDa) for the total fraction and synaptotagmin (68 kDa) for the synaptosomal fraction) and calculated as percentage of control. In Gadd45a‐WT samples (A), NR2A protein levels were unchanged in the total fraction during memory formation, while in the synaptosomal fraction, a significant increase was detected (t 20 = 3.199). In Gadd45a‐KO hippocampi (B), levels of NR2A protein in both fractions remained unaltered during memory consolidation. Values shown are mean ± SEM; two‐way ANOVA and Bonferroni post hoc test: **P < 0.01.
- C
Gadd45α pulldown experiments were carried out in wild‐type hippocampal lysates (n = 12 for all groups). Percentage of input recovery was unchanged between GFP‐FLAG (green bars) and Gadd45α‐FLAG (black bars) for genes that are not regulated by Gadd45α, such as succinate dehydrogenase complex flavoprotein subunit A (Sdha, no 3′UTR extension), and mitogen‐activated protein kinase 6 (Map2K6, containing 3′UTR extension of 10 kb). On the contrary, Gadd45α‐FLAG‐bound fraction revealed a significant increase in Grin2a (t 22 = 4.992) and Grm5 mRNA (t 22 = 4.939) as compared to GFP‐FLAG fraction. Values shown are mean ± SEM; two‐way ANOVA and Bonferroni post hoc test: ***P < 0.001.

Diagram of the virally mediated approach to induce Gadd45a‐overexpression in hippocampal glutamatergic neurons of Nex‐Cre (+/−) mice. On the one hand, Nex‐Cre (−/−) (n = 12) and Nex‐Cre (+/−) (n = 11) were injected with the AAV‐Gadd45a‐HA used in Fig 2. On the other hand, a group of Nex‐Cre (+/−) (n = 11) was injected with a mutated form of Gadd45α (K45E) that lacks the RNA‐binding capacity.
Hippocampal Gadd45a mRNA levels were significantly up‐regulated in both Gadd45a‐overexpression (q24 = 4.094) and Gadd45a K45E‐overexpression groups (q24 = 4.726) (n = 9 for all groups). Values shown are mean ± SEM; Tukey's multiple comparison test: *P < 0.05, **P < 0.01.
Gadd45α overexpression was confirmed at the protein level by HA‐Western blot on hippocampal samples from Gadd45a‐WT, Gadd45a‐overexpression, and Gadd45a K45E‐overexpression mice (n = 3 for all groups).
Immunohistochemistry for hemagglutinin (HA, fused to Gadd45α) in Gadd45a‐WT (left), Gadd45a‐overexpression (middle) and Gadd45a K45E‐overexpression (right) samples 8 weeks after AAV injection (n = 3 for all groups). Upper row depicts the entire hippocampus, while center and lower rows show magnifications of the CA3 area in which the HA signal (red) is not restricted to the nuclei (blue and white). Hippocampus scale bars: 250 μm. Hilus scale bars: 50 μm.
Latency to enter the dark compartment for Gadd45a‐WT (white bars, n = 12), Gadd45a‐overexpression (red bars, n = 11), and Gadd45a K45E‐overexpression mice (gray bars, n = 11) in the PA test. Note that, unlike Gadd45a‐overexpression mice, those expressing the mutated form of Gadd45α (no RNA‐binding capacity) did not show an increase in memory retention. Values shown are mean ± SEM; two‐way ANOVA and Bonferroni post hoc test: *P < 0.05, ***P < 0.001.
References
-
- Fukuchi M, Tsuda M (2010) Involvement of the 3′‐untranslated region of the brain‐derived neurotrophic factor gene in activity‐dependent mRNA stabilization. J Neurochem 115: 1222–1233 - PubMed
-
- Takekawa M, Saito H (1998) A family of stress‐inducible GADD45‐like proteins mediate activation of the stress‐responsive MTK1/MEKK4 MAPKKK. Cell 95: 521–530 - PubMed
Publication types
MeSH terms
Substances
LinkOut - more resources
Full Text Sources
Medical
Molecular Biology Databases
Miscellaneous

