

Analysis of 1508 Plasma Samples by Capillary-Flow Data-Independent Acquisition Profiles Proteomics of Weight Loss and Maintenance
- PMID: 30948622
- PMCID: PMC6553938
- DOI: 10.1074/mcp.RA118.001288
Analysis of 1508 Plasma Samples by Capillary-Flow Data-Independent Acquisition Profiles Proteomics of Weight Loss and Maintenance
Abstract
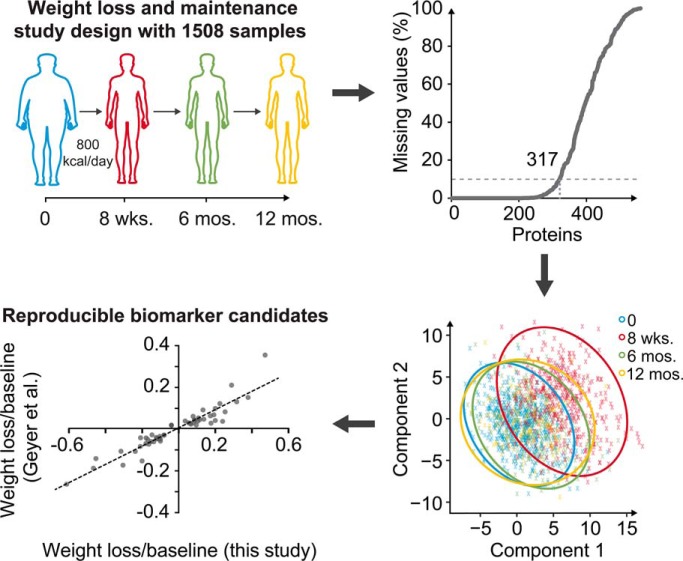
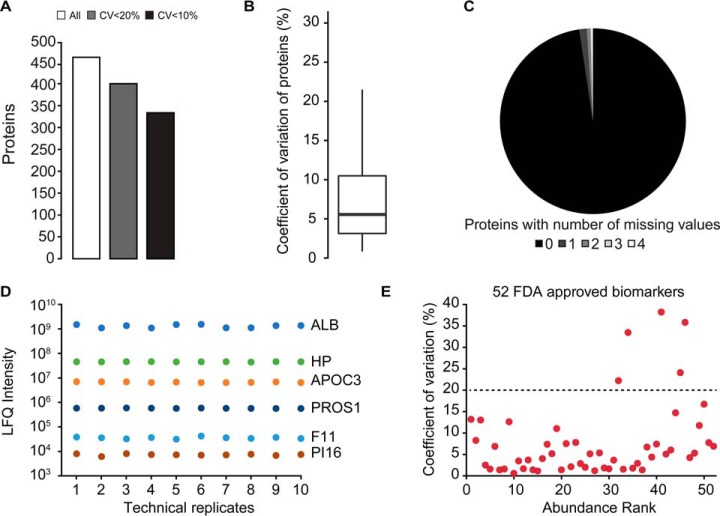
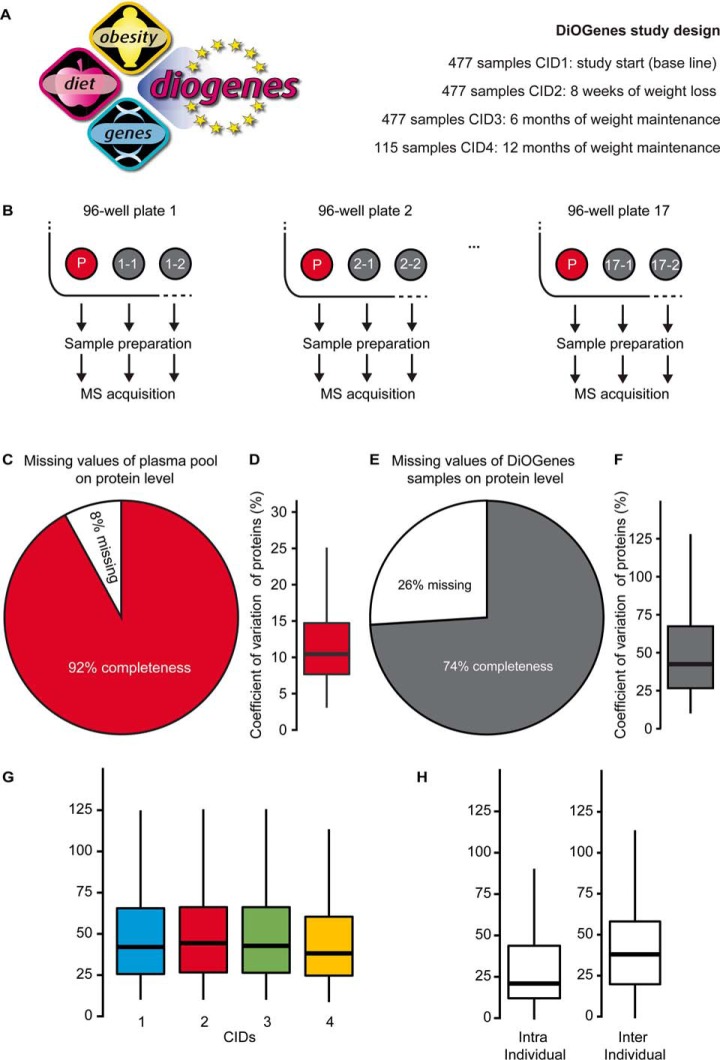
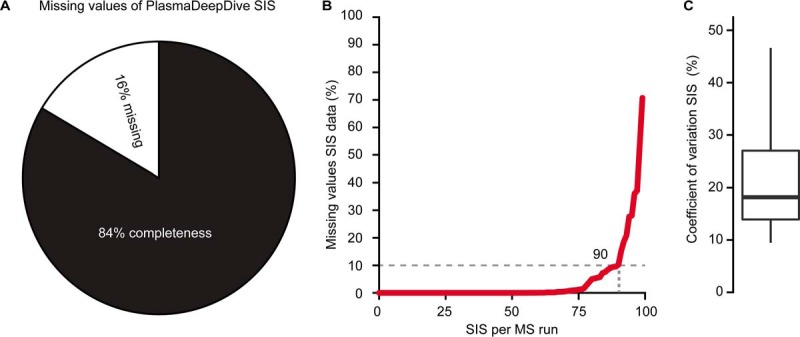
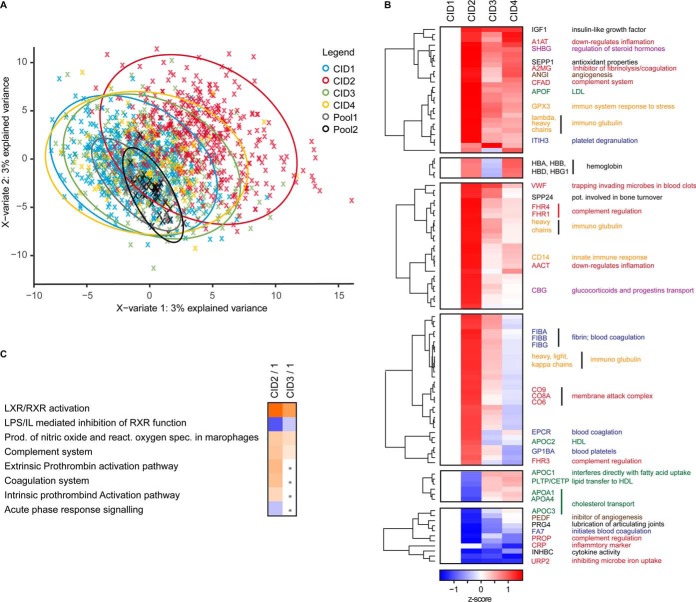
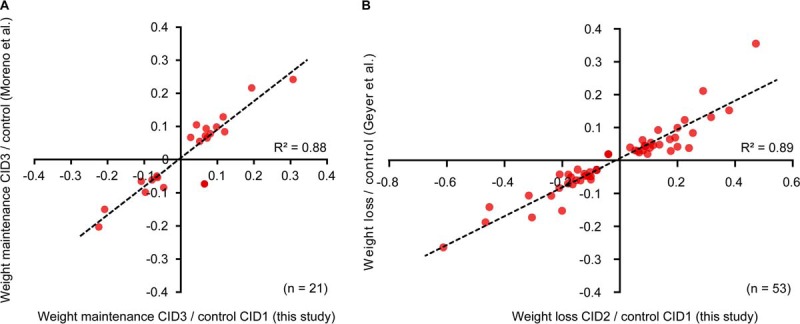
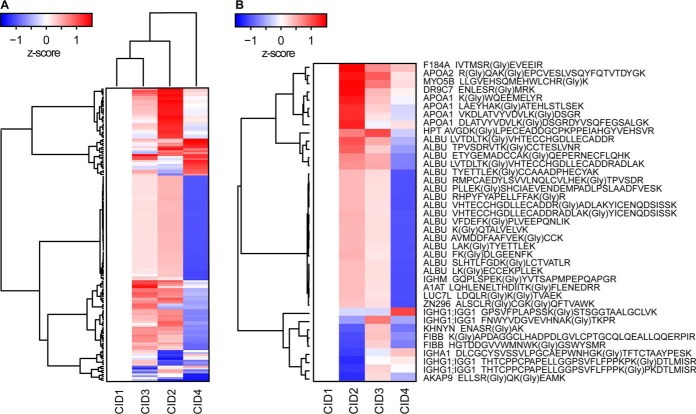
Comprehensive, high throughput analysis of the plasma proteome has the potential to enable holistic analysis of the health state of an individual. Based on our own experience and the evaluation of recent large-scale plasma mass spectrometry (MS) based proteomic studies, we identified two outstanding challenges: slow and delicate nano-flow liquid chromatography (LC) and irreproducibility of identification of data-dependent acquisition (DDA). We determined an optimal solution reducing these limitations with robust capillary-flow data-independent acquisition (DIA) MS. This platform can measure 31 plasma proteomes per day. Using this setup, we acquired a large-scale plasma study of the diet, obesity and genes dietary (DiOGenes) comprising 1508 samples. Proving the robustness, the complete acquisition was achieved on a single analytical column. Totally, 565 proteins (459 identified with two or more peptide sequences) were profiled with 74% data set completeness. On average 408 proteins (5246 peptides) were identified per acquisition (319 proteins in 90% of all acquisitions). The workflow reproducibility was assessed using 34 quality control pools acquired at regular intervals, resulting in 92% data set completeness with CVs for protein measurements of 10.9%.The profiles of 20 apolipoproteins could be profiled revealing distinct changes. The weight loss and weight maintenance resulted in sustained effects on low-grade inflammation, as well as steroid hormone and lipid metabolism, indicating beneficial effects. Comparison to other large-scale plasma weight loss studies demonstrated high robustness and quality of biomarker candidates identified. Tracking of nonenzymatic glycation indicated a delayed, slight reduction of glycation in the weight maintenance phase. Using stable-isotope-references, we could directly and absolutely quantify 60 proteins in the DIA.In conclusion, we present herein the first large-scale plasma DIA study and one of the largest clinical research proteomic studies to date. Application of this fast and robust workflow has great potential to advance biomarker discovery in plasma.
Keywords: Absolute quantification; Clinical proteomics; Label-free quantification; Plasma or serum analysis; SWATH-MS; data-independent acquisition; high throughput; single shot; stable isotope standards.
© 2019 Bruderer et al.
Conflict of interest statement
Competing financial interests: The authors R.B., J.M. S.M., T.G., O.M.B., O.R. and L.R. are full-time employees of Biognosys AG (Zurich, Switzerland). Spectronaut is a trademark of Biognosys AG., O.C., C.M., J.C., J.H., A.V., and L.D. are full-time employees at the Nestlé Institute of Health Sciences., W.H.S. has received research support from several food companies such as Nestlé, DSM, Unilever, Nutrition et Santé and Danone as well as pharmaceutical companies such as Novartis, GSK and Novo Nordisk. He is an unpaid scientific advisor for the International Life Science Institute, ILSI Europe., A.A. has received grants from Arla Foods, DK, Danish Dairy Research Council, Nordea Foundation, DK and McCain Foods, as well as personal fees from McCain Foods, McDonald's, Basic Research, Nestlé, Lausanne Dutch Beer Knowledge Institute, NL, Gelesis, Novo Nordisk, DK, S-Biotek, DK, all outside the submitted work; and Royalties received for the book first published in Danish as “Verdens Bedste Kur” (Politiken, Copenhagen) and subsequently published in Dutch as “Het beste dieet ter wereld” (Kosmos Uitgevers, Utrecht/Antwerpen), and in English as “World's Best Diet” (Penguin, Australia)
Figures
References
-
- Sylvia M. S., and Michael W. (2015) Human Biology, 14 edition. McGraw-Hill Education, New York, NY
-
- Schwenk J. M., Omenn G. S., Sun Z., Campbell D. S., Baker M. S., Overall C. M., Aebersold R., Moritz R. L., and Deutsch E. W. (2017) The Human Plasma Proteome Draft of 2017: Building on the Human Plasma PeptideAtlas from Mass Spectrometry and Complementary Assays. J. Proteome Res. 16, 4299–4310 - PMC - PubMed
-
- Anderson N. L., Ptolemy A. S., and Rifai N. (2013) The riddle of protein diagnostics: future bleak or bright? Clin. Chem. 59, 194–197 - PubMed
-
- Hernández B., Parnell A., and Pennington S. (2014) Why have so few proteomic biomarkers “survived” validation? (Sample size and independent validation considerations). Proteomics 14, 1587–1592 - PubMed
Publication types
MeSH terms
Substances
LinkOut - more resources
Full Text Sources
Other Literature Sources
Medical
Molecular Biology Databases
