. 2019 Apr 23;116(17):8380-8389.
doi: 10.1073/pnas.1821093116. Epub 2019 Apr 4.

Oncogenic PIK3CA promotes cellular stemness in an allele dose-dependent manner

Affiliations

Oncogenic PIK3CA promotes cellular stemness in an allele dose-dependent manner

Ralitsa R Madsen et al. Proc Natl Acad Sci U S A. .

Abstract

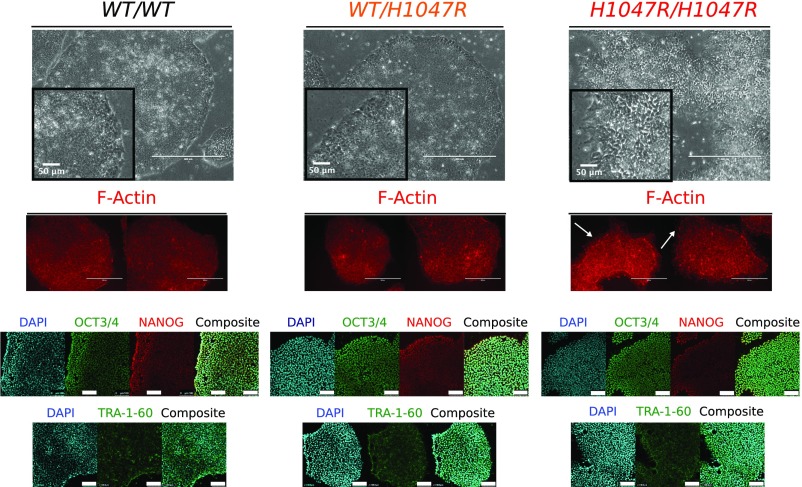
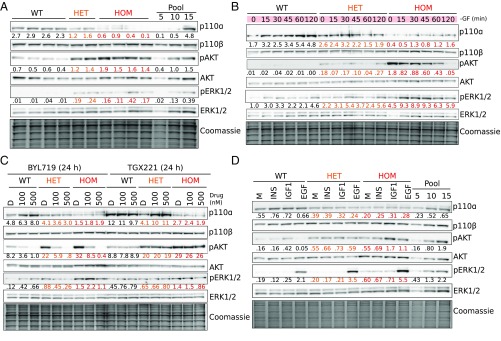
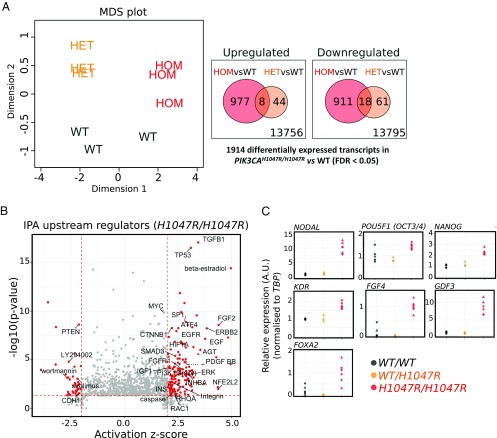
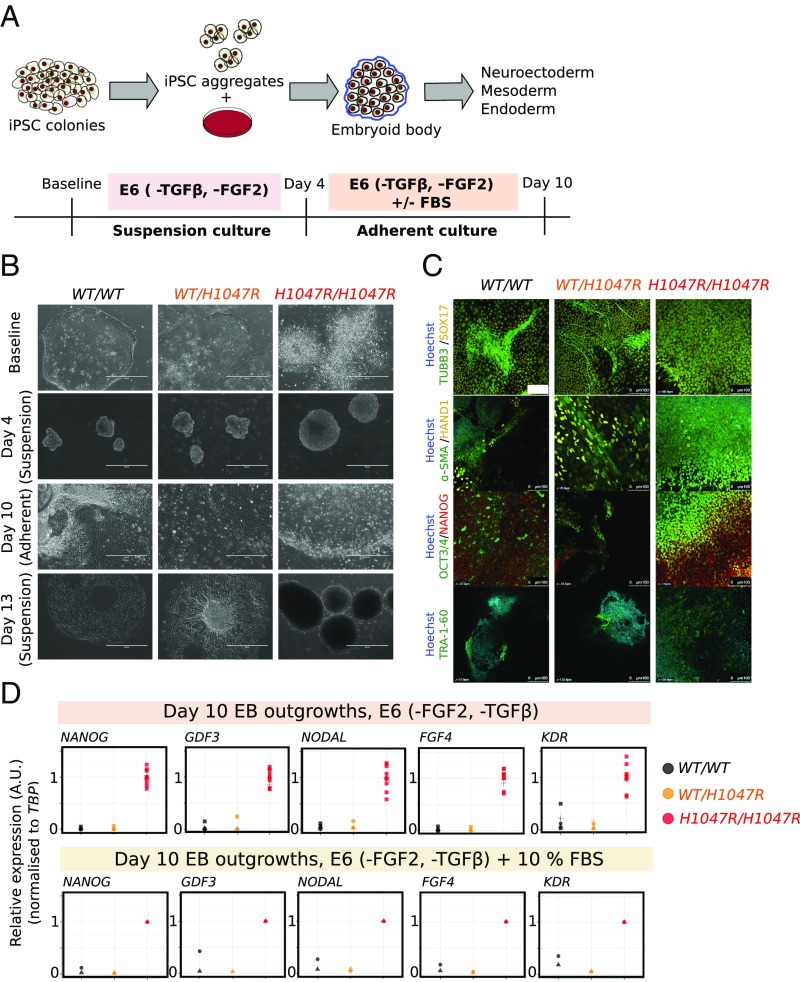
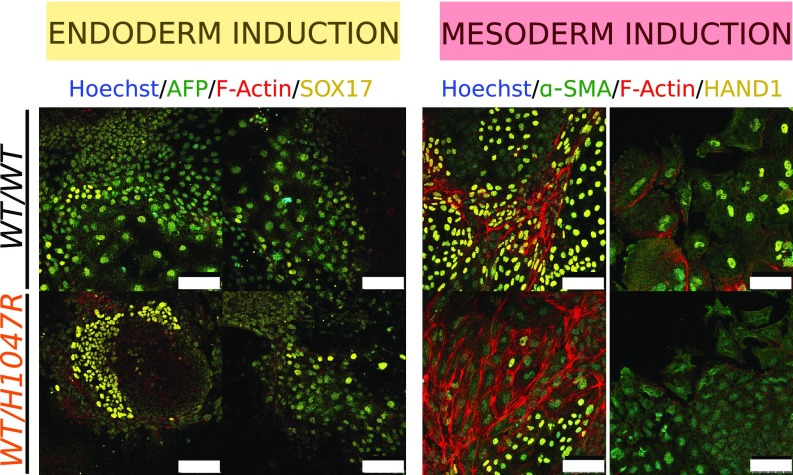
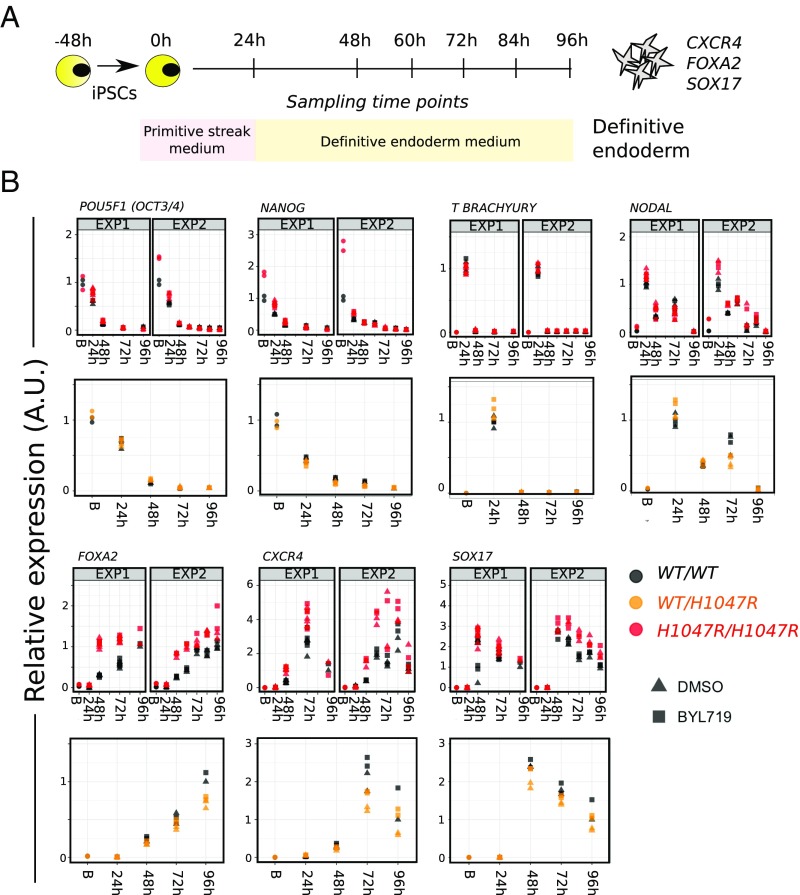
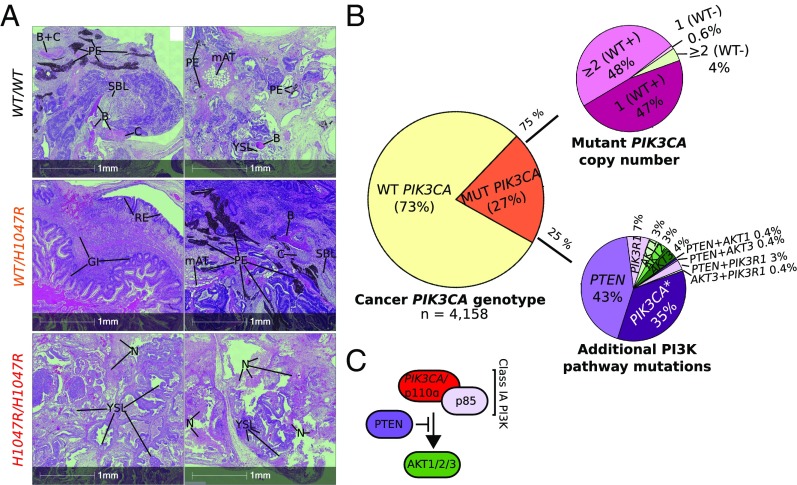
The PIK3CA gene, which encodes the p110α catalytic subunit of PI3 kinase (PI3K), is mutationally activated in cancer and in overgrowth disorders known as PIK3CA-related overgrowth spectrum (PROS). To determine the consequences of genetic PIK3CA activation in a developmental context of relevance to both PROS and cancer, we engineered isogenic human induced pluripotent stem cells (iPSCs) with heterozygous or homozygous knockin of PIK3CAH1047R While heterozygous iPSCs remained largely similar to wild-type cells, homozygosity for PIK3CAH1047R caused widespread, cancer-like transcriptional remodeling, partial loss of epithelial morphology, up-regulation of stemness markers, and impaired differentiation to all three germ layers in vitro and in vivo. Genetic analysis of PIK3CA-associated cancers revealed that 64% had multiple oncogenic PIK3CA copies (39%) or additional PI3K signaling pathway-activating "hits" (25%). This contrasts with the prevailing view that PIK3CA mutations occur heterozygously in cancer. Our findings suggest that a PI3K activity threshold determines pathological consequences of oncogenic PIK3CA activation and provide insight into the specific role of this pathway in human pluripotent stem cells.

Keywords: PI3K; PROS; cancer; genetics; pluripotent stem cells.


Conflict of interest statement

Conflict of interest statement: B.V. is a consultant for Venthera (Palo Alto, CA), iOnctura (Geneva, Switzerland), and Karus Therapeutics (Oxford, United Kingdom). N.M. has received consultancy fees from Achilles Therapeutics.

Figures

Fig. 1.
Fig. 1.
Isogenic hPSCs expressing PIK3CAH1047R from one or both endogenous alleles. Representative light microscopy and immunofluorescence images of stem cell colonies from cultures with the indicated genotypes. F-Actin staining was used to visualize cell shape, and arrows highlight altered edge morphology and F-Actin–rich protrusions in PIK3CAH1047R/H1047R colonies. (Scale bars: 400 µm; Insets, 50 µm.) Light micrograph images are representative of multiple clones from each genotype (4 WT, 3 PIK3CAWT/H1047R, and 10 PIK3CAH1047R/H1047R). The confocal images are of WT and mutant cells stained with antibodies against OCT3/4, NANOG, and TRA-1-60. Images are representative of at least two independent experiments and clones per genotype. (Scale bar: 100 µm.) See also SI Appendix, Fig. S1.
Fig. 2.
Fig. 2.
Graded activation of PI3K signaling in PIK3CAH1047R hPSCs. Immunoblots are shown for p110α and p110β catalytic subunits of PI3K, and for total and phosphorylated AKT (S473) and ERK1/2 (T202/Y204; T185/Y187), with Coomassie-stained gels after transfer as loading control. Numbers below bands indicate quantification by densitometry (arbitrary units). (A) Signaling in cells collected 3 h after replenishment of growth factor (GF)-replete medium. Representative of at least three independent experiments. (B) Signaling time course during short-term GF depletion. Representative of at least two independent experiments. (C) Effects of 24 h of specific p110α or p110β inhibition in GF-replete medium using BYL719 or TGX221, respectively. DMSO (D) was used as control. Representative of two independent experiments. (D) Response of cells to 2 h of GF depletion followed by 20-min stimulation with 10 nM insulin (INS), insulin-like growth factor 1 (IGF1), or epidermal growth factor (EGF). GF-free DMEM/F12 medium (M) was used as control. The results are representative of two independent experiments. In all cases, independent clones of the same genotypes were used for replicate experiments. Protein pool dilutions are included where possible to assess assay performance (numbers represent micrograms). WT, wild type; HET, PIK3CAWT/H1047R; HOM, PIK3CAH1047R/H1047R. See also SI Appendix, Fig. S2.
Fig. 3.
Fig. 3.
Widespread transcriptional remodeling in PIK3CAH1047R/H1047R pluripotent stem cells. (A, Left) Multidimensional scaling (MDS) plot of transcriptomes of wild-type (WT), PIK3CAWT/H1047R (HET), and PIK3CAH1047R/H1047R (HOM) hPSCs profiled by RNA-seq. (A, Right) Venn diagrams showing overlap of up-regulated and down-regulated transcripts in PIK3CAH1047R mutants compared with WT (FDR < 0.05, Benjamini–Hochberg; three clones per genotype). FC, fold change. (B) Ingenuity pathway analysis (IPA) of upstream regulators in PIK3CAH1047R/H1047R cells, based on all differentially expressed genes. Components with absolute activation z score > 2 and P < 0.05 are highlighted in red. Selected components linked to PI3K signaling and pluripotency are labeled. (C) Assessment of expression of selected epiblast genes by real-time quantitative PCR, based on RNA-seq–specific pathway analyses. Data were obtained in two independent experiments. Expression values were scaled to the WT (WT/WT) or PIK3CAH1047R/H1047R (H1047R/H1047R) mean as indicated. Individual points correspond to separate cultures: five WT (three clones), three PIK3CAWT/H1047R (two clones), and six PIK3CAH1047R/H1047R (four clones). All clones used for confirmation were distinct from those used to generate RNA-seq data. See also SI Appendix, Figs. S3 and S4.
Fig. 4.
Fig. 4.
Self-sustained stemness in PIK3CAH1047R/H1047R embryoid bodies (EBs). (A) Schematic illustrating the protocol used for EB formation and subsequent adherent culture. E6, Essential 6 medium; FGF2, fibroblast growth factor 2; TGFβ, transforming growth factor β. (B) Representative bright-field micrographs of WT (WT/WT), PIK3CAWT/H1047R (WT/H1047R), and PIK3CAH1047R/H1047R (H1047R/H1047R) cells at baseline (iPSC stage), 4 d (suspension), 10 d (adherent), and 13 d (suspension) following EB formation. PIK3CAH1047R/H1047R iPSC colonies are refractile due to partial dissociation, while stem cell-like colonies emerging from adherent PIK3CAH1047R/H1047R EBs are highly compact. In addition to the floating layers of differentiated cells shown here, WT and PIK3CAWT/H1047R suspension cultures on day 13 also contained larger EB aggregates with complex morphologies and internal differentiation. (Scale bar: 400 μm.) (C) EB outgrowths were fixed on day 10 and stained for TRA-1-60 or costained for TUBB3/SOX17, α-SMA/HAND1 or NANOG/OCT3/4. Hoechst was used for nuclear visualization. Images are representative of two independent experiments, using a single WT clone and two clones of each mutant. (Scale bar: 100 µm.) (D) Real-time quantitative PCR analysis of stemness gene expression in EB outgrowths in E6 medium without TGFβ and FGF2. Individual replicates shown in the panel are from three to four WT clones, two PIK3CAWT/H1047R clones, and four PIK3CAH1047R/H1047R clones (including technical duplicates of the PIK3CAH1047R/H1047R outgrowth cultures). Expression values are in arbitrary units (A.U.). See also SI Appendix, Fig. S5.
Fig. 5.
Fig. 5.
Heterozygosity for PIK3CAH1047R does not affect endoderm or mesoderm differentiation in EBs. Representative confocal images of WT (WT/WT) and PIK3CAWT/H1047R (WT/H1047R) outgrowths on day 10 of the differentiation protocol, stained with antibodies against endoderm (AFP/SOX17) and mesoderm (α-SMA/HAND1)-specific markers. Hoechst was used for nuclear visualization and F-Actin for cell boundary demarcation. The images are from one clone per genotype. (Scale bar: 100 μm.) See also SI Appendix, Fig. S6.
Fig. 6.
Fig. 6.
PIK3CAH1047R is compatible with monolayer definitive endoderm differentiation. (A) Schematic of the protocol for definitive endoderm differentiation in monolayer culture. (B) Real-time quantitative PCR analysis of lineage marker expression during differentiation in the presence of DMSO (control) or the p110α-specific inhibitor BYL719 at 100 nM. Data from two independent experiments (EXP) with WT (WT/WT) vs. PIK3CAH1047R/H1047R (H1047R/H1047R) are shown side by side (60- and 84-h time points were only assessed once). Two cultures of each of two clones per genotype were profiled. The time course data for PIK3CAWT/H1047R (WT/H1047R) vs. WT cells are from a single experiment using two cultures of one clone per genotype. Gene expression was scaled internally to the mean value of an appropriate time point, and resulting values are arbitrary. B, baseline (0 h). See also SI Appendix, Fig. S7.
Fig. 7.
Fig. 7.
PIK3CAH1047R allele dose-dependent effects in tumor xenografts and genetic evidence for graded PI3K activation in cancers. (A) Hematoxylin and eosin (H&E)-stained sections of WT (WT/WT), PIK3CAWT/H1047R (WT/H1047R), and PIK3CAH1047R/H1047R (H1047R/H1047R) tumor xenografts derived from injection of hPSCs into immunodeficient mice. The micrographs are from two tumors per genotype and are representative of totals of five, three, and two tumors from WT, PIK3CAWT/H1047R, and PIK3CAH1047R/H1047R iPSCs, respectively. Yolk sac-like (YSL) and embryonal carcinoma-like (ECL) tissues, suggesting neoplastic transformation of cells within the original cultures, were more prevalent in PIK3CAH1047R/H1047R tumors, which also exhibited extensive necrosis (N); rare YSL foci were seen in two other tumors derived from the same WT clone. The only well-differentiated tissue observed in PIK3CAH1047R/H1047R tumors was a focus of immature bone (B) in one. WT and PIK3CAWT/H1047R tumors, in contrast, comprised variable admixtures of well-differentiated and organized tissue derivatives of all three germ layers. GI, gastrointestinal tissue; mAT, mouse adipose tissue (confirmed by independent mouse vs. human immunostaining with Cyclophilin A; SI Appendix, Fig. S8 A and B); PE, pigmented epithelium; RE, respiratory epithelium; SBLs, sebaceous-like tissue. See also SI Appendix, Fig. S8 and Table S1. (B) The Cancer Genome Atlas (TCGA) was used to extract genomic data from PIK3CA-associated cancers. These were analyzed in aggregate for the presence or absence of mutant PIK3CA alleles, followed by stratification of PIK3CA mutant-positive samples based on the presence of multiple mutant alleles, including cases where the WT PIK3CA allele is lost (WT−). Alternatively, PIK3CA mutant-positive samples were screened for multiple distinct PIK3CA mutations (*) or for the presence of additional mutations in proximal PI3K pathway components. (C) Schematic of proximal class IA PI3K signaling of relevance to the analysis in B.

References

    1. Fruman DA, et al. The PI3K pathway in human disease. Cell. 2017;170:605–635. - PMC - PubMed
    1. Manning BD, Toker A. AKT/PKB signaling: Navigating the network. Cell. 2017;169:381–405. - PMC - PubMed
    1. Saxton RA, Sabatini DM. mTOR signaling in growth, metabolism, and disease. Cell. 2017;168:960–976. - PMC - PubMed
    1. Zhang Y, et al. A pan-cancer proteogenomic atlas of PI3K/AKT/mTOR pathway alterations. Cancer Cell. 2017;31:820–832.e3. - PMC - PubMed
    1. Madsen RR, Vanhaesebroeck B, Semple RK. Cancer-associated PIK3CA mutations in overgrowth disorders. Trends Mol Med. 2018;24:856–870. - PMC - PubMed

Publication types

MeSH terms

Substances