. 2019 Apr 5:25:2488-2504.
doi: 10.12659/MSM.915382.

Identification of Key Genes and Circular RNAs in Human Gastric Cancer

Affiliations

Identification of Key Genes and Circular RNAs in Human Gastric Cancer

Shuhong Hao et al. Med Sci Monit. .

Abstract

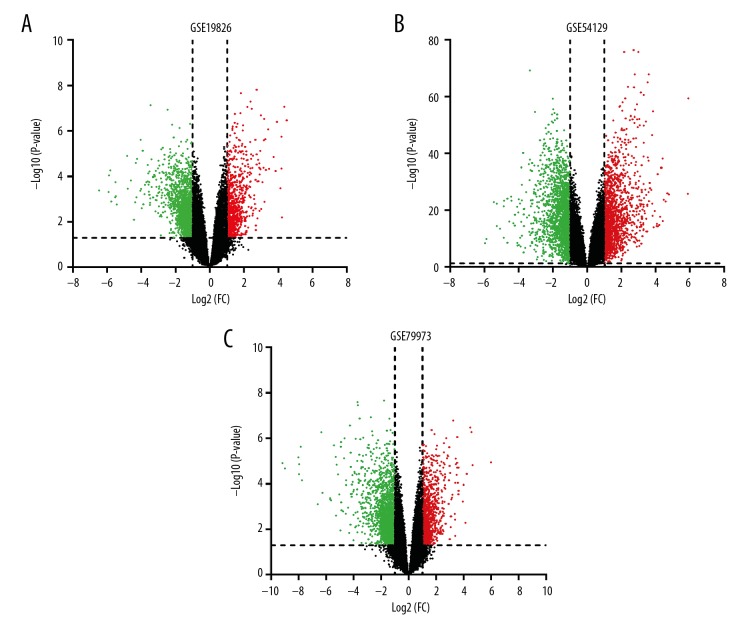
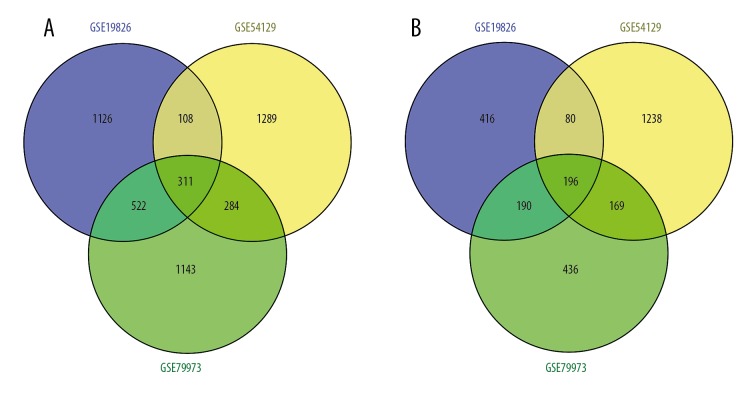
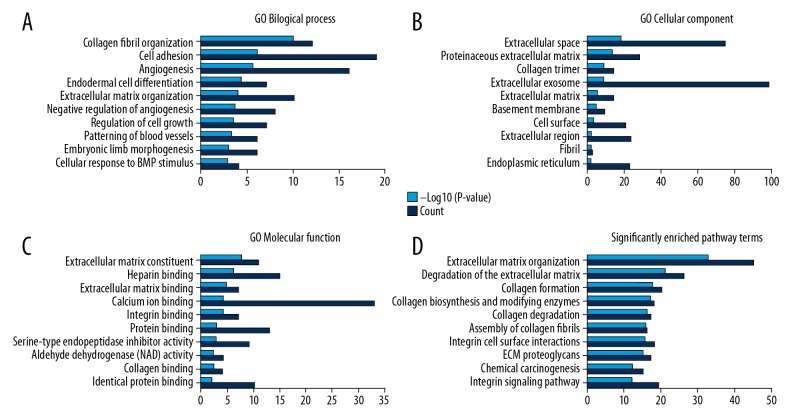
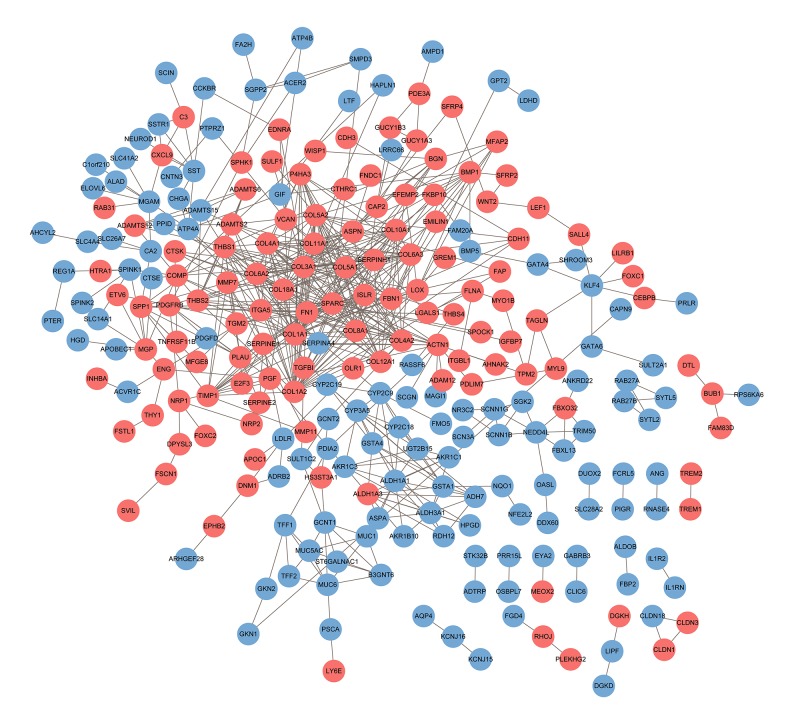
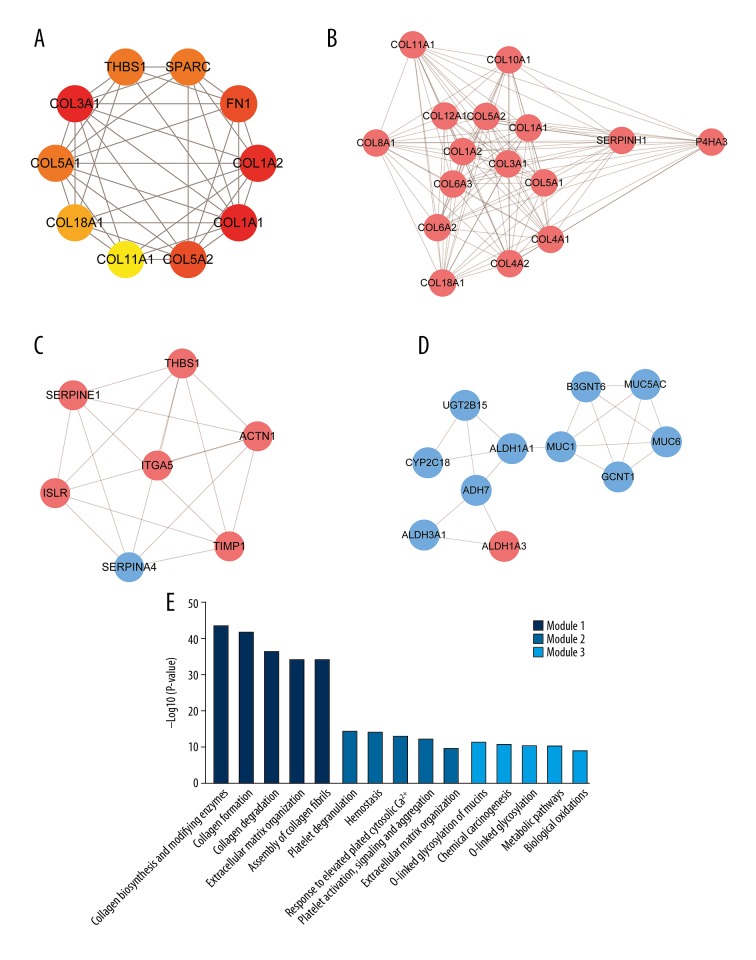
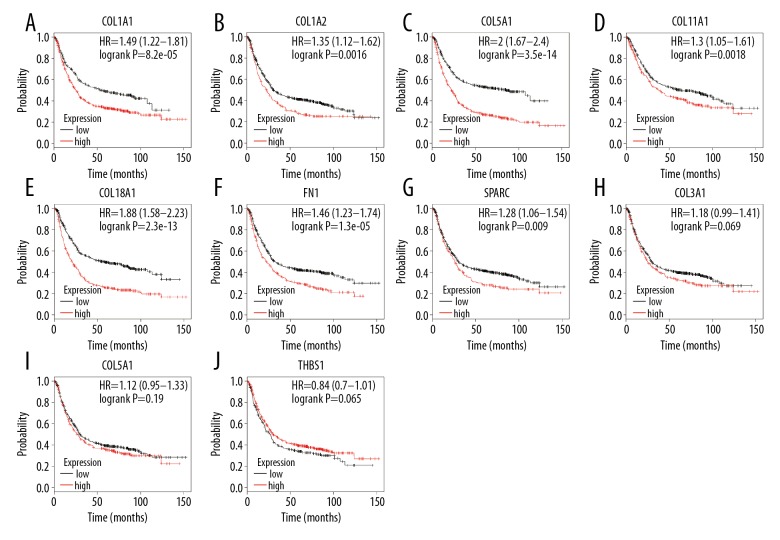
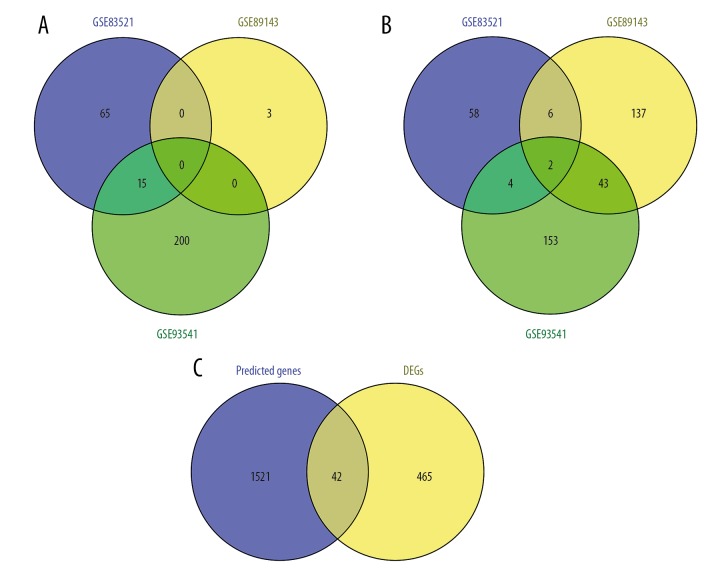
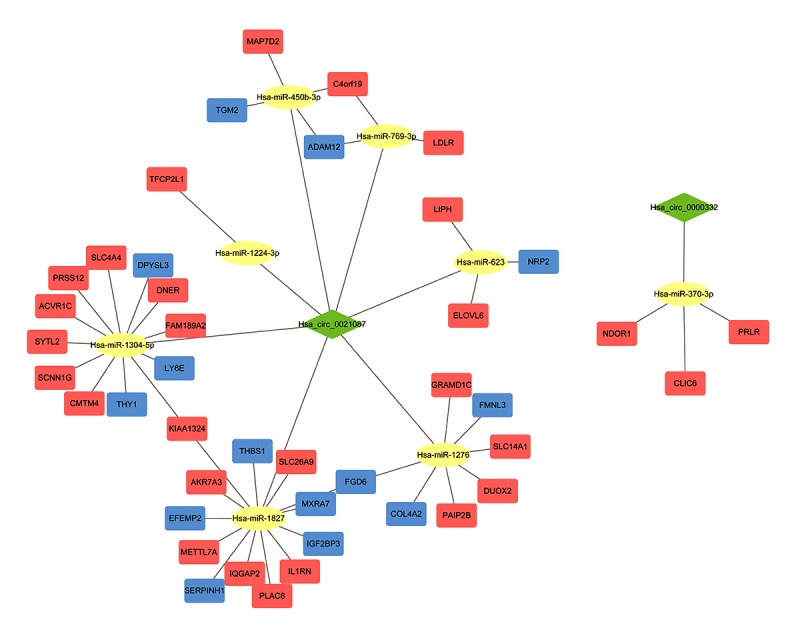
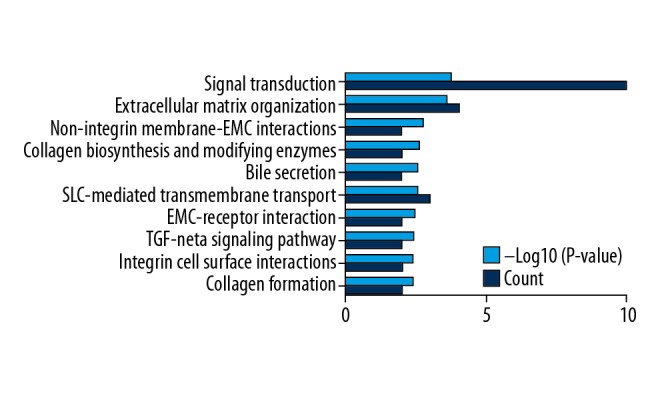
BACKGROUND Globally, gastric cancer (GC) is the third most common source of cancer-associated mortality. The aim of this study was to identify key genes and circular RNAs (circRNAs) in GC diagnosis, prognosis, and therapy and to further explore the potential molecular mechanisms of GC. MATERIAL AND METHODS Differentially expressed genes (DEGs) and circRNAs (DE circRNAs) between GC tissues and adjacent non-tumor tissues were identified from 3 mRNA and 3 circRNA expression profiles. Functional analyses were performed, and protein-protein interaction (PPI) networks were constructed. The significant modules and key genes in the PPI networks were identified. Kaplan-Meier analysis was performed to evaluate the prognostic value of these key genes. Potential miRNA-binding sites of the DE circRNAs and target genes of these miRNAs were predicted and used to construct DE circRNA-miRNA-mRNA networks. RESULTS A total of 196 upregulated and 311 downregulated genes were identified in GC. The results of functional analysis showed that these DEGs were significantly enriched in a variety of functions and pathways, including extracellular matrix-related pathways. Ten hub genes (COL1A1, COL3A1, COL1A2, COL5A2, FN1, THBS1, COL5A1, SPARC, COL18A1, and COL11A1) were identified via PPI network analysis. Kaplan-Meier analysis revealed that 7 of these were associated with a poor overall survival in GC patients. Furthermore, we identified 2 DE circRNAs, hsa_circ_0000332 and hsa_circ_0021087. To reveal the potential molecular mechanisms of circRNAs in GC, DE circRNA-microRNA-mRNA networks were constructed. CONCLUSIONS Key candidate genes and circRNAs were identified, and novel PPI and circRNA-microRNA-mRNA networks in GC were constructed. These may provide useful information for the exploration of potential biomarkers and targets for the diagnosis, prognosis, and therapy of GC.


Figures

Figure 1
Figure 1
DEGs between GC and adjacent non-tumor tissues. (A) Volcano plot for DEGs in GSE19826. (B) Volcano plot for DEGs in GSE54129. (C) Volcano plot for DEGs in GSE79973. Red: log (FC) >1, p<0.05; green: log (FC) <1, p<0.05). DEG – differentially expressed gene; GC – gastric cancer; FC – fold change.
Figure 2
Figure 2
Venn diagram of DEGs in the 3 cohort profile datasets (GSE19826, GSE54129, and GSE79973). (A) Upregulated DEGs. (B) Downregulated DEGs. Different color areas represent different datasets. The overlapping areas are the common DEGs. DEG – differentially expressed gene.
Figure 3
Figure 3
GO annotation and pathway enrichment analysis. (A) Top 10 terms in BP category. (B) Top 10 terms in CC category. (C) Top 10 terms in MF category. (D) Top 10 terms in pathway enrichment analysis. GO – gene ontology; DEG – differentially expressed gene; BP – biological process; CC – cellular component; MF – molecular function.
Figure 4
Figure 4
PPI networks of the DEGs. The network contains 253 nodes and 588 edges. Network nodes represent proteins (shown with gene names). The color of each node denotes the expression of genes in the GC samples compared to that in non-tumor samples (pink represents upregulated and blue represents downregulated). PPI – protein–protein interaction; DEG – differentially expressed gene.
Figure 5
Figure 5
Hub genes and module analysis of the PPI networks. (A) Hub genes identified by cytoHubba plug-in (interaction degree ≥20). Node color denotes interaction degree (red for high degree, orange for intermediate degree, and yellow for low degree). (B) Module 1, identified by MCODE plug-in, contains 16 genes. (C) Module 2 contains 7 genes. (D) Module 3 contains 11 genes. The color of each node denotes the expression of genes in the GC samples compared to that in normal gastric samples (pink for upregulation and blue for downregulation). (E) Pathway enrichment analysis of 3 significant modules in PPI networks. PPI, protein–protein interaction.
Figure 6
Figure 6
Association of the 10 hub genes with the OS of GC patients, analyzed by Kaplan-Meier survival plots. (A–G) High expression of COL1A1, COL1A2, COL5A2, COL11A1, COL18A1, FN1, and SPARC was associated with poor OS of GC patients. (H–J) Expression of COL3A1, COL5A2, and THBS1 was not related to OS of GC patients. OS, overall survival; GC, gastric cancer.
Figure 7
Figure 7
Venn diagrams of (A) common upregulated and (B) common downregulated DE circRNAs in the 3 cohort profile datasets (GSE83521, GSE89143, and GSE93541). Different colored areas represent different datasets. The overlapping areas indicate common DE circRNAs. (C) Predicted target genes overlapping DEGs identified from the gene expression profiles. DE circRNAs, differentially expressed circRNAs; DEGs, differentially expressed genes.
Figure 8
Figure 8
DE circRNA–miRNA–mRNA networks. The network contains 52 nodes and 54 edges. The green diamond nodes represent circRNAs; yellow ellipsoidal nodes, miRNAs; orange square nodes, upregulated genes; blue square nodes, downregulated genes.
Figure 9
Figure 9
Pathway enrichment analysis of the 42 genes in the DE circRNA–miRNA–mRNA networks.

References

    1. Ren J, Niu G, Wang X, et al. Effect of age on prognosis of gastric signet-ring cell carcinoma: A SEER database analysis. Med Sci Monit. 2018;24:8524–32. - PMC - PubMed
    1. Siegel RL, Miller KD, Jemal A. Cancer statistics, 2018. Cancer J Clin. 2018;68(1):7–30. - PubMed
    1. Song Z, Wu Y, Yang J, et al. Progress in the treatment of advanced gastric cancer. Tumour Biol. 2017;39(7) 1010428317714626. - PubMed
    1. Chen W, Lu C, Hong J. TRIM15 exerts anti-tumor effects through suppressing cancer cell invasion in gastric adenocarcinoma. Med Sci Monit. 2018;24:8033–41. - PMC - PubMed
    1. Liu W, Ouyang S, Zhou Z, et al. Identification of genes associated with cancer progression and prognosis in lung adenocarcinoma: Analyses based on microarray from Oncomine and The Cancer Genome Atlas databases. Mol Genet Genomic Med. 2019;7(2):e00528. - PMC - PubMed