. 2019 Apr 4;10(1):1533.
doi: 10.1038/s41467-019-09487-1.

Reversible induction of mitophagy by an optogenetic bimodular system

Affiliations

Reversible induction of mitophagy by an optogenetic bimodular system

Pasquale D'Acunzo et al. Nat Commun. .

Abstract

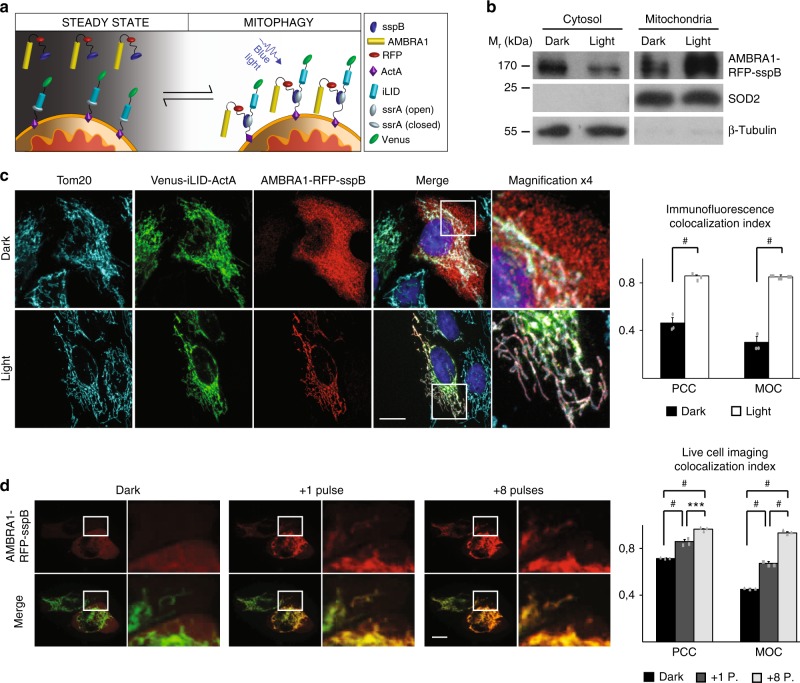
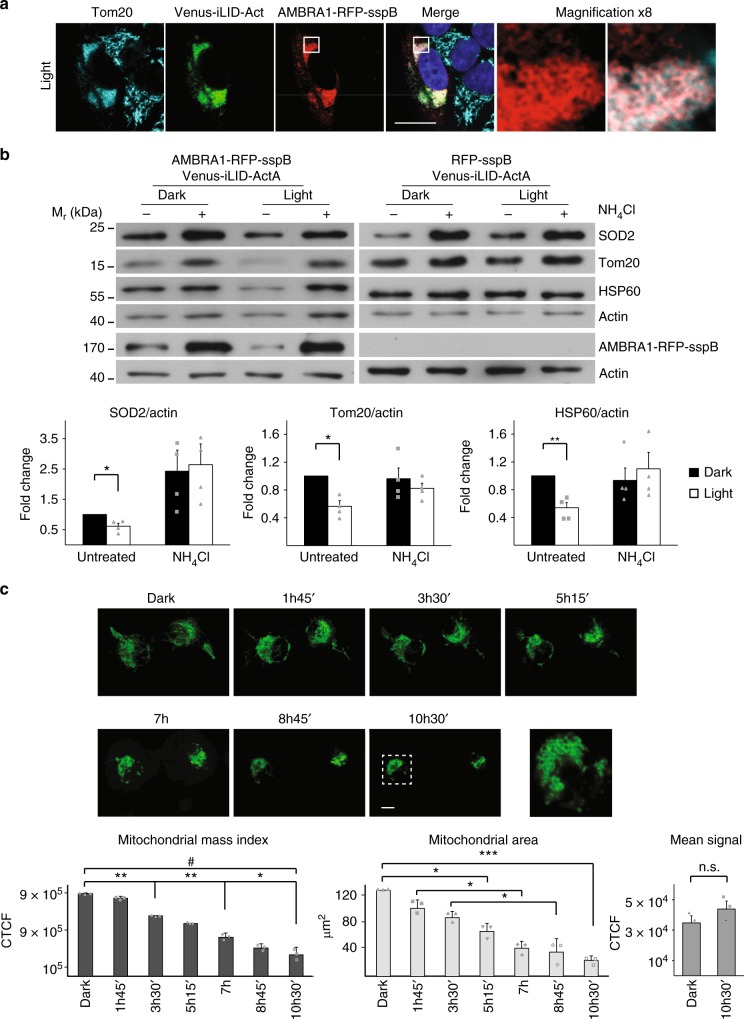
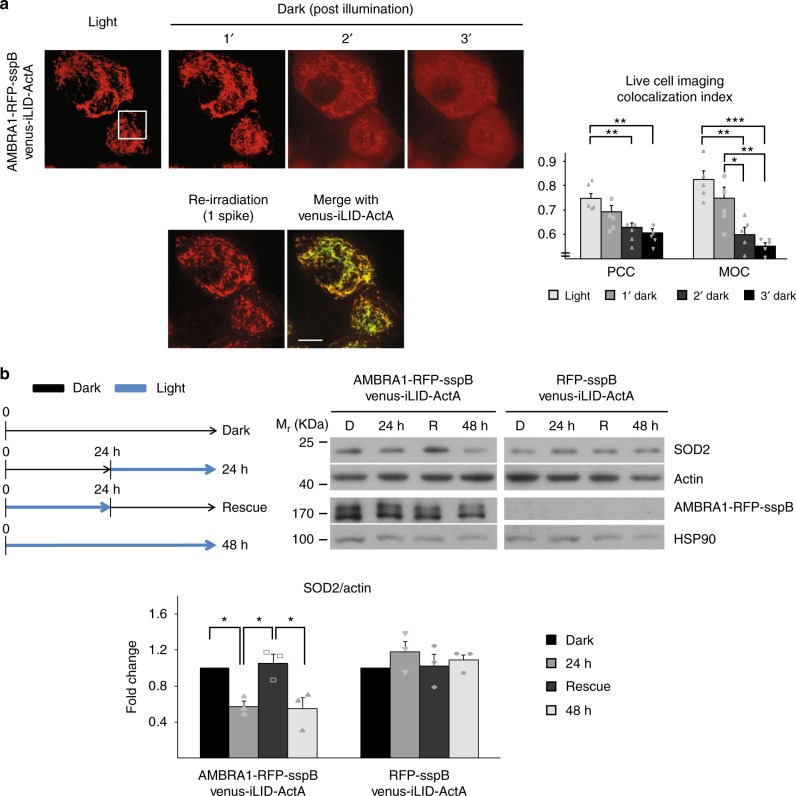
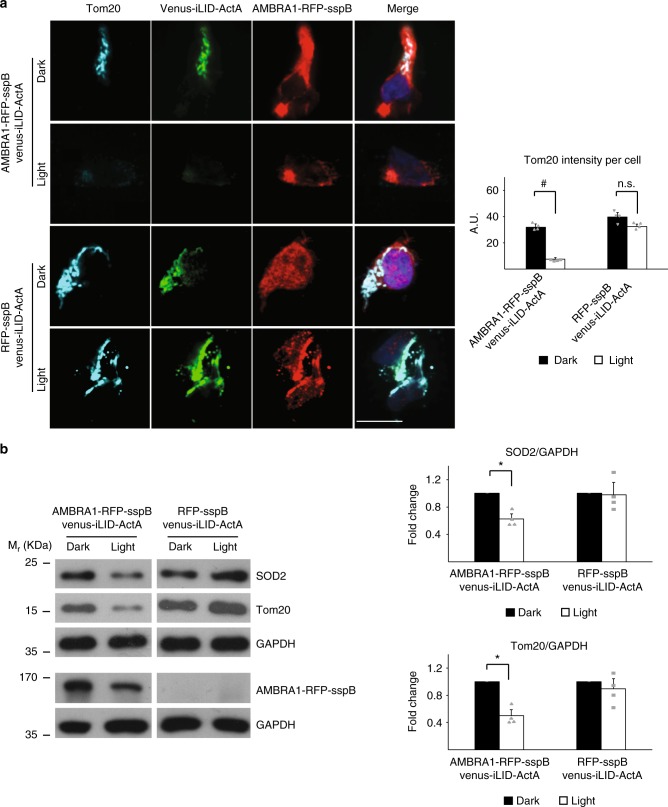
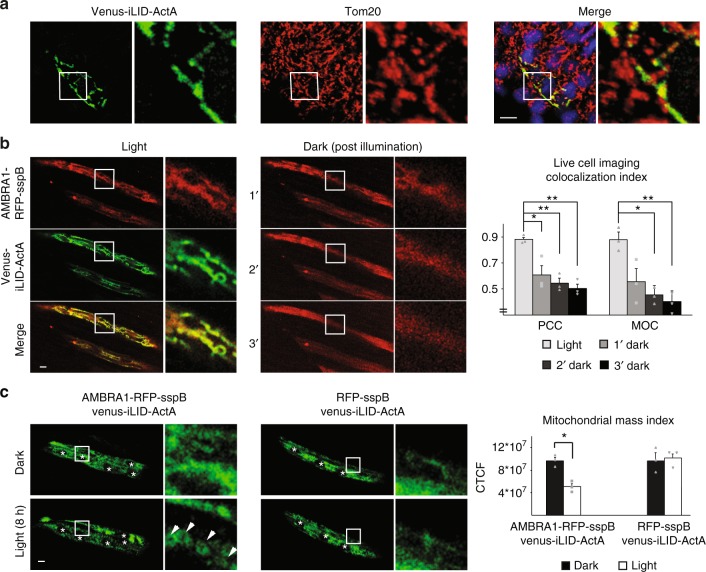
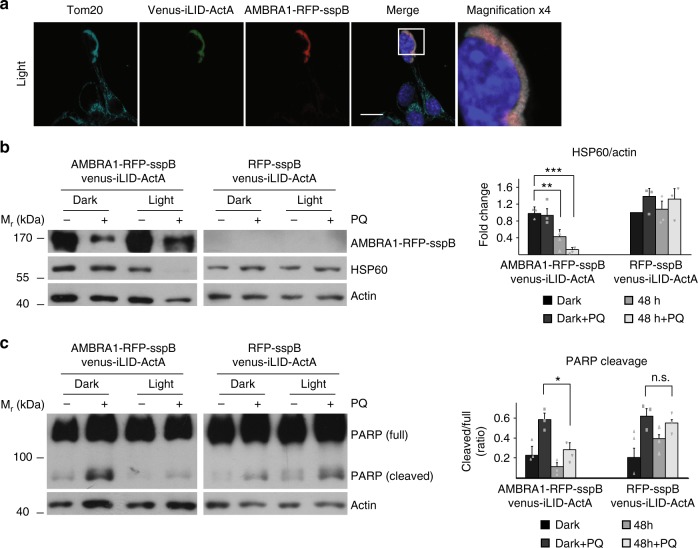
Autophagy-mediated degradation of mitochondria (mitophagy) is a key process in cellular quality control. Although mitophagy impairment is involved in several patho-physiological conditions, valuable methods to induce mitophagy with low toxicity in vivo are still lacking. Herein, we describe a new optogenetic tool to stimulate mitophagy, based on light-dependent recruitment of pro-autophagy protein AMBRA1 to mitochondrial surface. Upon illumination, AMBRA1-RFP-sspB is efficiently relocated from the cytosol to mitochondria, where it reversibly mediates mito-aggresome formation and reduction of mitochondrial mass. Finally, as a proof of concept of the biomedical relevance of this method, we induced mitophagy in an in vitro model of neurotoxicity, fully preventing cell death, as well as in human T lymphocytes and in zebrafish in vivo. Given the unique features of this tool, we think it may turn out to be very useful for a wide range of both therapeutic and research applications.


Conflict of interest statement

The authors declare no competing interests.

Figures

Fig. 1
Fig. 1
AMBRA1-RFP-sspB is relocalized to MOM upon blue light exposure. a Scheme of the blue light-dependent, AMBRA1-RFP-sspB-mediated induction of mitophagy. In resting conditions, Venus-iLID-ActA is tethered to the MOM, while AMBRA1-RFP-sspB is found in the cytosol (STEADY STATE panel, left). Upon blue light administration, iLID undergoes into a conformational change, which unmasks the ssrA peptide and permits the high-affinity binding between ssrA and sspB (MITOPHAGY panel, Right). Thus, the pro-autophagy protein AMBRA1 (covalently bound to sspB) accumulates to the edge of the MOM where it promotes autophagy-mediated clearance of mitochondria (mitophagy). b HeLa cells, transfected with plasmids encoding Venus-iLID-ActA/AMBRA1-RFP-sspB, were exposed to continuous blue light for 30 s or kept in the dark. Crude mitochondrial and cytosolic extracts were analyzed by WB through an anti-AMBRA1 antibody to reveal AMBRA1-RFP-sspB. SOD2 and β-tubulin were used as loading control for mitochondrial and cytosolic lysates, respectively. Mr (kDa): relative molecular mass expressed in kilodalton. c HeLa cells were transfected and treated as described in (b). Subsequently, cells were fixed and immuno-stained with antibodies against AMBRA1 (red) and Tom20 (MOM marker, cyan). The green signal shown in the figure is the intrinsic fluorescence of the Venus-iLID-ActA protein. Pearson’s correlation coefficient (PCC) and Manders’ overlap coefficient (MOC) of the red over the green signal were quantified in ten random fields of three independent experiments. Nuclei (blue) were stained with DAPI. d HeLa cells overexpressing Venus-iLID-ActA/AMBRA1-RFP-sspB were filmed through the UltraVox (PerkinElmer) live cell imaging spinning disk microscope before (Dark in the panel) and during 8 irradiation cycles, consisting of 1 pulse (50 ms) of blue light followed by 35 s of dark resting state. The graph shows PCC and MOC quantifications of the red over the green signal for three conditions (Dark, one pulse, eight pulses) in ten random fields of three independent experiments. Images are the sum of a three frames Z-stack. Insets: 4× magnification. Scale bars: 10 μm. Data shown: mean ± S.E.M. Hypothesis tests: Student’s t test in (c) and ANOVA test in (d). ***p < 10−3. #p < 10−4. Source data are provided as a Source Data file
Fig. 2
Fig. 2
AMBRA1-RFP-sspB shuttling to the MOM induces mitophagy. a Venus-iLID-ActA/AMBRA1-RFP-sspB overexpressing HeLa cells were irradiated or not for 4 h with pulsed, blue light. Cells were subsequently fixed and stained for Nuclei (DAPI, blue), AMBRA1 (red) and Tom20 (cyan). Inset: 8× magnification. Scale bar: 10 μm. b HeLa cells, transfected with plasmids encoding Venus-iLID-ActA/AMBRA1-RFP-sspB (left panel), were stimulated with a blue LED irradiator or left in the dark for 24 h. In the meantime, they were treated or not with 40 mM NH4Cl, a lysosome inhibitor. As a negative control, the same experiment was repeated in Venus-ILID-ActA/RFP-sspB co-expressing cells (right panel). In the subsequent WB analysis, Tom20, SOD2, and HSP60 were used as mitochondrial markers, while actin was the loading control. AMBRA1-RFP-sspB was detected to verify the rate of overexpression. Graphs recapitulate the normalized ratio between the densitometric signals of the three mitochondrial markers over actin in four independent experiments involving Venus-iLID-ActA/AMBRA1-RFP-sspB overexpressing cells. For the quantification of the same parameters in the negative control see Supplementary Figure 7. Data shown: mean ± S.E.M. Hypothesis test: Student’s t test. *p < 5 × 10−2. **p < 102. Mr (kDa): Relative molecular mass expressed in kilodalton. c Single-HeLa cells co-expressing Venus-iLID-ActA/AMBRA1-RFP-sspB were followed in time for 10 h 30 min during mitophagy progression through live cell imaging of the protein Venus-iLID-ActA (50 ms blue laser spikes alternated by 1 min dark). Each frame depicts mitochondria morphology every 1 h 45 min of stimulation. Images are the sum of a three frames Z-stack. Graphs show the area occupied by mitochondria over time, the overall reduction per whole cell of the Venus-iLID-ActA signal intensity corrected for the background and the mean fluorescence intensity in three independent experiments. Inset: 4× magnification of a single plane after 10 h 30 min of stimulation, highlighting mitoaggresome formation. CTCF corrected total cell fluorescence. Scale bar: 10 μm. Data shown: mean ± S.E.M. Hypothesis test: ANOVA test for Area and Mito Mass Index, Student’s t test for the mean signal. n.s. not statistically significant. *p < 5 × 10−2. **p < 10−2. ***p < 10−3. #p < 104. Source data are provided as a Source Data file
Fig. 3
Fig. 3
AMBRA1-RFP-sspB-mediated mitophagy is reversible. a AMBRA1-RFP-sspB shuttling from mitochondria was assessed by live cell imaging in single Venus-iLID-ActA/AMBRA1-RFP-sspB overexpressing HeLa cells. Upon blue light irradiation AMBRA1-RFP-sspB was found at mitochondria. Subsequently, AMBRA1-RFP-sspB subcellular distribution was recorded every minute without blue light administration. After 3 min, one spike of blue light was reapplied. Images are the sum of a three frames Z-stack. PCC and MOC of the red over the green signal were quantified in ten random fields of five independent experiments. For a ×4 magnification of the inset see Supplementary Figure 13. Scale bar: 10 μm. Data shown mean ± S.E.M. Hypothesis test: ANOVA test. *p < 5 × 10−2. **p < 10−2. ***p < 10−3. b Transfected HeLa cells were treated as follows: 48 h of dark (lane Dark or D), 24 h of dark + 24 h pulsed blue light (1 s light + 1 min dark, lane 24 h), 24 h of pulsed blue light + 24 h of dark state (lane Rescue or R), and 48 h of pulsed blue light only. Cell lysates were loaded on a polyacrylamide gel and immuno-blotted. Levels of the mitochondrial marker SOD2 were investigated; AMBRA1-RFP-sspB was detected to verify the rate of overexpression. Actin and HSP90 were used as loading controls of the two gels, respectively. The graph shows the normalized densitometric SOD2 over actin ratio in three independent experiments. The experiments were repeated in Venus-iLID-ActA/RFP-sspB overexpressing HeLa cells as a control (right panel). Data shown: mean ± S.E.M. Hypothesis test: ANOVA test. *p < 5 × 10−2. Mr (kDa): Relative molecular mass expressed in kilodalton. Source data are provided as a Source Data file
Fig. 4
Fig. 4
AMBRA1-RFP-sspB-mediated mitophagy can be induced in T lymphocytes. a Human T lymphocytes from healthy donors were double infected with viral vectors encoding Venus-iLID-ActA/AMBRA1-RFP-sspB or Venus-iLID-ActA/RFP-sspB (negative control). Cells were subsequently illuminated 24 h with pulsed (1 s light, 1 min dark) blue light or kept in the dark, then fixed and immunostained for Tom20 (cyan). Nuclei were counterstained with DAPI (blue). The graph show the intensity per cell of the Tom20 signal from four different donors. A minimum of 50 cells were analyzed per donor. Scale bar: 10 μm. Data shown: mean ± S.E.M. Hypothesis test: ANOVA test. #p < 10−4. n.s. not statistically significant. b Human T lymphocytes, manipulated as described in (a), were lysed and analyzed by WB. Tom20 and SOD2 were used as mitochondrial markers, while GAPDH was the loading control. AMBRA1-RFP-sspB was detected to verify the rate of overexpression. Graphs recapitulate the normalized ratio between the densitometric signals of the two mitochondrial markers over GAPDH in four different donors. Data shown: Mean ± S.E.M. Hypothesis test: ANOVA test. *p < 5 × 10−2. Mr (kDa): Relative molecular mass expressed in kilodalton. Source data are provided as a Source Data file
Fig. 5
Fig. 5
In vivo induction of mitophagy through an optogenetic bimodular system. a Zebrafish embryos were microinjected with a Venus-iLID-ActA overexpressing plasmid, then fixed 48-hpf and whole mount immuno-stained for Tom20 (red). Nuclei were counterstained with DAPI (blue). Inset: ×4 magnification. Scale bar: 10 μm. b Venus-iLID-ActA/AMBRA1-RFP-sspB microinjected zebrafish embryos were illuminated with blue light and then kept in the dark for 3 min, mimicking the experiment shown in Fig. 3a. Double-positive muscle fibers were photographed in order to analyze Venus-iLID-ActA/AMBRA1-RFP-sspB dynamic interactions. PCC and MOC of the red over the green signal were quantified in three independent experiments. Inset: ×6 magnification. Scale bar: 10 μm. Data shown: mean ± S.E.M. Hypothesis test: ANOVA test. *p < 5 × 102. **p < 10−2. c Venus-iLID-ActA/AMBRA1-RFP-sspB or Venus-iLID-ActA/RFP-sspB (negative control) double positive zebrafish embryos were illuminated for 8 h with a pulsed (2 s light/2 min dark) blue light; muscle fibers were analyzed. Upon light stimulation, round-shaped mitochondria (arrowheads) were clearly visible in AMBRA1-RFP-sspB but not RFP-sspB positive fibers. Images are the sum of three frames Z-stack. Stars indicate nuclei. Graphs show the overall reduction per single fiber of the Venus-iLID-ActA signal intensity corrected for the background in three independent experiments. Inset: ×8 magnification. Scale bar: 10 μm. Data shown: mean ± S.E.M. Hypothesis test: ANOVA test. *p < 5 × 10−2. Source data are provided as a Source Data file
Fig. 6
Fig. 6
Optogenetic-mediated mitophagy prevents apoptosis in a model of neurotoxicity. a ETNA (Embryonic Telencephalic NAïve) cells co-expressing Venus-iLID-ActA/AMBRA1-RFP-sspB were irradiated with pulsed (1 s light + 1 min dark) light for 4 h, then fixed and stained for nuclei (DAPI, blue) AMBRA1 (red) and Tom20 (cyan). Inset: ×4 magnification. Scale bar: 10 μm. b ETNA cells, transfected with Venus-iLID-ActA/AMBRA1-RFP-sspB or Venus-iLID-ActA/RFP-sspB (negative control), were irradiated with pulsed blue light (1 s light + 1 min dark) for 48 h or left in the dark upon treatment with 250 μM PQ. Cell lysates were prepared and HSP60 levels (mitochondrial marker) explored in three independent experiments. Actin was used as a loading control. The graph reports the means of the normalized densitometric ratio between HSP60 and actin. Data shown: mean ± S.E.M. Hypothesis test: ANOVA test. **p < 10−2. ***p < 10−3. Mr (kDa): Relative molecular mass expressed in kilodalton. c Venus-iLID-ActA/AMBRA1-RFP-sspB or Venus-iLID-ActA/RFP-sspB (negative control) ETNA cells were handled as described in (b). WB was performed to reveal PARP protein in cell lysates. Upper band: full length PARP. Lower band: cleaved PARP. Actin: loading control. The graph summarizes the densitometric quantification of cleaved/full PARP in three independent experiments. Data shown: mean ± S.E.M. Hypothesis test: ANOVA test. *p < 5 × 102. n.s. not statistically significant. Mr (KDa): Relative molecular mass expressed in kilodalton. Source data are provided as a Source Data file

References

    1. Strappazzon F, Cecconi F. The multifaceted mitochondrion: an attractive candidate for therapeutic strategies. Pharmacol. Res. 2015;99:425–433. doi: 10.1016/j.phrs.2015.03.007. - DOI - PubMed
    1. Hsu CC, Tseng LM, Lee HC. Role of mitochondrial dysfunction in cancer progression. Exp. Biol. Med. 2016;241:1281–1295. doi: 10.1177/1535370216641787. - DOI - PMC - PubMed
    1. Strappazzon F, Cecconi F. AMBRA1-induced mitophagy: a new mechanism to cope with cancer? Mol. Cell Oncol. 2015;2:e975647. doi: 10.4161/23723556.2014.975647. - DOI - PMC - PubMed
    1. Park KS, et al. FCCP depolarizes plasma membrane potential by activating proton and Na+ currents in bovine aortic endothelial cells. Pflug. Arch. 2002;443:344–352. doi: 10.1007/s004240100703. - DOI - PubMed
    1. Tretter L, Chinopoulos C, Adam-Vizi V. Plasma membrane depolarization and disturbed Na+ homeostasis induced by the protonophore carbonyl cyanide-p-trifluoromethoxyphenyl-hydrazon in isolated nerve terminals. Mol. Pharmacol. 1998;53:734–741. doi: 10.1124/mol.53.4.734. - DOI - PubMed

Publication types

Substances