. 2019 Apr 4;10(1):1547.
doi: 10.1038/s41467-019-09597-w.

Identification of the kinase STK25 as an upstream activator of LATS signaling

Affiliations

Identification of the kinase STK25 as an upstream activator of LATS signaling

Sanghee Lim et al. Nat Commun. .

Abstract

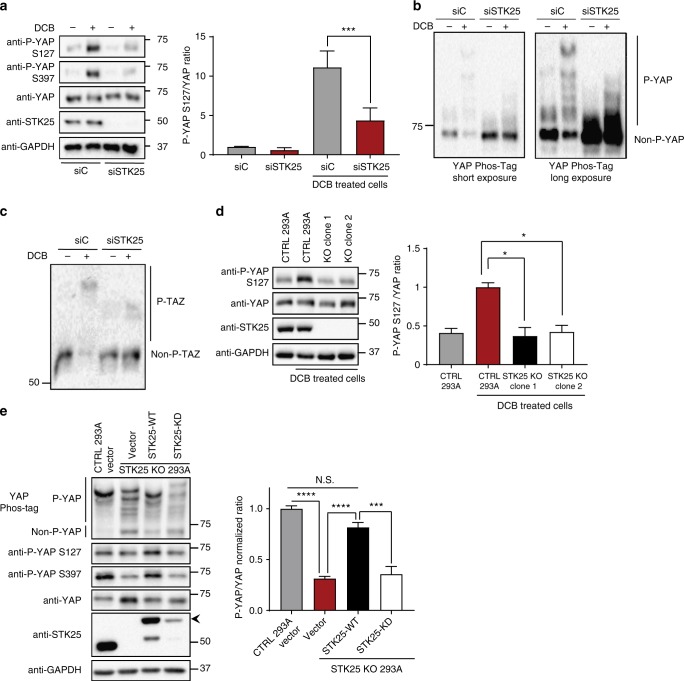
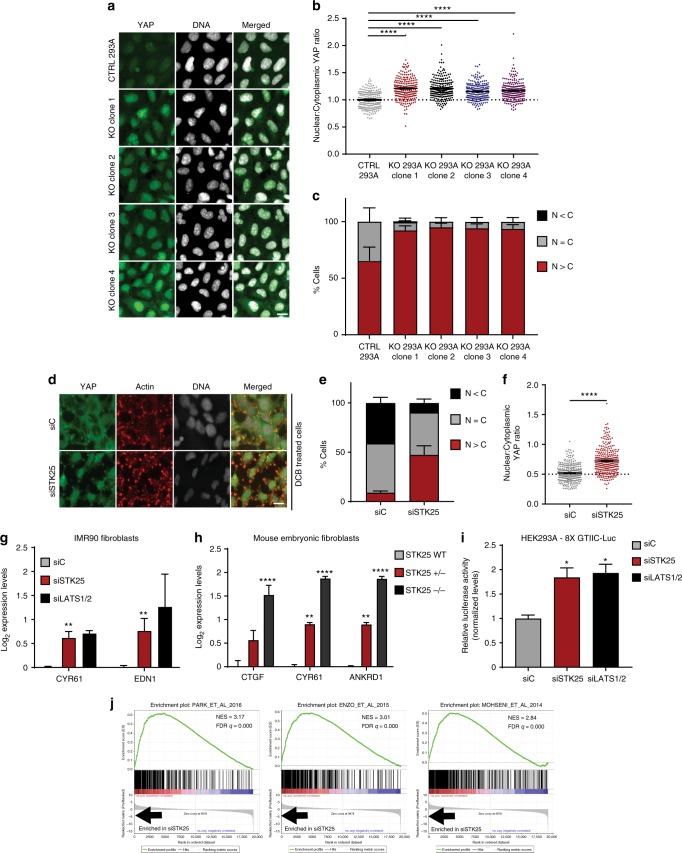
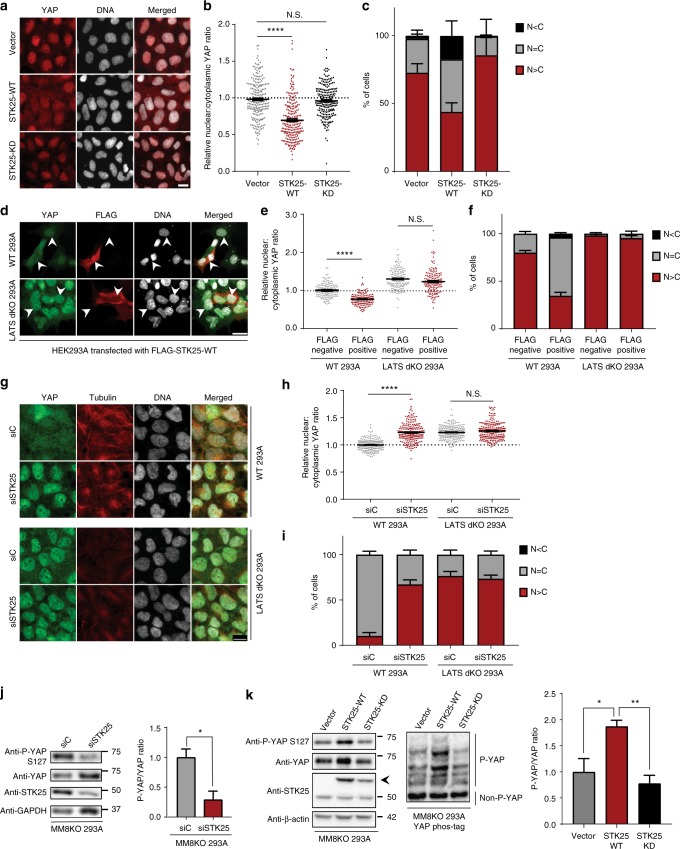
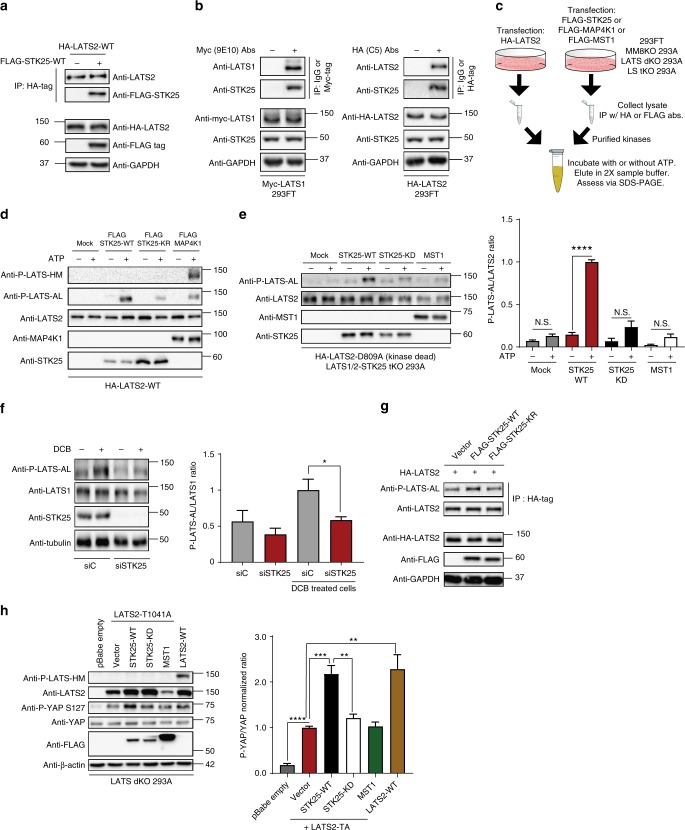
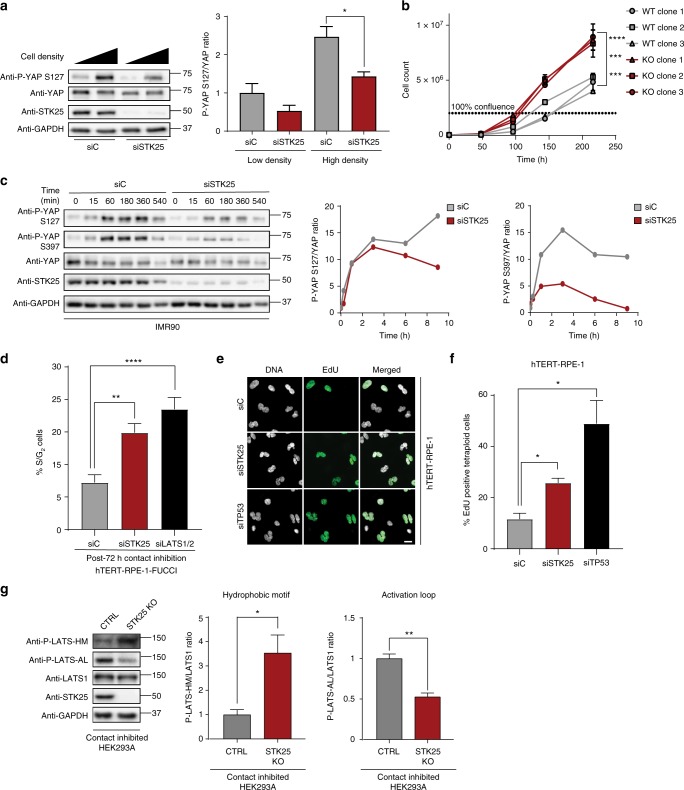
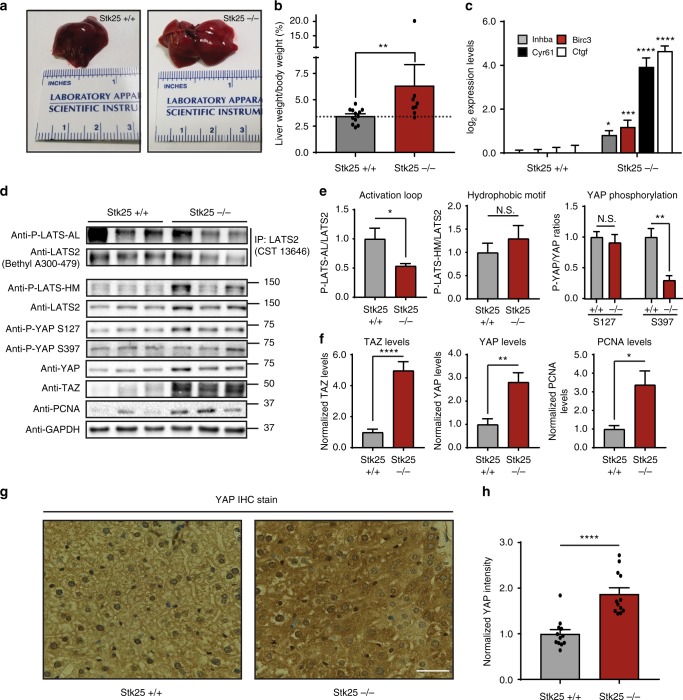
The Hippo pathway maintains tissue homeostasis by negatively regulating the oncogenic transcriptional co-activators YAP and TAZ. Though functional inactivation of the Hippo pathway is common in tumors, mutations in core pathway components are rare. Thus, understanding how tumor cells inactivate Hippo signaling remains a key unresolved question. Here, we identify the kinase STK25 as an activator of Hippo signaling. We demonstrate that loss of STK25 promotes YAP/TAZ activation and enhanced cellular proliferation, even under normally growth-suppressive conditions both in vitro and in vivo. Notably, STK25 activates LATS by promoting LATS activation loop phosphorylation independent of a preceding phosphorylation event at the hydrophobic motif, which represents a form of Hippo activation distinct from other kinase activators of LATS. STK25 is significantly focally deleted across a wide spectrum of human cancers, suggesting STK25 loss may represent a common mechanism by which tumor cells functionally impair the Hippo tumor suppressor pathway.


Conflict of interest statement

The authors declare no competing interests.

Figures

Fig. 1
Fig. 1
STK25 regulates Hippo activation in response to loss of cytoskeletal tension. a Immunoblot and quantitation of phosphorylated YAP levels following treatment with 10 µM DCB in HEK293A cells transfected with the indicated siRNA (n = 6; ***p < 0.001, unpaired t-test). b Global phosphorylation status of YAP was assessed using Phos-tag gel electrophoresis following treatment with 10 µM DCB in HEK293A cells transfected with either control siRNA or STK25 siRNA. Shifted bands indicate degrees of YAP phosphorylation. c TAZ phosphorylation status was assessed using Phos-tag gel electrophoresis following treatment with 10 µM DCB in HEK293A cells transfected with either control siRNA or STK25 siRNA. d Immunoblot and quantitation of phosphorylated YAP levels following treatment with 10 µM DCB in either control HEK293A stably expressing Cas9 and a non-targeting sgRNA or STK25 KO 293A stably expressing Cas9 together with either sgRNA 1 (Clone 1) or sgRNA 2 (Clone 2) targeting STK25 (n = 4; *p < 0.05, one-way ANOVA with Dunnett’s post-hoc analysis). e Immunoblot and quantitation of phosphorylated YAP levels in control 293A cells and STK25 KO 293A cells transfected with either Vector, Cas9-resistant FLAG-STK25-WT, or Cas9-resistant FLAG-STK25-KD. Global levels of YAP phosphorylation in these samples were also assessed using Phos-tag gel electrophoresis. Quantitation corresponds to levels of phosphorylated YAP as measured via phos-tag electrophoresis (n = 4; ***p < 0.001, ****p < 0.0001; One-way ANOVA with Dunnett’s post-hoc analysis). All data are presented as mean ± SEM
Fig. 2
Fig. 2
Loss of STK25 promotes activation of YAP. a Control and STK25 KO HEK293A were stained for YAP (green) and DNA (white). Scale bar, 20 µm. b Nuclear:cytoplasmic YAP ratios of control and STK25 KO HEK293A were quantified (n = 225 per group over three biological replicates; ****p < 0.0001, Kruskal–Wallis test). c YAP localization in control and STK25 KO HEK293A was quantified (n = 3 biological replicates; N>C, YAP is enriched in the nucleus; N=C, YAP is evenly distributed between the nucleus and the cytoplasm; N<C, YAP is enriched in the cytoplasm). d HEK293A cells transfected with either control siRNA or STK25 siRNA stained for YAP (green), Actin (red), and DNA (white) following treatment with 5 µM DCB. Scale bar, 20 µm. e YAP localization was quantified (n = 3 biological replicates; N>C, YAP is enriched in the nucleus; N=C, YAP is evenly distributed between the nucleus and the cytoplasm; N<C, YAP is enriched in the cytoplasm). f YAP intensity was quantified and nuclear:cytoplasmic ratios were calculated (n = 225 per group over three biological replicates; ****p < 0.0001, Mann–Whitney test). g qPCR analysis of YAP-target gene expression in IMR90 fibroblasts transfected with the indicated siRNA (n = 4; **p < 0.01, unpaired t-test). h qPCR analysis of YAP-target gene expression in wild-type, STK25+/, and STK25/ mouse embryonic fibroblasts (n = 3 biological replicates; **p < 0.01, ****p < 0.0001, one-way ANOVA with Dunnett’s post-hoc analysis). i Expression of the TEAD luciferase reporter in HEK293A cells transfected with the indicated siRNA. Cells were transfected with siRNA, followed by transfection with 8X GTIIC TEAD luciferase reporter and pRL-TK renilla luciferase. Reporter luciferase activity was normalized to Renilla luciferase (n = 3 biological replicates; *p < 0.05, one-way ANOVA with Dunnett’s post-hoc analysis). j An expression signature of genes most upregulated upon loss of STK25 was constructed and GSEA was performed against a curated list of publicly available active YAP/TAZ gene sets. The top three most enriched gene sets are shown here. All data are presented as mean ± SEM
Fig. 3
Fig. 3
STK25 acts through LATS1/2 to inhibit YAP, independent of MST/MAP4Ks. a HEK293A cells stably expressing STK25-WT, STK25-KD, or vector were stained for YAP (red) and DNA (white). Scale bar, 20 µm. b YAP intensities from a were quantified and nuclear:cytoplasmic ratios were calculated (n = 225 per group over three biological replicates; ****p < 0.0001, Mann–Whitney test). c YAP localization from a was quantified (n = 3 biological replicates; N>C, YAP is enriched in the nucleus; N=C, YAP is evenly distributed between the nucleus and the cytoplasm; N<C, YAP is enriched in the cytoplasm). d Wild-type and LATS dKO HEK293A were transfected with a vector encoding FLAG-STK25-WT and were stained for YAP (green), FLAG (red), and DNA (white). Scale bar, 20 µm. Arrows indicate representative cells selected for quantification that were positive for FLAG signal (indicating expression of transfected wild-type STK25) as well as an immediately adjacent cell negative of FLAG signal also selected for quantification to serve as controls. e YAP intensities from d and nuclear:cytoplasmic ratios were calculated (n = 200 per group over four biological replicates; ****p < 0.0001, Kruskal–Wallis test with Dunn’s post-test; N.S. indicates “not significant”). f YAP localization from d were quantified as before (n = 4 biological replicates). g Wild-type and LATS dKO HEK293A were transfected with the indicated siRNA, grown to confluence, then stained for YAP (green), Tubulin (red), and DNA (white). Scale bar, 20 µm. h YAP intensities from g were quantified and nuclear:cytoplasmic ratios were calculated (n = 225 over three biological replicates; ****p < 0.0001, Kruskal–Wallis test with Dunn’s post-test; N.S. indicates “not significant.”) i YAP localization from g were quantified as before (n = 3 biological replicates). j Immunoblot and quantification of phosphorylated YAP in MM8KO 293A cells transfected with the indicated siRNA (n = 3 biological replicates; *p < 0.05, paired t-test). k Immunoblot and quantitation of YAP phosphorylation in confluent MM8KO 293A cells stably expressing either the pWZL vector, STK25-WT, or STK25-KD. Quantitation corresponds to levels of phosphorylated YAP as measured via phos-tag electrophoresis (n = 4 biological replicates; *p < 0.05, **p < 0.01, one-way ANOVA with Dunnett’s post-hoc analysis). All data are presented as mean ± SEM
Fig. 4
Fig. 4
STK25 directly promotes phosphorylation of LATS activation loop. a LATS2 was immunoprecipitated from HEK293A cells co-transfected with HA-LATS2 and either vector control or FLAG-STK25. Co-precipitation of FLAG-STK25 with HA-LATS2 was assessed by immunoblotting. b HEK293A cells were transfected with Myc-LATS1 or HA-LATS2. LATS1 and LATS2 were immunoprecipitated using antibodies directed against their tags and co-precipitation of endogenous STK25 was assessed by immunoblotting. c Schema of the in vitro kinase assay set-up. d Immunoprecipitation (IP)-purified wild-type LATS2 (HA-LATS2-WT) was co-incubated with IP-purified wild-type STK25 (FLAG-STK25-WT), kinase-dead STK25 (FLAG-STK25-KD), or wild-type MAP4K1 (FLAG-MAP4K1), and assessed for phosphorylation of its hydrophobic motif (P-LATS-HM) or activation loop (P-LATS-AL). e IP-purified kinase-dead LATS2 (HA-LATS2-KD) from transfected LATS1/2-STK25 triple KO 293A cells (LS tKO 293A) was co-incubated with IP-purified FLAG-STK25-WT, FLAG-STK25-KD, or FLAG-MST1, all from transfected LS tKO 293A. Levels of phosphorylated LATS at the activation loop (P-LATS-AL) were assessed via immunoblotting. Levels of phosphorylated LATS2-KD at the activation loop were then quantitated via densitometry (n = 4 biological replicates; ****p < 0.0001, N.S. indicates “not significant,” unpaired t-test). f Immunoblot and quantitation of LATS activation loop phosphorylation (P-LATS-AL) following treatment with 10 µM DCB in HEK293A cells transfected with the indicated siRNA (n = 4 biological replicates; *p < 0.05, paired t-test). g HEK293A cells were co-transfected with HA-tagged wild-type LATS2 (HA-LATS2-WT) and either vector control (Vector), wild-type STK25 (FLAG-STK25-WT), or kinase-dead STK25 (FLAG-STK25-KD). LATS2 was immunoprecipitated and used to assess levels of activation loop phosphorylation by immunoblotting. Input lysates were assessed by immunoblotting for assessing protein loading and verification of transfected protein expression. h Immunoblot and quantitation of YAP phosphorylation in LATS dKO 293A cells transfected with the indicated expression plasmids. LATS2-TA indicates hydrophobic motif mutant LATS2 T1041A (n = 4 biological replicates; **p < 0.01, ***p < 0.001, ****p < 0.0001, one-way ANOVA with Dunnett’s post-hoc analysis). All data are presented as mean ± SEM
Fig. 5
Fig. 5
STK25 regulates YAP phosphorylation in response to physiologic stimuli. a Immunoblot and quantification of YAP phosphorylation in HEK293A cells grown to low confluence or high confluence after transfection with the indicated siRNA (n = 3 biological replicates; *p < 0.05, unpaired t-test). b Cellular proliferation curves of control HEK293A clones and STK25 KO clones over the indicated time periods (n = 3 replicates per cell line; ***p < 0.001, ****p < 0.0001, two-way ANOVA with Tukey’s post-hoc test). c Representative immunoblot and quantification of YAP phosphorylation in IMR90 fibroblasts transfected with the indicated siRNA and held in suspension for the indicated time periods. d Quantification of the percentage of cells remaining in S/G2 phase following prolonged contact inhibition in hTERT-RPE-1-FUCCI cells transfected with the indicated siRNA (n = 4 biological replicates; **p < 0.01, ****p < 0.0001, one-way ANOVA with Dunnett’s post-hoc test). e Cytokinesis failure was pharmacologically induced in hTERT-RPE-1 cells to generate binucleated tetraploid cells, and the percentage of EdU-positive tetraploid cells following siRNA transfection was quantified. Cells were stained for DNA (white) and EdU incorporation (green). Scale bar, 20 µm. f Quantification of the percentage of EdU-positive binucleated tetraploid cells following transfection with the indicated siRNA. TP53 siRNA served as positive control (n = 4 biological replicates; *p < 0.05, one-way ANOVA with Dunnett’s post-hoc test). g Immunoblot and quantification of LATS1 hydrophobic motif (P-LATS-HM) and activation loop (P-LATS-AL) phosphorylation in either control HEK293A stably expressing Cas9 and a non-targeting sgRNA or STK25 KO 293A stably expressing Cas9 together with sgRNA 1 grown to confluence (n = 3 biological replicates; *p < 0.05, **p < 0.01, paired t-test). All data are presented as mean ± SEM
Fig. 6
Fig. 6
Loss of STK25 inactivates Hippo signaling in vivo. a Representative photographic images demonstrating gross morphology and size of livers dissected from STK25+/+ or STK25−/ mice. b Livers from STK25+/+ and STK25−/− mice were dissected and weighed; liver/body weight ratios were then plotted for analysis (n = 12 mice for STK25+/+ mice; n = 8 for STK25−/− mice. **p < 0.01, Mann–Whitney test). c qPCR analysis of validated YAP-target genes in the livers of STK25+/+ and STK25−/− mice (n = 3 biological replicates; *p < 0.05, ***p < 0.001, ****p < 0.0001, unpaired t-test). d Representative immunoblot of Hippo signaling components in the livers of STK25+/+ and STK25−/− mice. To probe for P-LATS-AL, endogenous LATS2 was first immunoprecipitated from tissue lysates and then re-analyzed via SDS–PAGE for phosphorylation status. e Quantitation of LATS phosphorylation and YAP phosphorylation in the livers of STK25+/+ and STK25−/− mice from d (n = 4 biological replicates, *p < 0.05, **p < 0.01, N.S. indicates “not significant,” unpaired t-test). f Quantitation of total protein levels of interest in the livers of STK25+/+ and STK25−/− mice (n = at least four biological replicates, *p < 0.05, **p < 0.01, ****p < 0.0001, unpaired t-test). g IHC staining for YAP was performed on sections of livers from STK25+/+ and STK25−/− mice. Representative ×40 images are presented here. Scale bar, 100 µm. h Quantitation of YAP staining intensity from g was performed and plotted for analysis (n = 4 biological replicates, each with three randomly chosen fields of view for quantitation; ****p < 0.0001, Mann–Whitney test). All data are presented as mean ± SEM
Fig. 7
Fig. 7
STK25 loss is common in human cancers and adversely affects patient survival. a Graphical representation of human cancers with the highest frequencies of STK25 deletion. Data was accessed using the cBioPortal online program (http://www.cbioportal.org/). b Survival data of sarcoma patients from the TCGA dataset were accessed using the Xenabrowser online program (https://xenabrowser.net/) and overall survival rates and times were assessed for patients with and without deletions of STK25 (*p = 0.0172, n = 215, log-rank test). c Proposed model of STK25 in Hippo tumor suppressor signaling

References

    1. Zanconato F, et al. Genome-wide association between YAP/TAZ/TEAD and AP-1 at enhancers drives oncogenic growth. Nat. Cell Biol. 2015;17:1218–1227. doi: 10.1038/ncb3216. - DOI - PMC - PubMed
    1. Zhang H, et al. TEAD transcription factors mediate the function of TAZ in cell growth and epithelial-mesenchymal transition. J. Biol. Chem. 2009;284:13355–13362. doi: 10.1074/jbc.M900843200. - DOI - PMC - PubMed
    1. Zhao B, Li L, Tumaneng K, Wang CY, Guan KL. A coordinated phosphorylation by Lats and CK1 regulates YAP stability through SCF(beta-TRCP) Genes Dev. 2010;24:72–85. doi: 10.1101/gad.1843810. - DOI - PMC - PubMed
    1. Wu S, Liu Y, Zheng Y, Dong J, Pan D. The TEAD/TEF family protein Scalloped mediates transcriptional output of the Hippo growth-regulatory pathway. Dev. Cell. 2008;14:388–398. doi: 10.1016/j.devcel.2008.01.007. - DOI - PubMed
    1. Zhang L, et al. The TEAD/TEF family of transcription factor Scalloped mediates Hippo signaling in organ size control. Dev. Cell. 2008;14:377–387. doi: 10.1016/j.devcel.2008.01.006. - DOI - PMC - PubMed

Publication types

MeSH terms

Substances