. 2019 Apr 4;10(1):1535.
doi: 10.1038/s41467-019-08949-w.

An alternative CTCF isoform antagonizes canonical CTCF occupancy and changes chromatin architecture to promote apoptosis

Affiliations

An alternative CTCF isoform antagonizes canonical CTCF occupancy and changes chromatin architecture to promote apoptosis

Jiao Li et al. Nat Commun. .

Abstract

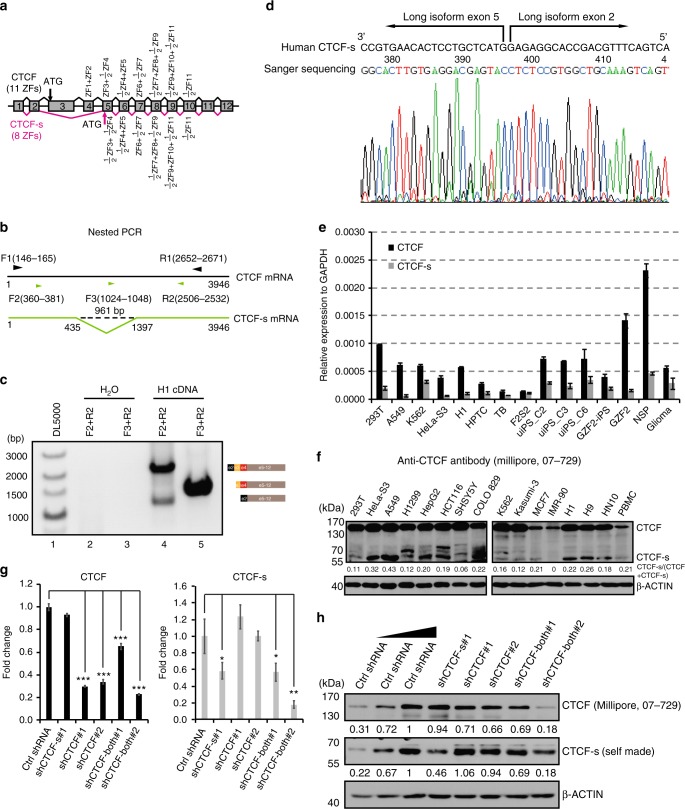
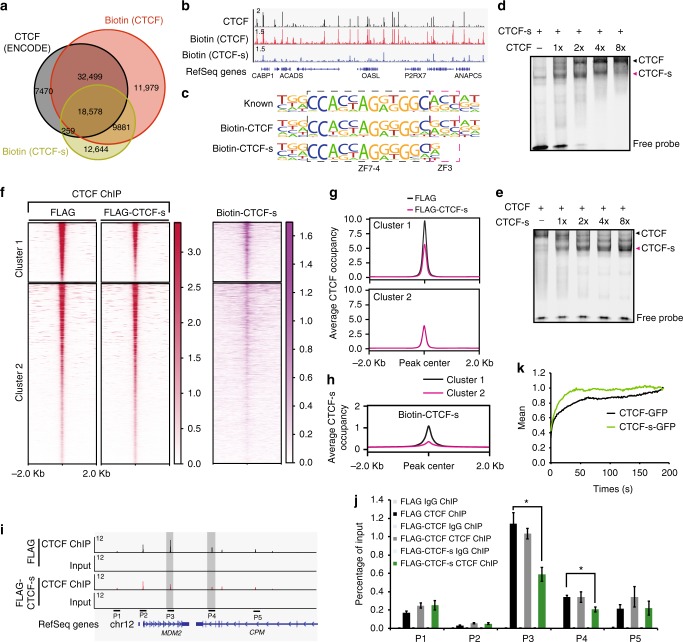
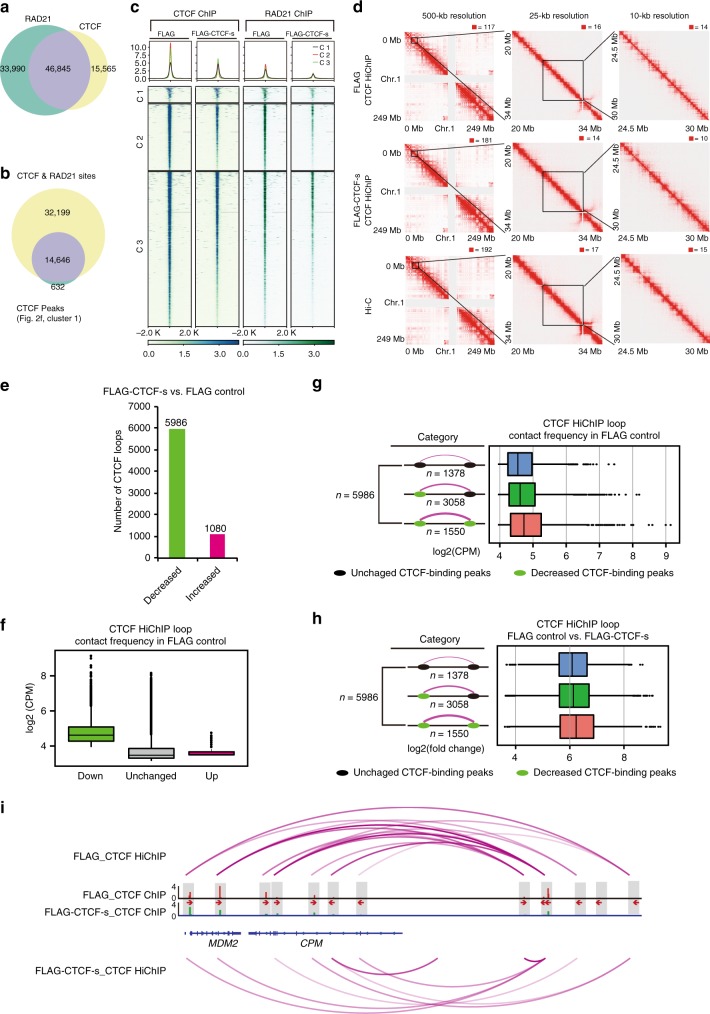
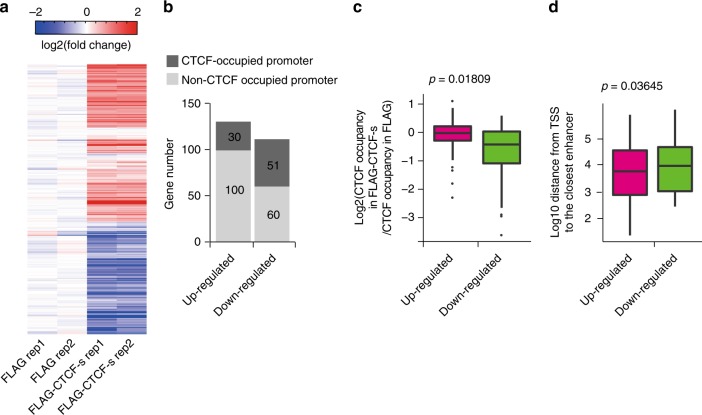
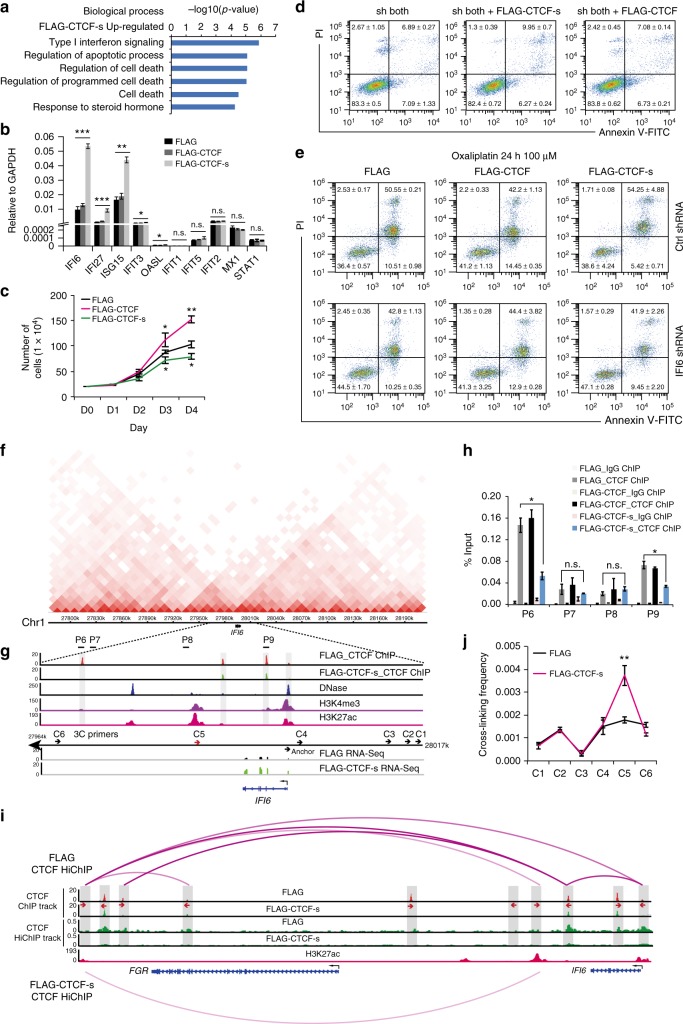
CTCF plays key roles in gene regulation, chromatin insulation, imprinting, X chromosome inactivation and organizing the higher-order chromatin architecture of mammalian genomes. Previous studies have mainly focused on the roles of the canonical CTCF isoform. Here, we explore the functions of an alternatively spliced human CTCF isoform in which exons 3 and 4 are skipped, producing a shorter isoform (CTCF-s). Functionally, we find that CTCF-s competes with the genome binding of canonical CTCF and binds a similar DNA sequence. CTCF-s binding disrupts CTCF/cohesin binding, alters CTCF-mediated chromatin looping and promotes the activation of IFI6 that leads to apoptosis. This effect is caused by an abnormal long-range interaction at the IFI6 enhancer and promoter. Taken together, this study reveals a non-canonical function for CTCF-s that antagonizes the genomic binding of canonical CTCF and cohesin, and that modulates chromatin looping and causes apoptosis by stimulating IFI6 expression.


Conflict of interest statement

The authors declare no competing interests.

Figures

Fig. 1
Fig. 1
Identification of an alternatively spliced CTCF-s isoform in the human genome. a Schematic representation of exons of the human CTCF gene. Transcripts including alternative exons 3 and 4 encoded the widely expressed canonical form of CTCF (top), and the CTCF-s isoform excluded exons 3 and 4. The canonical form of CTCF contained 11 ZFs, while CTCF-s effectively lacked the N terminal and 3 ZFs. b Strategy for detecting the CTCF short isoform. Black line represents the full length of CTCF mRNA (1−3946), and green line represents CTCF-s mRNA (1−435 joined with 1397−3946). Primer information was indicated based on the canonical long isoform. Convergent black arrows showed the positions of the first nested primers; green arrows indicated the position of the second nested PCR primers, with F2 and R2 for amplifying both CTCF and CTCF-s, F3 and R2 for amplifying CTCF only. c Nested PCR was used to validate the existence of the short isoform with the primers from (b). The constitution of each PCR product is presented on the right. d Chromatogram from Sanger sequencing of the lower band of panel (c), showing the junction at exons 2 and 5. e TaqMan RT-qPCR analysis of the relative expression levels of CTCF and CTCF-s in various human cell lines. Data were shown as mean ± s.d., n = 3 technological repeats. f Western blot of CTCF and CTCF-s in different human cell lines with anti-CTCF antibody (Millipore, 07-729). The locations of the full-length CTCF and CTCF-s were indicated. g RT-qPCR analysis of two different CTCF isoforms after specific shRNA knockdown. Data were shown as mean ± s.d. from n = 3 independent technological repeats with the indicated significance by using a two-tailed Student’s t test, *p < 0.05, **p < 0.01, ***p < 0.001. h Western blot analysis of two different CTCF isoforms after specific shRNA knockdown. Source data are provided as a Source Data file
Fig. 2
Fig. 2
CTCF-s has its specific genomic binding but also competes with CTCF in binding to their common targets. a Venn diagram showing the overlap of biotin-enriched CTCF or CTCF-s peaks with a normal CTCF ChIP-seq from ENCODE (GSE33213). b Genomic views of ChIP-seq intensities of CTCF (ENCODE), biotin ChIP-seq for biotin-CTCF and biotin-CTCF-s in HeLa-S3 cells at chromosome 12:121,055,606−121,842,881. c Consensus DNA binding motif generated from de novo motif discovery. The motif inside the black dotted box is bound by ZF4-7 of CTCF and the motif inside the magenta dotted box is bound by ZF3 of CTCF. d Electrophoresis mobility shift analysis (EMSA) showing DNA binding ability of CTCF and CTCF-s as the concentrations of CTCF increase. e EMSA showing DNA binding ability of CTCF and CTCF-s with increasing amounts of CTCF-s. f Heatmap showing the comparison of CTCF binding occupancies between FLAG control and FLAG-CTCF-s overexpression. Cluster 1 shows the significantly reduced occupancy of CTCF after CTCF-s overexpression; Cluster 2 shows no difference in the levels of CTCF genomic occupancy with or without CTCF-s overexpression. Heatmap on the right showing the biotin ChIP-seq signal for CTCF-s. g Tag density pileup for all CTCF peaks from clusters 1 and 2, respectively. h Tag density pileup for biotin-CTCF-s peaks from clusters 1 and 2, respectively. i Genomic view showing ChIP primers P1−P5 at MDM2-CPM loci in chromosome 12. Peaks marked by gray box represent two decreased CTCF peaks upon CTCF-s gain-of-function. j Verification of CTCF ChIP-seq data in chromosome 12 using ChIP-qPCR. IgG was used as a negative control. The locations of the primer pairs P1−P5 are indicated in panel (i). The data were represented as mean ± s.d. (n = 3 technological repeats) with the indicated significance by using a two-tailed Student’s t test (*p < 0.05). The entire experiment was performed three times. k FRAP analysis of GFP-CTCF and GFP-CTCF-s after irreversible photobleaching. Source data are provided as a Source Data file
Fig. 3
Fig. 3
CTCF-s competition causes the reduction of both CTCF and cohesin binding and alters CTCF-mediated chromatin looping. a Venn diagrams showing the overlap of RAD21 and CTCF peaks. b Venn diagrams showing the overlap of RAD21 binding sites with significantly decreased CTCF binding sites upon CTCF-s gain-of-function, from cluster 1 in Fig. 2f. c Heatmap and pileup for CTCF and RAD21 ChIP intensity in CTCF bound sites that decreased when FLAG-CTCF-s was overexpressed. d Raw interaction maps of CTCF HiChIP at a locus on chromosome 1 produced from FLAG control cells and cells with FLAG-CTCF-s overexpression and Hi-C data in HeLa-S3 cells drawn with the indicated resolutions and views. Numbers above the interaction maps correspond to maximum signal in the matrix. e Bar chart showing loop difference from HiChIP data in both FLAG control cells and cells with FLAG-CTCF-s overexpression. f Boxplot showing the distribution of loop intensities in average log2 counts per million (log2CPM) among the three loop classes (up, down and unchanged) from (e). The midline represents the second quartile, the bounds of box represent third quartile and first quartile. The whiskers indicate 1.5 × interquartile range and dots represent outliers. g Features of downregulated loops with distinct anchor features in FLAG control from (f). The loop anchor features were classified from the change of CTCF binding strength in FLAG control and FLAG-CTCF-s overexpressed samples. The midline represents the second quartile, while the bounds of box represent third quartile and first quartile, respectively. The whiskers indicate 1.5 × interquartile range and dots represent outliers. h Fold-change analysis of downregulated loops that were associated with distinct anchor features that were classified from FLAG control and FLAG-CTCF-s overexpressed samples after FLAG-CTCF-s gain-of-function. The midline represents the second quartile, the bounds of box represent third quartile and first quartile. The whiskers indicate 1.5 × interquartile range and dots represent outliers. i Example genomic view showing the changes of CTCF ChIP intensities and CTCF-mediated chromatin loops at the MDM2/CPM gene locus. The directionality of the motifs at CTCF loop anchors was indicated with red arrows
Fig. 4
Fig. 4
CTCF-s/CTCF competition and transcriptional regulation. a Hierarchical clustering of differentially expressed (DE) gene profiles after overexpression of FLAG-CTCF-s in HeLa-S3 cells. Fold-change was relative to the mean of the FLAG control. b Analysis of CTCF binding at promoters of DE genes, from panel (a). c CTCF-s downregulated genes tended to have decreased CTCF binding at their promoter regions. The center line represents the second quartile, the bounds of box represent third quartile and first quartile. The whiskers indicate 1.5 × interquartile range and dots represent outliers. d Upregulated genes by CTCF-s tended to have enhancers that were closer to the TSS than downregulated genes. The center line represents the second quartile, the bounds of box represent third quartile and first quartile. The whiskers indicate 1.5 × interquartile range and dots represent outliers. The statistical significance for the boxplots in (c, d) was assessed by Wilcoxon rank sum test
Fig. 5
Fig. 5
CTCF-s activates IFI6 by disrupting CTCF-mediated looping and establishing distal enhancer−promoter contacts. a GO analysis of upregulated genes after CTCF-s gain-of-function. b Relative expression of interferon-signaling-associated genes after CTCF and CTCF-s gain-of-function, respectively (mean ± s.d., two-tailed Student’s t test; n = 3 biological replicates, each biological replicate had three technical replicates). c Growth curves of HeLa-S3 cells with gain-of-function of FLAG, FLAG-CTCF and FLAG-CTCF-s, respectively. Data were shown as mean ± s.d. from three independent experiments with the indicated significance by using a two-tailed Student’s t test. d Effects of CTCF and CTCF-s overexpression on apoptosis in HeLa-S3 cells after knocking-down endogenous CTCF and CTCF-s. Data were shown as mean ± s.d., n = 3 biological replicates. e Apoptosis analysis of HeLa-S3 cells overexpressing FLAG, FLAG-CTCF and FLAG-CTCF-s following IFI6 knocking-down and treatment with oxaliplatin for 24 h. Data were shown as mean ± s.d. from two independent biological replicates. f Hi-C interaction map at IFI6 locus. g Genomic view showing CTCF ChIP-seq and RNA-seq data from FLAG and FLAG-CTCF-s, H3K4me3, H3K27ac and DNase-seq data at the IFI6 locus. h Verification of CTCF ChIP-seq data in IFI6 locus by using ChIP-qPCR. IgG was used as a negative control. The primers (from P6 to P9) were indicated in (g). The data were represented as mean ± s.d. with the indicated significance from a two-tailed Student’s t test, n = 3 technological replicates. i CTCF HiChIP interactions at IFI6 locus displayed with CTCF ChIP-seq and one-dimensional track of CTCF HiChIP in FLAG and FLAG-CTCF-s overexpressing cells. The directionality of the motifs at CTCF loop anchors was indicated with red arrows and gray bars. j 3C assay measuring the crosslinking frequency in FLAG and FLAG-CTCF-s overexpressing HeLa-S3 cells. IFI6 promoter (anchor) and six complementary primers (C1 to C6 in (g)) were tested by 3C-qPCR. The data were represented as mean ± s.d. with the indicated significance by using a two-tailed Student’s t test, n = 3 technological replicates. For statistical significance, *p < 0.05, **p < 0.01, ***p < 0.001, n.s. not significant. Source data are provided as a Source Data file

References

    1. Pombo A, Dillon N. Three-dimensional genome architecture: players and mechanisms. Nat. Rev. Mol. Cell Biol. 2015;16:245–257. doi: 10.1038/nrm3965. - DOI - PubMed
    1. Dekker J, Mirny L. The 3D genome as moderator of chromosomal communication. Cell. 2016;164:1110–1121. doi: 10.1016/j.cell.2016.02.007. - DOI - PMC - PubMed
    1. Bonev B, Cavalli G. Organization and function of the 3D genome. Nat. Rev. Genet. 2016;17:661–678. doi: 10.1038/nrg.2016.112. - DOI - PubMed
    1. Dixon JR, et al. Topological domains in mammalian genomes identified by analysis of chromatin interactions. Nature. 2012;485:376–380. doi: 10.1038/nature11082. - DOI - PMC - PubMed
    1. Tang Z, et al. CTCF-mediated uman 3D genome architecture reveals chromatin topology for transcription. Cell. 2015;163:1611–1627. doi: 10.1016/j.cell.2015.11.024. - DOI - PMC - PubMed

Publication types